Bossier City, Louisiana Submit your own pictures of this city and show them to the world
OSM Map
General Map
Google Map
MSN Map
OSM Map
General Map
Google Map
MSN Map
OSM Map
General Map
Google Map
MSN Map
OSM Map
General Map
Google Map
MSN Map
Please wait while loading the map...
Population in 2022: 62,635 (99% urban, 1% rural). Population change since 2000: +10.9%Males: 31,160 Females: 31,475
March 2022 cost of living index in Bossier City: 85.1 (less than average, U.S. average is 100) Percentage of residents living in poverty in 2022: 20.4%for White Non-Hispanic residents , 31.4% for Black residents , 31.5% for Hispanic or Latino residents , 77.8% for Native Hawaiian and other Pacific Islander residents , 15.0% for other race residents , 23.6% for two or more races residents )
Profiles of local businesses
Business Search - 14 Million verified businesses
Data:
Median household income ($)
Median household income (% change since 2000)
Household income diversity
Ratio of average income to average house value (%)
Ratio of average income to average rent
Median household income ($) - White
Median household income ($) - Black or African American
Median household income ($) - Asian
Median household income ($) - Hispanic or Latino
Median household income ($) - American Indian and Alaska Native
Median household income ($) - Multirace
Median household income ($) - Other Race
Median household income for houses/condos with a mortgage ($)
Median household income for apartments without a mortgage ($)
Races - White alone (%)
Races - White alone (% change since 2000)
Races - Black alone (%)
Races - Black alone (% change since 2000)
Races - American Indian alone (%)
Races - American Indian alone (% change since 2000)
Races - Asian alone (%)
Races - Asian alone (% change since 2000)
Races - Hispanic (%)
Races - Hispanic (% change since 2000)
Races - Native Hawaiian and Other Pacific Islander alone (%)
Races - Native Hawaiian and Other Pacific Islander alone (% change since 2000)
Races - Two or more races (%)
Races - Two or more races (% change since 2000)
Races - Other race alone (%)
Races - Other race alone (% change since 2000)
Racial diversity
Unemployment (%)
Unemployment (% change since 2000)
Unemployment (%) - White
Unemployment (%) - Black or African American
Unemployment (%) - Asian
Unemployment (%) - Hispanic or Latino
Unemployment (%) - American Indian and Alaska Native
Unemployment (%) - Multirace
Unemployment (%) - Other Race
Population density (people per square mile)
Population - Males (%)
Population - Females (%)
Population - Males (%) - White
Population - Males (%) - Black or African American
Population - Males (%) - Asian
Population - Males (%) - Hispanic or Latino
Population - Males (%) - American Indian and Alaska Native
Population - Males (%) - Multirace
Population - Males (%) - Other Race
Population - Females (%) - White
Population - Females (%) - Black or African American
Population - Females (%) - Asian
Population - Females (%) - Hispanic or Latino
Population - Females (%) - American Indian and Alaska Native
Population - Females (%) - Multirace
Population - Females (%) - Other Race
Coronavirus confirmed cases (Jun 10, 2024)
Deaths caused by coronavirus (Jun 10, 2024)
Coronavirus confirmed cases (per 100k population) (Jun 10, 2024)
Deaths caused by coronavirus (per 100k population) (Jun 10, 2024)
Daily increase in number of cases (Jun 10, 2024)
Weekly increase in number of cases (Jun 10, 2024)
Cases doubled (in days) (Jun 10, 2024)
Hospitalized patients (Apr 18, 2022)
Negative test results (Apr 18, 2022)
Total test results (Apr 18, 2022)
COVID Vaccine doses distributed (per 100k population) (Sep 19, 2023)
COVID Vaccine doses administered (per 100k population) (Sep 19, 2023)
COVID Vaccine doses distributed (Sep 19, 2023)
COVID Vaccine doses administered (Sep 19, 2023)
Likely homosexual households (%)
Likely homosexual households (% change since 2000)
Likely homosexual households - Lesbian couples (%)
Likely homosexual households - Lesbian couples (% change since 2000)
Likely homosexual households - Gay men (%)
Likely homosexual households - Gay men (% change since 2000)
Cost of living index
Median gross rent ($)
Median contract rent ($)
Median monthly housing costs ($)
Median house or condo value ($)
Median house or condo value ($ change since 2000)
Mean house or condo value by units in structure - 1, detached ($)
Mean house or condo value by units in structure - 1, attached ($)
Mean house or condo value by units in structure - 2 ($)
Mean house or condo value by units in structure by units in structure - 3 or 4 ($)
Mean house or condo value by units in structure - 5 or more ($)
Mean house or condo value by units in structure - Boat, RV, van, etc. ($)
Mean house or condo value by units in structure - Mobile home ($)
Median house or condo value ($) - White
Median house or condo value ($) - Black or African American
Median house or condo value ($) - Asian
Median house or condo value ($) - Hispanic or Latino
Median house or condo value ($) - American Indian and Alaska Native
Median house or condo value ($) - Multirace
Median house or condo value ($) - Other Race
Median resident age
Resident age diversity
Median resident age - Males
Median resident age - Females
Median resident age - White
Median resident age - Black or African American
Median resident age - Asian
Median resident age - Hispanic or Latino
Median resident age - American Indian and Alaska Native
Median resident age - Multirace
Median resident age - Other Race
Median resident age - Males - White
Median resident age - Males - Black or African American
Median resident age - Males - Asian
Median resident age - Males - Hispanic or Latino
Median resident age - Males - American Indian and Alaska Native
Median resident age - Males - Multirace
Median resident age - Males - Other Race
Median resident age - Females - White
Median resident age - Females - Black or African American
Median resident age - Females - Asian
Median resident age - Females - Hispanic or Latino
Median resident age - Females - American Indian and Alaska Native
Median resident age - Females - Multirace
Median resident age - Females - Other Race
Commute - mean travel time to work (minutes)
Travel time to work - Less than 5 minutes (%)
Travel time to work - Less than 5 minutes (% change since 2000)
Travel time to work - 5 to 9 minutes (%)
Travel time to work - 5 to 9 minutes (% change since 2000)
Travel time to work - 10 to 19 minutes (%)
Travel time to work - 10 to 19 minutes (% change since 2000)
Travel time to work - 20 to 29 minutes (%)
Travel time to work - 20 to 29 minutes (% change since 2000)
Travel time to work - 30 to 39 minutes (%)
Travel time to work - 30 to 39 minutes (% change since 2000)
Travel time to work - 40 to 59 minutes (%)
Travel time to work - 40 to 59 minutes (% change since 2000)
Travel time to work - 60 to 89 minutes (%)
Travel time to work - 60 to 89 minutes (% change since 2000)
Travel time to work - 90 or more minutes (%)
Travel time to work - 90 or more minutes (% change since 2000)
Marital status - Never married (%)
Marital status - Now married (%)
Marital status - Separated (%)
Marital status - Widowed (%)
Marital status - Divorced (%)
Median family income ($)
Median family income (% change since 2000)
Median non-family income ($)
Median non-family income (% change since 2000)
Median per capita income ($)
Median per capita income (% change since 2000)
Median family income ($) - White
Median family income ($) - Black or African American
Median family income ($) - Asian
Median family income ($) - Hispanic or Latino
Median family income ($) - American Indian and Alaska Native
Median family income ($) - Multirace
Median family income ($) - Other Race
Median year house/condo built
Median year apartment built
Year house built - Built 2005 or later (%)
Year house built - Built 2000 to 2004 (%)
Year house built - Built 1990 to 1999 (%)
Year house built - Built 1980 to 1989 (%)
Year house built - Built 1970 to 1979 (%)
Year house built - Built 1960 to 1969 (%)
Year house built - Built 1950 to 1959 (%)
Year house built - Built 1940 to 1949 (%)
Year house built - Built 1939 or earlier (%)
Average household size
Household density (households per square mile)
Average household size - White
Average household size - Black or African American
Average household size - Asian
Average household size - Hispanic or Latino
Average household size - American Indian and Alaska Native
Average household size - Multirace
Average household size - Other Race
Occupied housing units (%)
Vacant housing units (%)
Owner occupied housing units (%)
Renter occupied housing units (%)
Vacancy status - For rent (%)
Vacancy status - For sale only (%)
Vacancy status - Rented or sold, not occupied (%)
Vacancy status - For seasonal, recreational, or occasional use (%)
Vacancy status - For migrant workers (%)
Vacancy status - Other vacant (%)
Residents with income below the poverty level (%)
Residents with income below 50% of the poverty level (%)
Children below poverty level (%)
Poor families by family type - Married-couple family (%)
Poor families by family type - Male, no wife present (%)
Poor families by family type - Female, no husband present (%)
Poverty status for native-born residents (%)
Poverty status for foreign-born residents (%)
Poverty among high school graduates not in families (%)
Poverty among people who did not graduate high school not in families (%)
Residents with income below the poverty level (%) - White
Residents with income below the poverty level (%) - Black or African American
Residents with income below the poverty level (%) - Asian
Residents with income below the poverty level (%) - Hispanic or Latino
Residents with income below the poverty level (%) - American Indian and Alaska Native
Residents with income below the poverty level (%) - Multirace
Residents with income below the poverty level (%) - Other Race
Air pollution - Air Quality Index (AQI)
Air pollution - CO
Air pollution - NO2
Air pollution - SO2
Air pollution - Ozone
Air pollution - PM10
Air pollution - PM25
Air pollution - Pb
Crime - Murders per 100,000 population
Crime - Rapes per 100,000 population
Crime - Robberies per 100,000 population
Crime - Assaults per 100,000 population
Crime - Burglaries per 100,000 population
Crime - Thefts per 100,000 population
Crime - Auto thefts per 100,000 population
Crime - Arson per 100,000 population
Crime - City-data.com crime index
Crime - Violent crime index
Crime - Property crime index
Crime - Murders per 100,000 population (5 year average)
Crime - Rapes per 100,000 population (5 year average)
Crime - Robberies per 100,000 population (5 year average)
Crime - Assaults per 100,000 population (5 year average)
Crime - Burglaries per 100,000 population (5 year average)
Crime - Thefts per 100,000 population (5 year average)
Crime - Auto thefts per 100,000 population (5 year average)
Crime - Arson per 100,000 population (5 year average)
Crime - City-data.com crime index (5 year average)
Crime - Violent crime index (5 year average)
Crime - Property crime index (5 year average)
1996 Presidential Elections Results (%) - Democratic Party (Clinton)
1996 Presidential Elections Results (%) - Republican Party (Dole)
1996 Presidential Elections Results (%) - Other
2000 Presidential Elections Results (%) - Democratic Party (Gore)
2000 Presidential Elections Results (%) - Republican Party (Bush)
2000 Presidential Elections Results (%) - Other
2004 Presidential Elections Results (%) - Democratic Party (Kerry)
2004 Presidential Elections Results (%) - Republican Party (Bush)
2004 Presidential Elections Results (%) - Other
2008 Presidential Elections Results (%) - Democratic Party (Obama)
2008 Presidential Elections Results (%) - Republican Party (McCain)
2008 Presidential Elections Results (%) - Other
2012 Presidential Elections Results (%) - Democratic Party (Obama)
2012 Presidential Elections Results (%) - Republican Party (Romney)
2012 Presidential Elections Results (%) - Other
2016 Presidential Elections Results (%) - Democratic Party (Clinton)
2016 Presidential Elections Results (%) - Republican Party (Trump)
2016 Presidential Elections Results (%) - Other
2020 Presidential Elections Results (%) - Democratic Party (Biden)
2020 Presidential Elections Results (%) - Republican Party (Trump)
2020 Presidential Elections Results (%) - Other
Ancestries Reported - Arab (%)
Ancestries Reported - Czech (%)
Ancestries Reported - Danish (%)
Ancestries Reported - Dutch (%)
Ancestries Reported - English (%)
Ancestries Reported - French (%)
Ancestries Reported - French Canadian (%)
Ancestries Reported - German (%)
Ancestries Reported - Greek (%)
Ancestries Reported - Hungarian (%)
Ancestries Reported - Irish (%)
Ancestries Reported - Italian (%)
Ancestries Reported - Lithuanian (%)
Ancestries Reported - Norwegian (%)
Ancestries Reported - Polish (%)
Ancestries Reported - Portuguese (%)
Ancestries Reported - Russian (%)
Ancestries Reported - Scotch-Irish (%)
Ancestries Reported - Scottish (%)
Ancestries Reported - Slovak (%)
Ancestries Reported - Subsaharan African (%)
Ancestries Reported - Swedish (%)
Ancestries Reported - Swiss (%)
Ancestries Reported - Ukrainian (%)
Ancestries Reported - United States (%)
Ancestries Reported - Welsh (%)
Ancestries Reported - West Indian (%)
Ancestries Reported - Other (%)
Educational Attainment - No schooling completed (%)
Educational Attainment - Less than high school (%)
Educational Attainment - High school or equivalent (%)
Educational Attainment - Less than 1 year of college (%)
Educational Attainment - 1 or more years of college (%)
Educational Attainment - Associate degree (%)
Educational Attainment - Bachelor's degree (%)
Educational Attainment - Master's degree (%)
Educational Attainment - Professional school degree (%)
Educational Attainment - Doctorate degree (%)
School Enrollment - Nursery, preschool (%)
School Enrollment - Kindergarten (%)
School Enrollment - Grade 1 to 4 (%)
School Enrollment - Grade 5 to 8 (%)
School Enrollment - Grade 9 to 12 (%)
School Enrollment - College undergrad (%)
School Enrollment - Graduate or professional (%)
School Enrollment - Not enrolled in school (%)
School enrollment - Public schools (%)
School enrollment - Private schools (%)
School enrollment - Not enrolled (%)
Median number of rooms in houses and condos
Median number of rooms in apartments
Housing units lacking complete plumbing facilities (%)
Housing units lacking complete kitchen facilities (%)
Density of houses
Urban houses (%)
Rural houses (%)
Households with people 60 years and over (%)
Households with people 65 years and over (%)
Households with people 75 years and over (%)
Households with one or more nonrelatives (%)
Households with no nonrelatives (%)
Population in households (%)
Family households (%)
Nonfamily households (%)
Population in families (%)
Family households with own children (%)
Median number of bedrooms in owner occupied houses
Mean number of bedrooms in owner occupied houses
Median number of bedrooms in renter occupied houses
Mean number of bedrooms in renter occupied houses
Median number of vehichles in owner occupied houses
Mean number of vehichles in owner occupied houses
Median number of vehichles in renter occupied houses
Mean number of vehichles in renter occupied houses
Mortgage status - with mortgage (%)
Mortgage status - with second mortgage (%)
Mortgage status - with home equity loan (%)
Mortgage status - with both second mortgage and home equity loan (%)
Mortgage status - without a mortgage (%)
Average family size
Average family size - White
Average family size - Black or African American
Average family size - Asian
Average family size - Hispanic or Latino
Average family size - American Indian and Alaska Native
Average family size - Multirace
Average family size - Other Race
Geographical mobility - Same house 1 year ago (%)
Geographical mobility - Moved within same county (%)
Geographical mobility - Moved from different county within same state (%)
Geographical mobility - Moved from different state (%)
Geographical mobility - Moved from abroad (%)
Place of birth - Born in state of residence (%)
Place of birth - Born in other state (%)
Place of birth - Native, outside of US (%)
Place of birth - Foreign born (%)
Housing units in structures - 1, detached (%)
Housing units in structures - 1, attached (%)
Housing units in structures - 2 (%)
Housing units in structures - 3 or 4 (%)
Housing units in structures - 5 to 9 (%)
Housing units in structures - 10 to 19 (%)
Housing units in structures - 20 to 49 (%)
Housing units in structures - 50 or more (%)
Housing units in structures - Mobile home (%)
Housing units in structures - Boat, RV, van, etc. (%)
House/condo owner moved in on average (years ago)
Renter moved in on average (years ago)
Year householder moved into unit - Moved in 1999 to March 2000 (%)
Year householder moved into unit - Moved in 1995 to 1998 (%)
Year householder moved into unit - Moved in 1990 to 1994 (%)
Year householder moved into unit - Moved in 1980 to 1989 (%)
Year householder moved into unit - Moved in 1970 to 1979 (%)
Year householder moved into unit - Moved in 1969 or earlier (%)
Means of transportation to work - Drove car alone (%)
Means of transportation to work - Carpooled (%)
Means of transportation to work - Public transportation (%)
Means of transportation to work - Bus or trolley bus (%)
Means of transportation to work - Streetcar or trolley car (%)
Means of transportation to work - Subway or elevated (%)
Means of transportation to work - Railroad (%)
Means of transportation to work - Ferryboat (%)
Means of transportation to work - Taxicab (%)
Means of transportation to work - Motorcycle (%)
Means of transportation to work - Bicycle (%)
Means of transportation to work - Walked (%)
Means of transportation to work - Other means (%)
Working at home (%)
Industry diversity
Most Common Industries - Agriculture, forestry, fishing and hunting, and mining (%)
Most Common Industries - Agriculture, forestry, fishing and hunting (%)
Most Common Industries - Mining, quarrying, and oil and gas extraction (%)
Most Common Industries - Construction (%)
Most Common Industries - Manufacturing (%)
Most Common Industries - Wholesale trade (%)
Most Common Industries - Retail trade (%)
Most Common Industries - Transportation and warehousing, and utilities (%)
Most Common Industries - Transportation and warehousing (%)
Most Common Industries - Utilities (%)
Most Common Industries - Information (%)
Most Common Industries - Finance and insurance, and real estate and rental and leasing (%)
Most Common Industries - Finance and insurance (%)
Most Common Industries - Real estate and rental and leasing (%)
Most Common Industries - Professional, scientific, and management, and administrative and waste management services (%)
Most Common Industries - Professional, scientific, and technical services (%)
Most Common Industries - Management of companies and enterprises (%)
Most Common Industries - Administrative and support and waste management services (%)
Most Common Industries - Educational services, and health care and social assistance (%)
Most Common Industries - Educational services (%)
Most Common Industries - Health care and social assistance (%)
Most Common Industries - Arts, entertainment, and recreation, and accommodation and food services (%)
Most Common Industries - Arts, entertainment, and recreation (%)
Most Common Industries - Accommodation and food services (%)
Most Common Industries - Other services, except public administration (%)
Most Common Industries - Public administration (%)
Occupation diversity
Most Common Occupations - Management, business, science, and arts occupations (%)
Most Common Occupations - Management, business, and financial occupations (%)
Most Common Occupations - Management occupations (%)
Most Common Occupations - Business and financial operations occupations (%)
Most Common Occupations - Computer, engineering, and science occupations (%)
Most Common Occupations - Computer and mathematical occupations (%)
Most Common Occupations - Architecture and engineering occupations (%)
Most Common Occupations - Life, physical, and social science occupations (%)
Most Common Occupations - Education, legal, community service, arts, and media occupations (%)
Most Common Occupations - Community and social service occupations (%)
Most Common Occupations - Legal occupations (%)
Most Common Occupations - Education, training, and library occupations (%)
Most Common Occupations - Arts, design, entertainment, sports, and media occupations (%)
Most Common Occupations - Healthcare practitioners and technical occupations (%)
Most Common Occupations - Health diagnosing and treating practitioners and other technical occupations (%)
Most Common Occupations - Health technologists and technicians (%)
Most Common Occupations - Service occupations (%)
Most Common Occupations - Healthcare support occupations (%)
Most Common Occupations - Protective service occupations (%)
Most Common Occupations - Fire fighting and prevention, and other protective service workers including supervisors (%)
Most Common Occupations - Law enforcement workers including supervisors (%)
Most Common Occupations - Food preparation and serving related occupations (%)
Most Common Occupations - Building and grounds cleaning and maintenance occupations (%)
Most Common Occupations - Personal care and service occupations (%)
Most Common Occupations - Sales and office occupations (%)
Most Common Occupations - Sales and related occupations (%)
Most Common Occupations - Office and administrative support occupations (%)
Most Common Occupations - Natural resources, construction, and maintenance occupations (%)
Most Common Occupations - Farming, fishing, and forestry occupations (%)
Most Common Occupations - Construction and extraction occupations (%)
Most Common Occupations - Installation, maintenance, and repair occupations (%)
Most Common Occupations - Production, transportation, and material moving occupations (%)
Most Common Occupations - Production occupations (%)
Most Common Occupations - Transportation occupations (%)
Most Common Occupations - Material moving occupations (%)
People in Group quarters - Institutionalized population (%)
People in Group quarters - Correctional institutions (%)
People in Group quarters - Federal prisons and detention centers (%)
People in Group quarters - Halfway houses (%)
People in Group quarters - Local jails and other confinement facilities (including police lockups) (%)
People in Group quarters - Military disciplinary barracks (%)
People in Group quarters - State prisons (%)
People in Group quarters - Other types of correctional institutions (%)
People in Group quarters - Nursing homes (%)
People in Group quarters - Hospitals/wards, hospices, and schools for the handicapped (%)
People in Group quarters - Hospitals/wards and hospices for chronically ill (%)
People in Group quarters - Hospices or homes for chronically ill (%)
People in Group quarters - Military hospitals or wards for chronically ill (%)
People in Group quarters - Other hospitals or wards for chronically ill (%)
People in Group quarters - Hospitals or wards for drug/alcohol abuse (%)
People in Group quarters - Mental (Psychiatric) hospitals or wards (%)
People in Group quarters - Schools, hospitals, or wards for the mentally retarded (%)
People in Group quarters - Schools, hospitals, or wards for the physically handicapped (%)
People in Group quarters - Institutions for the deaf (%)
People in Group quarters - Institutions for the blind (%)
People in Group quarters - Orthopedic wards and institutions for the physically handicapped (%)
People in Group quarters - Wards in general hospitals for patients who have no usual home elsewhere (%)
People in Group quarters - Wards in military hospitals for patients who have no usual home elsewhere (%)
People in Group quarters - Juvenile institutions (%)
People in Group quarters - Long-term care (%)
People in Group quarters - Homes for abused, dependent, and neglected children (%)
People in Group quarters - Residential treatment centers for emotionally disturbed children (%)
People in Group quarters - Training schools for juvenile delinquents (%)
People in Group quarters - Short-term care, detention or diagnostic centers for delinquent children (%)
People in Group quarters - Type of juvenile institution unknown (%)
People in Group quarters - Noninstitutionalized population (%)
People in Group quarters - College dormitories (includes college quarters off campus) (%)
People in Group quarters - Military quarters (%)
People in Group quarters - On base (%)
People in Group quarters - Barracks, unaccompanied personnel housing (UPH), (Enlisted/Officer), ;and similar group living quarters for military personnel (%)
People in Group quarters - Transient quarters for temporary residents (%)
People in Group quarters - Military ships (%)
People in Group quarters - Group homes (%)
People in Group quarters - Homes or halfway houses for drug/alcohol abuse (%)
People in Group quarters - Homes for the mentally ill (%)
People in Group quarters - Homes for the mentally retarded (%)
People in Group quarters - Homes for the physically handicapped (%)
People in Group quarters - Other group homes (%)
People in Group quarters - Religious group quarters (%)
People in Group quarters - Dormitories (%)
People in Group quarters - Agriculture workers' dormitories on farms (%)
People in Group quarters - Job Corps and vocational training facilities (%)
People in Group quarters - Other workers' dormitories (%)
People in Group quarters - Crews of maritime vessels (%)
People in Group quarters - Other nonhousehold living situations (%)
People in Group quarters - Other noninstitutional group quarters (%)
Residents speaking English at home (%)
Residents speaking English at home - Born in the United States (%)
Residents speaking English at home - Native, born elsewhere (%)
Residents speaking English at home - Foreign born (%)
Residents speaking Spanish at home (%)
Residents speaking Spanish at home - Born in the United States (%)
Residents speaking Spanish at home - Native, born elsewhere (%)
Residents speaking Spanish at home - Foreign born (%)
Residents speaking other language at home (%)
Residents speaking other language at home - Born in the United States (%)
Residents speaking other language at home - Native, born elsewhere (%)
Residents speaking other language at home - Foreign born (%)
Class of Workers - Employee of private company (%)
Class of Workers - Self-employed in own incorporated business (%)
Class of Workers - Private not-for-profit wage and salary workers (%)
Class of Workers - Local government workers (%)
Class of Workers - State government workers (%)
Class of Workers - Federal government workers (%)
Class of Workers - Self-employed workers in own not incorporated business and Unpaid family workers (%)
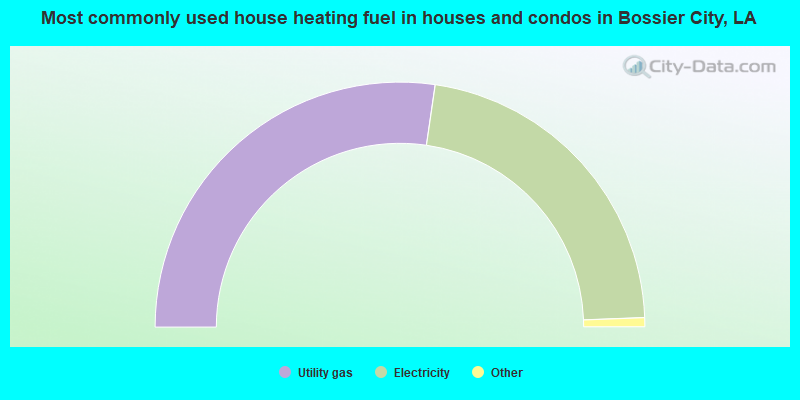
House heating fuel used in houses and condos - Utility gas (%)
House heating fuel used in houses and condos - Bottled, tank, or LP gas (%)
House heating fuel used in houses and condos - Electricity (%)
House heating fuel used in houses and condos - Fuel oil, kerosene, etc. (%)
House heating fuel used in houses and condos - Coal or coke (%)
House heating fuel used in houses and condos - Wood (%)
House heating fuel used in houses and condos - Solar energy (%)
House heating fuel used in houses and condos - Other fuel (%)
House heating fuel used in houses and condos - No fuel used (%)
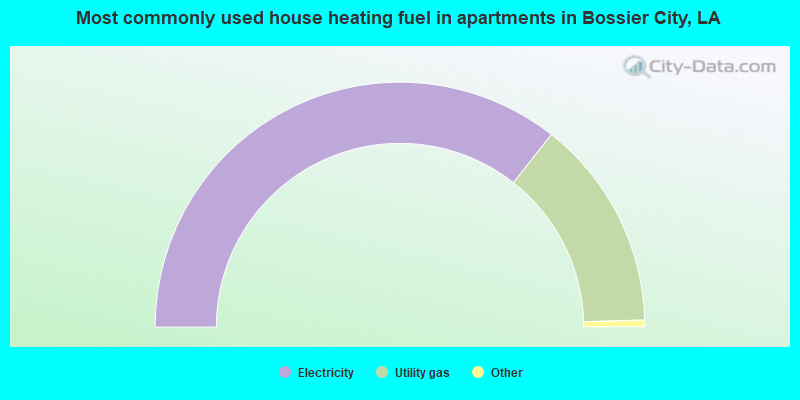
House heating fuel used in apartments - Utility gas (%)
House heating fuel used in apartments - Bottled, tank, or LP gas (%)
House heating fuel used in apartments - Electricity (%)
House heating fuel used in apartments - Fuel oil, kerosene, etc. (%)
House heating fuel used in apartments - Coal or coke (%)
House heating fuel used in apartments - Wood (%)
House heating fuel used in apartments - Solar energy (%)
House heating fuel used in apartments - Other fuel (%)
House heating fuel used in apartments - No fuel used (%)
Armed forces status - In Armed Forces (%)
Armed forces status - Civilian (%)
Armed forces status - Civilian - Veteran (%)
Armed forces status - Civilian - Nonveteran (%)
Fatal accidents locations in years 2005-2021
Fatal accidents locations in 2005
Fatal accidents locations in 2006
Fatal accidents locations in 2007
Fatal accidents locations in 2008
Fatal accidents locations in 2009
Fatal accidents locations in 2010
Fatal accidents locations in 2011
Fatal accidents locations in 2012
Fatal accidents locations in 2013
Fatal accidents locations in 2014
Fatal accidents locations in 2015
Fatal accidents locations in 2016
Fatal accidents locations in 2017
Fatal accidents locations in 2018
Fatal accidents locations in 2019
Fatal accidents locations in 2020
Fatal accidents locations in 2021
Alcohol use - People drinking some alcohol every month (%)
Alcohol use - People not drinking at all (%)
Alcohol use - Average days/month drinking alcohol
Alcohol use - Average drinks/week
Alcohol use - Average days/year people drink much
Audiometry - Average condition of hearing (%)
Audiometry - People that can hear a whisper from across a quiet room (%)
Audiometry - People that can hear normal voice from across a quiet room (%)
Audiometry - Ears ringing, roaring, buzzing (%)
Audiometry - Had a job exposure to loud noise (%)
Audiometry - Had off-work exposure to loud noise (%)
Blood Pressure & Cholesterol - Has high blood pressure (%)
Blood Pressure & Cholesterol - Checking blood pressure at home (%)
Blood Pressure & Cholesterol - Frequently checking blood cholesterol (%)
Blood Pressure & Cholesterol - Has high cholesterol level (%)
Consumer Behavior - Money monthly spent on food at supermarket/grocery store
Consumer Behavior - Money monthly spent on food at other stores
Consumer Behavior - Money monthly spent on eating out
Consumer Behavior - Money monthly spent on carryout/delivered foods
Consumer Behavior - Income spent on food at supermarket/grocery store (%)
Consumer Behavior - Income spent on food at other stores (%)
Consumer Behavior - Income spent on eating out (%)
Consumer Behavior - Income spent on carryout/delivered foods (%)
Current Health Status - General health condition (%)
Current Health Status - Blood donors (%)
Current Health Status - Has blood ever tested for HIV virus (%)
Current Health Status - Left-handed people (%)
Dermatology - People using sunscreen (%)
Diabetes - Diabetics (%)
Diabetes - Had a blood test for high blood sugar (%)
Diabetes - People taking insulin (%)
Diet Behavior & Nutrition - Diet health (%)
Diet Behavior & Nutrition - Milk product consumption (# of products/month)
Diet Behavior & Nutrition - Meals not home prepared (#/week)
Diet Behavior & Nutrition - Meals from fast food or pizza place (#/week)
Diet Behavior & Nutrition - Ready-to-eat foods (#/month)
Diet Behavior & Nutrition - Frozen meals/pizza (#/month)
Drug Use - People that ever used marijuana or hashish (%)
Drug Use - Ever used hard drugs (%)
Drug Use - Ever used any form of cocaine (%)
Drug Use - Ever used heroin (%)
Drug Use - Ever used methamphetamine (%)
Health Insurance - People covered by health insurance (%)
Kidney Conditions-Urology - Avg. # of times urinating at night
Medical Conditions - People with asthma (%)
Medical Conditions - People with anemia (%)
Medical Conditions - People with psoriasis (%)
Medical Conditions - People with overweight (%)
Medical Conditions - Elderly people having difficulties in thinking or remembering (%)
Medical Conditions - People who ever received blood transfusion (%)
Medical Conditions - People having trouble seeing even with glass/contacts (%)
Medical Conditions - People with arthritis (%)
Medical Conditions - People with gout (%)
Medical Conditions - People with congestive heart failure (%)
Medical Conditions - People with coronary heart disease (%)
Medical Conditions - People with angina pectoris (%)
Medical Conditions - People who ever had heart attack (%)
Medical Conditions - People who ever had stroke (%)
Medical Conditions - People with emphysema (%)
Medical Conditions - People with thyroid problem (%)
Medical Conditions - People with chronic bronchitis (%)
Medical Conditions - People with any liver condition (%)
Medical Conditions - People who ever had cancer or malignancy (%)
Mental Health - People who have little interest in doing things (%)
Mental Health - People feeling down, depressed, or hopeless (%)
Mental Health - People who have trouble sleeping or sleeping too much (%)
Mental Health - People feeling tired or having little energy (%)
Mental Health - People with poor appetite or overeating (%)
Mental Health - People feeling bad about themself (%)
Mental Health - People who have trouble concentrating on things (%)
Mental Health - People moving or speaking slowly or too fast (%)
Mental Health - People having thoughts they would be better off dead (%)
Oral Health - Average years since last visit a dentist
Oral Health - People embarrassed because of mouth (%)
Oral Health - People with gum disease (%)
Oral Health - General health of teeth and gums (%)
Oral Health - Average days a week using dental floss/device
Oral Health - Average days a week using mouthwash for dental problem
Oral Health - Average number of teeth
Pesticide Use - Households using pesticides to control insects (%)
Pesticide Use - Households using pesticides to kill weeds (%)
Physical Activity - People doing vigorous-intensity work activities (%)
Physical Activity - People doing moderate-intensity work activities (%)
Physical Activity - People walking or bicycling (%)
Physical Activity - People doing vigorous-intensity recreational activities (%)
Physical Activity - People doing moderate-intensity recreational activities (%)
Physical Activity - Average hours a day doing sedentary activities
Physical Activity - Average hours a day watching TV or videos
Physical Activity - Average hours a day using computer
Physical Functioning - People having limitations keeping them from working (%)
Physical Functioning - People limited in amount of work they can do (%)
Physical Functioning - People that need special equipment to walk (%)
Physical Functioning - People experiencing confusion/memory problems (%)
Physical Functioning - People requiring special healthcare equipment (%)
Prescription Medications - Average number of prescription medicines taking
Preventive Aspirin Use - Adults 40+ taking low-dose aspirin (%)
Reproductive Health - Vaginal deliveries (%)
Reproductive Health - Cesarean deliveries (%)
Reproductive Health - Deliveries resulted in a live birth (%)
Reproductive Health - Pregnancies resulted in a delivery (%)
Reproductive Health - Women breastfeeding newborns (%)
Reproductive Health - Women that had a hysterectomy (%)
Reproductive Health - Women that had both ovaries removed (%)
Reproductive Health - Women that have ever taken birth control pills (%)
Reproductive Health - Women taking birth control pills (%)
Reproductive Health - Women that have ever used Depo-Provera or injectables (%)
Reproductive Health - Women that have ever used female hormones (%)
Sexual Behavior - People 18+ that ever had sex (vaginal, anal, or oral) (%)
Sexual Behavior - Males 18+ that ever had vaginal sex with a woman (%)
Sexual Behavior - Males 18+ that ever performed oral sex on a woman (%)
Sexual Behavior - Males 18+ that ever had anal sex with a woman (%)
Sexual Behavior - Males 18+ that ever had any sex with a man (%)
Sexual Behavior - Females 18+ that ever had vaginal sex with a man (%)
Sexual Behavior - Females 18+ that ever performed oral sex on a man (%)
Sexual Behavior - Females 18+ that ever had anal sex with a man (%)
Sexual Behavior - Females 18+ that ever had any kind of sex with a woman (%)
Sexual Behavior - Average age people first had sex
Sexual Behavior - Average number of female sex partners in lifetime (males 18+)
Sexual Behavior - Average number of female vaginal sex partners in lifetime (males 18+)
Sexual Behavior - Average age people first performed oral sex on a woman (18+)
Sexual Behavior - Average number of woman performed oral sex on in lifetime (18+)
Sexual Behavior - Average number of male sex partners in lifetime (males 18+)
Sexual Behavior - Average number of male anal sex partners in lifetime (males 18+)
Sexual Behavior - Average age people first performed oral sex on a man (18+)
Sexual Behavior - Average number of male oral sex partners in lifetime (18+)
Sexual Behavior - People using protection when performing oral sex (%)
Sexual Behavior - Average number of times people have vaginal or anal sex a year
Sexual Behavior - People having sex without condom (%)
Sexual Behavior - Average number of male sex partners in lifetime (females 18+)
Sexual Behavior - Average number of male vaginal sex partners in lifetime (females 18+)
Sexual Behavior - Average number of female sex partners in lifetime (females 18+)
Sexual Behavior - Circumcised males 18+ (%)
Sleep Disorders - Average hours sleeping at night
Sleep Disorders - People that has trouble sleeping (%)
Smoking-Cigarette Use - People smoking cigarettes (%)
Taste & Smell - People 40+ having problems with smell (%)
Taste & Smell - People 40+ having problems with taste (%)
Taste & Smell - People 40+ that ever had wisdom teeth removed (%)
Taste & Smell - People 40+ that ever had tonsils teeth removed (%)
Taste & Smell - People 40+ that ever had a loss of consciousness because of a head injury (%)
Taste & Smell - People 40+ that ever had a broken nose or other serious injury to face or skull (%)
Taste & Smell - People 40+ that ever had two or more sinus infections (%)
Weight - Average height (inches)
Weight - Average weight (pounds)
Weight - Average BMI
Weight - People that are obese (%)
Weight - People that ever were obese (%)
Weight - People trying to lose weight (%)
The City-Data.com crime index weighs serious crimes and violent crimes more heavily. Higher means more crime, U.S. average is 246.1. It adjusts for the number of visitors and daily workers commuting into cities.
- means the value is smaller than the state average.
- means the value is about the same as the state average.
- means the value is bigger than the state average.
- means the value is much bigger than the state average.
Crime rate in Bossier City detailed stats: murders, rapes, robberies, assaults, burglaries, thefts, arson Officers per 1,000 residents here:
2.34Louisiana average:
3.56
Latest news from Bossier City, LA collected exclusively by city-data.com from local newspapers, TV, and radio stations
Ancestries: American (11.0%), Irish (4.9%), German (4.5%), English (4.5%), African (2.0%), European (1.3%).
Current Local Time:
Land area: 40.8 square miles.
Population density: 1,534 people per square mile (low).
3,485 residents are foreign born (2.9% Latin America , 1.9% Asia ).
This city:
5.5%Louisiana:
4.2%
Median real estate property taxes paid for housing units with mortgages in 2022: $1,293 (0.6%)Median real estate property taxes paid for housing units with no mortgage in 2022: $744 (0.4%)
Nearest city with pop. 200,000+: Shreveport, LA
Nearest city with pop. 1,000,000+: Dallas, TX
Nearest cities:
Latitude: 32.52 N, Longitude: 93.69 W
Daytime population change due to commuting: +8,168 (+12.9%)Workers who live and work in this city: 14,315 (49.1%)
Area code commonly used in this area: 318
Bossier City tourist attractions:
Boomtown Casino, Bossier City, LA Diamond Jacks Casino and Resort, Bossier City, LA Horseshoe Casino and Hotel, Bossier City, LA Louisiana Boardwalk, Bossier City, LA Horseshoe Casino Luxury All-Suite Hotel Pierre Bossier Mall, Bossier City, LA Single-family new house construction building permits:
2022: 238 buildings , average cost: $215,5002021: 332 buildings , average cost: $175,3002020: 336 buildings , average cost: $157,5002019: 338 buildings , average cost: $165,3002018: 322 buildings , average cost: $166,7002017: 322 buildings , average cost: $169,2002016: 280 buildings , average cost: $165,3002015: 250 buildings , average cost: $160,2002014: 586 buildings , average cost: $122,5002013: 563 buildings , average cost: $122,5002012: 467 buildings , average cost: $122,5002011: 380 buildings , average cost: $122,3002010: 393 buildings , average cost: $123,2002009: 375 buildings , average cost: $119,3002008: 309 buildings , average cost: $121,8002007: 388 buildings , average cost: $145,1002006: 516 buildings , average cost: $140,6002005: 549 buildings , average cost: $136,7002004: 493 buildings , average cost: $132,3002003: 432 buildings , average cost: $129,3002002: 315 buildings , average cost: $125,9002001: 285 buildings , average cost: $119,4002000: 238 buildings , average cost: $122,1001999: 259 buildings , average cost: $130,3001998: 184 buildings , average cost: $132,9001997: 183 buildings , average cost: $111,600Unemployment in December 2023:
Population change in the 1990s: +3,470 (+6.5%).
Most common industries in Bossier City, LA (%)
Both Males Females
Health care (11.7%)
Accommodation & food services (7.6%)
Educational services (7.4%)
Arts, entertainment, recreation (7.2%)
Public administration (6.3%)
Construction (5.9%)
Professional, scientific, technical services (4.1%)
Construction (11.0%)
Public administration (7.7%)
Arts, entertainment, recreation (6.4%)
Health care (5.8%)
Accommodation & food services (5.6%)
Professional, scientific, technical services (4.1%)
Administrative & support & waste management services (3.5%)
Health care (17.7%)
Educational services (11.7%)
Accommodation & food services (9.7%)
Arts, entertainment, recreation (8.0%)
Finance & insurance (5.8%)
Public administration (4.9%)
Social assistance (4.5%)
Most common occupations in Bossier City, LA (%)
Both Males Females
Other sales and related occupations, including supervisors (4.1%)
Building and grounds cleaning and maintenance occupations (3.5%)
Electrical equipment mechanics and other installation, maintenance, and repair workers, including supervisors (3.5%)
Other production occupations, including supervisors (3.4%)
Other management occupations, except farmers and farm managers (3.3%)
Cashiers (3.3%)
Preschool, kindergarten, elementary, and middle school teachers (3.2%)
Electrical equipment mechanics and other installation, maintenance, and repair workers, including supervisors (6.6%)
Driver/sales workers and truck drivers (5.4%)
Other production occupations, including supervisors (4.9%)
Other sales and related occupations, including supervisors (4.9%)
Other management occupations, except farmers and farm managers (4.6%)
Vehicle and mobile equipment mechanics, installers, and repairers (4.3%)
Building and grounds cleaning and maintenance occupations (4.0%)
Preschool, kindergarten, elementary, and middle school teachers (6.0%)
Cashiers (5.8%)
Secretaries and administrative assistants (5.8%)
Other office and administrative support workers, including supervisors (4.8%)
Registered nurses (4.2%)
Information and record clerks, except customer service representatives (3.9%)
Retail sales workers, except cashiers (3.8%)
Tornado activity:
Bossier City-area historical tornado activity is slightly above Louisiana state average. It is 124% greater than the overall U.S. average.
On 12/3/1978, a category F4 (max. wind speeds 207-260 mph) tornado 3.6 miles away from the Bossier City city center killed 2 people and injured 266 people and caused between $50,000,000 and $500,000,000 in damages.
On 4/3/1999, a category F4 tornado 8.1 miles away from the city center killed 7 people and injured 102 people and caused $8 million in damages.
Earthquake activity:
Bossier City-area historical earthquake activity is significantly above Louisiana state average. It is 350% greater than the overall U.S. average. On 5/17/2012 at 08:12:00, a magnitude 4.8 (4.8 MW, Depth: 3.1 mi, Class: Light, Intensity: IV - V) earthquake occurred 57.0 miles away from the city center On 11/6/2011 at 03:53:10, a magnitude 5.7 (5.7 MW, Depth: 3.2 mi, Class: Moderate, Intensity: VI - VII) earthquake occurred 272.9 miles away from Bossier City center On 9/3/2016 at 12:02:44, a magnitude 5.8 (5.8 MW, Depth: 3.5 mi) earthquake occurred 327.3 miles away from Bossier City center On 9/2/2013 at 23:51:15, a magnitude 4.3 (4.3 MW, Depth: 2.9 mi) earthquake occurred 60.2 miles away from the city center On 9/2/2013 at 21:52:38, a magnitude 4.2 (4.2 MW, Depth: 3.0 mi) earthquake occurred 62.0 miles away from Bossier City center On 1/25/2013 at 07:01:19, a magnitude 4.1 (4.1 MB, Depth: 3.1 mi) earthquake occurred 58.7 miles away from Bossier City center Magnitude types: body-wave magnitude (MB), moment magnitude (MW) Natural disasters: The number of natural disasters in Bossier Parish (19) is greater than the US average (15).Major Disasters (Presidential) Declared: 13Emergencies Declared: 4Storms: 8, Floods: 6, Hurricanes: 6, Tornadoes: 4, Winter Storms: 2, Drought: 1, Freeze: 1, Ice Storm: 1, Tropical Storm: 1, Other: 2 (Note: some incidents may be assigned to more than one category). Hospitals in Bossier City: ARLINGTON PLACE COMMUNITY HOME (2418 ARLINGTON PLACE) BOSSIER CITY SURGERY CENTER (2105 AIRELINE DRIVE) COMMUNITY HOSPICE OF BOSSIER MEDICAL C (2105 AIRLINE DRIVE) DOUGLAS DRIVE GROUP HOME (2600 DOUGLAS DRIVE) GREENBRIAR COMMUNITY HOME (111 GREENBRIAR) JERICHO HOME (2515 BROWNLEE ROAD) PECAN LANE COMMUNITY HOME (1212 PECAN LANE) RED RIVER BEHAVIORAL CENTER, LLC (2800 MELROSE AVENUE) TILMAN COMMUNITY HOME (2524 TILMAN STREET) WILLIS KNIGHTON BOSSIER HEALTH CENTER (Voluntary non-profit - Private, 2400 HOSPITAL DR) Amtrak station: BOSSIER CITY (3033 HILTON DR.) - Bus Station
.
Services: fully wheelchair accessible, enclosed waiting area, public restrooms, public payphones, full-service food facilities, free short-term parking, free long-term parking, call for taxi service.
Colleges/Universities in Bossier City: Bossier Parish Community College Full-time enrollment: 6,209; Location: 6220 East Texas; Public; Website: www.bpcc.edu)
University of Phoenix-Shreveport-Bossier Campus Full-time enrollment: 212; Location: 350 Plaza Loop Dr; Private, for-profit; Website: www.phoenix.edu; Offers Master's degree )
Virginia College-Shreveport Bossier City Full-time enrollment: 168; Location: 2950 East Texas Street; Private, for-profit; Website: www.vc.edu/campus/shreveport-louisiana-college.cfm)
Pat Goins Benton Road Beauty School Full-time enrollment: 60; Location: 1701 Old Minden Rd Ste 36; Private, for-profit; Website: www.patgoins.edu)
Other colleges/universities with over 2000 students near Bossier City:
Louisiana State University-Shreveport (about 7 miles; Shreveport, LA ; Full-time enrollment: 3,159)
Southern University at Shreveport (about 9 miles; Shreveport, LA ; FT enrollment: 2,277)
Grambling State University (about 57 miles; Grambling, LA ; FT enrollment: 4,885)
Southern Arkansas University Main Campus (about 60 miles; Magnolia, AR ; FT enrollment: 3,005)
LeTourneau University (about 61 miles; Longview, TX ; FT enrollment: 2,357)
Louisiana Tech University (about 61 miles; Ruston, LA ; FT enrollment: 5,874)
Northwestern State University of Louisiana (about 64 miles; Natchitoches, LA ; FT enrollment: 7,700)
Public high schools in Bossier City: AIRLINE HIGH SCHOOL Students: 1,570, Location: 2801 AIRLINE DRIVE, Grades: 8-12)PARKWAY HIGH SCHOOL Students: 1,110, Location: 2010 COLLEEN DRIVE, Grades: 8-12)BOSSIER HIGH SCHOOL Students: 648, Location: 777 BEARKAT DRIVE, Grades: 8-12)JOHNNY GRAY JONES YOUTH SHELTER & DETENTION CENTER Location: 4815 SHED ROAD, Grades: KG-12)
Biggest public elementary/middle schools in Bossier City: ELM GROVE MIDDLE SCHOOL Students: 875, Location: 4301 PANTHER DRIVE, Grades: 6-8)GREENACRES MIDDLE SCHOOL Students: 803, Location: 2220 AIRLINE DRIVE, Grades: 6-8)APOLLO ELEMENTARY SCHOOL Students: 777, Location: 2400 VIKING DRIVE, Grades: KG-5)LEGACY ELEMENTARY SCHOOL Students: 753, Location: 4830 SWAN LAKE ROAD, Grades: KG-5)STOCKWELL PLACE ELEMENTARY SCHOOL Students: 741, Location: 5801 SHED ROAD, Grades: KG-5)COPE MIDDLE SCHOOL Students: 692, Location: 4814 SHED ROAD, Grades: 6-8)PLANTATION PARK ELEMENTARY SCHOOL Students: 652, Location: 2410 PLANTATION DRIVE, Grades: PK-5)WALLER ELEMENTARY SCHOOL Students: 572, Location: 1130 PATRICIA DRIVE, Grades: PK-5)MEADOWVIEW ELEMENTARY SCHOOL Students: 546, Location: 4312 SHED ROAD, Grades: PK-5)W.T. LEWIS ELEMENTARY SCHOOL Students: 516, Location: 4701 MODICA LOTT ROAD, Grades: KG-5)Private elementary/middle school in Bossier City: PROVIDENCE CLASSICAL ACADEMY Students: 180, Location: 2810 E TEXAS ST, Grades: PK-8)
See full list of schools located in Bossier City Library in Bossier City: BOSSIER PARISH Operating income: $5,163,930; Location: 2206 BECKETT STREET; 205,981 books ; 2,652 e-books ; 10,321 audio materials ; 4,664 video materials ; 1 local licensed databases ; 60 state licensed databases ; 792 print serial subscriptions )
User-submitted facts and corrections:
Bossier City, LA is the birthplace of Sutton Lloyd, a college basketball player for the Northwestern St. Demons.
Notable locations in Bossier City: (A) , Ruben E White Industrial Park (B) , Magnolia Industrial Park (C) , Bossier City Fire Department Station 7 (D) , Bossier Parish Public Library (E) , Henry L Aulds Memorial Branch Library (F) , Bossier City Fire Department Station 9 (G) , Bossier City Fire Department Station 4 (H) , Bossier City Fire Department Station 5 (I) , Bossier City Fire Department Station 6 (J) , Bossier City Fire Department Station 2 (K) , Bossier City Fire Department Station 3 (L) , Bossier City Fire Department Station 8 (M) , Bossier City Fire Department Station 1 (N) . Display/hide their locations on the map
Shopping Centers: (1) , Heart of Bossier Shopping Center (2) , Bossier Towne Center Shopping Center (3) , Bossier Crossroads Shopping Center (4) . Display/hide their locations on the map
Churches in Bossier City include: (A) , Saint Judes Church (B) , Hope Assembly of God Church (C) , Good Hope Baptist Church (D) , New Hope Church (E) , Airline Baptist Church (F) , Airline Drive Church of Christ (G) , All Peoples Assembly of God Church (H) , Antioch Baptist Church (I) . Display/hide their locations on the map
Lake: (A) . Display/hide its location on the map
Parks in Bossier City include: (1) , Tuttle Park (2) , Swan Lake Park (3) , Shed Road Park (4) , Mike Woods Park (5) , Hooter Park (6) . Display/hide their locations on the map
Tourist attractions: (1) , Bossier-Shreveport Cigarette Vending Machne CO Inc (Amusement & Theme Parks; 801 Barksdale Boulevard) (2) , Kiddie Rides-Amusements (Amusement & Theme Parks; 801 Barksdale Boulevard) (3) , Party Central Family Fun Center (4401 Viking Drive) (4) . Display/hide their approximate locations on the map
Hotels: (1) , Microtel Inn & Suites (2713 Village Lane) (2) , Shoney's Inn (1836 Old Minden Road) (3) , Ramada Inn Bossier (750 Isle Of Capri Boulevard) (4) , Red River Inn (1600 East Texas Street) (5) , David Motel (2045 East Texas Street) (6) , Isle of Capri Casino and Hotel (711 Isle Of Capri Boulevard) (7) , Boomtown Casino & Hotel (300 Riverside Drive) (8) , Air-View Motel (5607 East Texas Street) (9) . Display/hide their approximate locations on the map
Court: (1) . Display/hide its approximate location on the map
Birthplace of: Jared Leto - (born 1971), actor, Alex Pourteau - Professional wrestler, B.J. Ryan - 2005 Major League Baseball player (Baltimore Orioles, born : Dec 28, 1975), Jesse Winchester - Singer, Kim Gandy - Feminist, Al Smith (umpire) - Baseball umpire, Greg Tyer - College basketball player (Northwestern St. Demons), Jeremy Johnston - College basketball player (Louisiana Tech Bulldogs), Kenyon Cotton - Football player, Scott Hayes - College football player (La Lafayette Ragin' Cajuns).
Bossier Parish has a predicted average indoor radon screening level less than 2 pCi/L (pico curies per liter) - Low Potential Drinking water stations with addresses in Bossier City and their reported violations in the past:
CITY OF BOSSIER CITY WATER SYSTEM (Population served: 59,611, Surface water):
Past monitoring violations:
Monitoring and Reporting (DBP) - Between JAN-2013 and MAR-2013, Contaminant: Chloramine. Follow-up actions: St Public Notif requested (MAR-21-2013), St Violation/Reminder Notice (MAR-21-2013), St Public Notif received (JUN-24-2013), St Compliance achieved (MAR-31-2014)
Address: 61 DAVIDSON DRIVE Population served: 147, Groundwater):
Past health violations:
MCL, Monthly (TCR) - In NOV-2006, Contaminant: Coliform. Follow-up actions: St Public Notif requested (NOV-29-2006), St Violation/Reminder Notice (NOV-29-2006), St Compliance achieved (DEC-11-2006), St Public Notif received (DEC-11-2006)
Past monitoring violations:
Monitoring and Reporting (DBP) - Between JAN-2014 and FEB-2014, Contaminant: Total Haloacetic Acids (HAA5). Follow-up actions: St Public Notif requested (APR-29-2014), St Violation/Reminder Notice (APR-29-2014), St Public Notif received (JUL-01-2014)
Monitoring and Reporting (DBP) - Between JAN-2014 and FEB-2014, Contaminant: TTHM. Follow-up actions: St Public Notif requested (APR-29-2014), St Violation/Reminder Notice (APR-29-2014), St Public Notif received (JUL-01-2014)
Monitoring and Reporting (DBP) - Between JAN-2013 and AUG-2013, Contaminant: Total Haloacetic Acids (HAA5). Follow-up actions: St Public Notif requested (DEC-02-2013), St Violation/Reminder Notice (DEC-02-2013), St Public Notif received (JUL-01-2014)
Monitoring and Reporting (DBP) - Between JAN-2013 and AUG-2013, Contaminant: TTHM. Follow-up actions: St Public Notif requested (DEC-02-2013), St Violation/Reminder Notice (DEC-02-2013), St Public Notif received (JUL-01-2014)
One routine major monitoring violation
Address: 2285 BENTON RD, SUITE G300 Population served: 75, Groundwater):
Past monitoring violations:
Monitoring and Reporting (DBP) - Between MAR-2014 and MAY-2014, Contaminant: Total Haloacetic Acids (HAA5). Follow-up actions: St Violation/Reminder Notice (AUG-15-2014), St Public Notif requested (AUG-15-2014)
Monitoring and Reporting (DBP) - Between MAR-2014 and MAY-2014, Contaminant: TTHM. Follow-up actions: St Violation/Reminder Notice (AUG-15-2014), St Public Notif requested (AUG-15-2014)
Monitoring and Reporting (DBP) - Between JAN-2013 and AUG-2013, Contaminant: Total Haloacetic Acids (HAA5). Follow-up actions: St Public Notif requested (DEC-18-2013), St Violation/Reminder Notice (DEC-18-2013), St Public Notif received (FEB-07-2014)
Monitoring and Reporting (DBP) - Between JAN-2013 and AUG-2013, Contaminant: TTHM. Follow-up actions: St Public Notif requested (DEC-18-2013), St Violation/Reminder Notice (DEC-18-2013), St Public Notif received (FEB-07-2014)
Average household size: This city:
2.5 peopleLouisiana:
2.5 people
Percentage of family households: This city:
65.8%Whole state:
67.1%
Percentage of households with unmarried partners: This city:
6.4%Whole state:
6.8%
Likely homosexual households (counted as self-reported same-sex unmarried-partner households)
Lesbian couples: 0.3% of all households Gay men: 0.2% of all households
People in group quarters in Bossier City in 2010:
671 people in nursing facilities/skilled-nursing facilities
587 people in military barracks and dormitories (nondisciplinary)
204 people in group homes intended for adults
60 people in local jails and other municipal confinement facilities
45 people in correctional facilities intended for juveniles
17 people in in-patient hospice facilities
16 people in group homes for juveniles (non-correctional)
12 people in residential treatment centers for adults
2 people in military disciplinary barracks and jails
People in group quarters in Bossier City in 2000:
718 people in military barracks, etc.
569 people in nursing homes
175 people in schools, hospitals, or wards for the intellectually disabled
73 people in military transient quarters for temporary residents
72 people in wards in general hospitals for patients who have no usual home elsewhere
35 people in homes for the mentally retarded
23 people in local jails and other confinement facilities (including police lockups)
8 people in unknown juvenile institutions
8 people in other group homes
6 people in homes for the physically handicapped
5 people in military disciplinary barracks
3 people in homes or halfway houses for drug/alcohol abuse
Arena or stadium:
CenturyTel Center. Capacity: 14,000.
Banks with most branches in Bossier City (2011 data):
JPMorgan Chase Bank, National Association: Old Minden Rd, Airline Bossier Branch, South Bossier Branch. Info updated 2011/11/10: Bank assets: $1,811,678.0 mil, Deposits: $1,190,738.0 mil, headquarters in Columbus, OH, positive income , International Specialization, 5577 total offices , Holding Company: Jpmorgan Chase & Co.
Regions Bank: North Bossier Branch, South Bossier Branch, Peirre Bossier Branch. Info updated 2011/02/24: Bank assets: $123,368.2 mil, Deposits: $98,301.3 mil, headquarters in Birmingham, AL, positive income , Commercial Lending Specialization, 1778 total offices , Holding Company: Regions Financial Corporation
Capital One, National Association: Benton Road Branch, Airline/She Branch, North Bossier City Branch. Info updated 2011/07/01: Bank assets: $133,477.8 mil, Deposits: $97,063.7 mil, headquarters in Mclean, VA, positive income , 984 total offices , Holding Company: Capital One Financial Corporation
Citizens National Bank, N.A.: Stockwell Road Branch, at 2711 East Texas Street, Benton Road Branch. Info updated 2011/12/05: Bank assets: $666.0 mil, Deposits: $589.2 mil, local headquarters , positive income , Commercial Lending Specialization, 15 total offices , Holding Company: Citizens National Bancshares Of Bossier, Inc.
Ouachita Independent Bank: Benton Rd. Branch at 4200 Benton Road, branch established on 2008/10/20; Garrett Drive Branch at 800 Garrett Drive, branch established on 2005/04/18. Info updated 2006/11/03: Bank assets: $567.7 mil, Deposits: $472.5 mil, headquarters in Monroe, LA, positive income , Commercial Lending Specialization, 12 total offices , Holding Company: Ouachita Bancshares Corp.
Red River Bank: East Texas Banking Center at 2931 East Texas Street, branch established on 2008/06/16; Airline Banking Center Branch at 3300 Airline Drive, branch established on 2008/10/14. Info updated 2006/11/03: Bank assets: $989.5 mil, Deposits: $872.1 mil, headquarters in Alexandria, LA, positive income , Commercial Lending Specialization, 16 total offices , Holding Company: Red River Bancshares, Inc.
Community Bank of Louisiana: Benton Road Office Branch at 4008 Benton Road, branch established on 2008/03/10; South Bossier Branch at Highway 71 And Jimmie Davis Highway, branch established on 2004/07/12. Info updated 2006/11/03: Bank assets: $374.7 mil, Deposits: $342.2 mil, headquarters in Mansfield, LA, positive income , 9 total offices , Holding Company: Mansfield Bancshares, Inc.
BancorpSouth Bank: Airline Drive Branch at 3003 Airline Drive, branch established on 2003/04/21. Info updated 2007/07/18: Bank assets: $12,990.3 mil, Deposits: $10,863.8 mil, headquarters in Tupelo, MS, positive income , Commercial Lending Specialization, 271 total offices , Holding Company: Bancorpsouth, Inc.
Home Federal Bank: Viking Drive Branch at 2555 Viking Drive, branch established on 2010/11/30. Info updated 2011/07/21: Bank assets: $252.7 mil, Deposits: $182.4 mil, headquarters in Shreveport, LA, positive income , Commercial Lending Specialization, 4 total offices
4 other banks with 4 local branches
For population 15 years and over in Bossier City:
Never married: 34.5%Now married: 42.5%Separated: 1.5%Widowed: 7.0%Divorced: 14.5% For population 25 years and over in Bossier City:
High school or higher: 88.6%Bachelor's degree or higher: 23.9%Graduate or professional degree: 8.1%Unemployed: 5.7%Mean travel time to work (commute): 18.3 minutes
Education Gini index (Inequality in education) Here:
10.3Louisiana average:
11.9
Religion statistics for Bossier City, LA (based on Bossier Parish data)
Religion Adherents Congregations Evangelical Protestant 49,177 99 Mainline Protestant 7,099 19 Black Protestant 6,884 32 Catholic 5,890 4 Other 1,405 3 None 46,524 -
Source: Clifford Grammich, Kirk Hadaway, Richard Houseal, Dale E.Jones, Alexei Krindatch, Richie Stanley and Richard H.Taylor. 2012. 2010 U.S.Religion Census: Religious Congregations & Membership Study. Association of Statisticians of American Religious Bodies. Jones, Dale E., et al. 2002. Congregations and Membership in the United States 2000. Nashville, TN: Glenmary Research Center. Graphs represent county-level data
Food Environment Statistics: Number of grocery stores : 15Bossier Parish :
1.38 / 10,000 pop.State :
2.56 / 10,000 pop.
Number of supercenters and club stores : 1Bossier Parish :
0.09 / 10,000 pop.Louisiana :
0.18 / 10,000 pop.
Number of convenience stores (no gas) : 6Bossier Parish :
0.55 / 10,000 pop.Louisiana :
1.29 / 10,000 pop.
Number of convenience stores (with gas) : 49Bossier Parish :
4.51 / 10,000 pop.State :
4.49 / 10,000 pop.
Number of full-service restaurants : 71This county :
6.53 / 10,000 pop.State :
5.92 / 10,000 pop.
Adult diabetes rate : Bossier Parish :
10.3%State :
10.9%
Adult obesity rate : This county :
27.1%Louisiana :
29.2%
Low-income preschool obesity rate : This county :
13.2%Louisiana :
13.7%
Health and Nutrition: Healthy diet rate : This city:
48.6%Louisiana:
49.4%
Average overall health of teeth and gums : This city:
45.5%Louisiana:
46.5%
Average BMI : Bossier City:
28.9State:
29.1
People feeling badly about themselves : This city:
20.4%State:
20.3%
People not drinking alcohol at all : This city:
11.2%Louisiana:
11.4%
Average hours sleeping at night : Bossier City:
6.8Louisiana:
6.8
Overweight people : Bossier City:
33.6%Louisiana:
34.5%
General health condition : Here:
55.5%Louisiana:
55.8%
Average condition of hearing : Bossier City:
79.8%State:
80.2%
More about Health and Nutrition of Bossier City, LA Residents
Local government employment and payroll (March 2022)
Function
Full-time employees
Monthly full-time payroll
Average yearly full-time wage
Part-time employees
Monthly part-time payroll
Firefighters
177 $945,943 $64,132 1 $850 Police Protection - Officers
143 $698,665 $58,629 0 $0 Financial Administration
46 $194,317 $50,691 0 $0 Police - Other
45 $198,216 $52,858 1 $1,982 Sewerage
32 $115,034 $43,138 0 $0 Other and Unallocable
30 $126,907 $50,763 0 $0 Parks and Recreation
29 $91,014 $37,661 8 $4,394 Other Government Administration
29 $120,623 $49,913 0 $0 Solid Waste Management
27 $68,528 $30,457 0 $0 Correction
26 $120,962 $55,829 1 $850 Fire - Other
24 $165,327 $82,664 0 $0 Water Supply
22 $81,180 $44,280 0 $0 Judicial and Legal
17 $83,729 $59,103 1 $383 Streets and Highways
16 $69,927 $52,445 0 $0 Health
7 $18,221 $31,236 2 $786 Housing and Community Development (Local)
3 $12,971 $51,884 0 $0
Totals for Government
673 $3,111,565 $55,481 14 $9,245
Bossier City government finances - Expenditure in 2021 (per resident):
Construction - Sewerage: $26,484,000 ($422.83)
Parks and Recreation: $18,809,000 ($300.30)Regular Highways: $17,372,000 ($277.35)Water Utilities: $7,451,000 ($118.96)General Public Buildings: $1,850,000 ($29.54)Local Fire Protection: $670,000 ($10.70)Housing and Community Development: $357,000 ($5.70)Health - Other: $269,000 ($4.29)Current Operations - Local Fire Protection: $22,788,000 ($363.82)
Police Protection: $20,106,000 ($321.00)Water Utilities: $7,081,000 ($113.05)Solid Waste Management: $5,927,000 ($94.63)Housing and Community Development: $5,693,000 ($90.89)Sewerage: $5,102,000 ($81.46)General - Other: $4,464,000 ($71.27)Regular Highways: $2,969,000 ($47.40)Parks and Recreation: $2,933,000 ($46.83)Judicial and Legal Services: $2,578,000 ($41.16)General Public Buildings: $2,050,000 ($32.73)Financial Administration: $2,014,000 ($32.15)Central Staff Services: $1,792,000 ($28.61)Protective Inspection and Regulation - Other: $821,000 ($13.11)Health - Other: $738,000 ($11.78)Gas Utilities: $529,000 ($8.45)General - Interest on Debt: $10,204,000 ($162.91)
Intergovernmental to Local - Other - Housing and Community Development: $68,000 ($1.09)
Other Capital Outlay - Local Fire Protection: $2,834,000 ($45.25)
Water Utilities: $2,769,000 ($44.21)Police Protection: $1,961,000 ($31.31)General - Other: $955,000 ($15.25)Sewerage: $899,000 ($14.35)Regular Highways: $353,000 ($5.64)Parks and Recreation: $223,000 ($3.56)Solid Waste Management: $209,000 ($3.34)General Public Building: $54,000 ($0.86)Financial Administration: $43,000 ($0.69)Protective Inspection and Regulation - Other: $36,000 ($0.57)Judicial and Legal Services: $26,000 ($0.42)Central Staff Services: $25,000 ($0.40)Health - Other: $12,000 ($0.19)Housing and Community Development: $2,000 ($0.03)Total Salaries and Wages: $37,947,000 ($605.84)
Water Utilities - Interest on Debt: $9,020,000 ($144.01)
Bossier City government finances - Revenue in 2021 (per resident):
Charges - Sewerage: $17,061,000 ($272.39)
Other: $7,953,000 ($126.97)Solid Waste Management: $6,391,000 ($102.04)Housing and Community Development: $2,668,000 ($42.60)Parks and Recreation: $35,000 ($0.56)Federal Intergovernmental - Other: $7,916,000 ($126.38)
Housing and Community Development: $3,732,000 ($59.58)Local Intergovernmental - General Local Government Support: $72,000 ($1.15)
Miscellaneous - Interest Earnings: $3,500,000 ($55.88)
General Revenue - Other: $3,475,000 ($55.48)Fines and Forfeits: $541,000 ($8.64)Rents: $400,000 ($6.39)Sale of Property: $296,000 ($4.73)Donations From Private Sources: $183,000 ($2.92)Revenue - Water Utilities: $14,460,000 ($230.86)
Gas Utilities: $411,000 ($6.56)State Intergovernmental - Other: $4,814,000 ($76.86)
General Local Government Support: $2,312,000 ($36.91)Tax - General Sales and Gross Receipts: $50,710,000 ($809.61)
Property: $14,043,000 ($224.20)Amusements Sales: $9,584,000 ($153.01)Occupation and Business License - Other: $4,867,000 ($77.70)Public Utilities Sales: $4,391,000 ($70.10)Other Selective Sales: $809,000 ($12.92)Insurance Premiums Sales: $265,000 ($4.23)Alcoholic Beverage License: $70,000 ($1.12)Pari - mutuels Sales: $17,000 ($0.27)
Bossier City government finances - Debt in 2021 (per resident):
Long Term Debt - Beginning Outstanding - Unspecified Public Purpose: $491,191,000 ($7842.12)
Outstanding Unspecified Public Purpose: $475,787,000 ($7596.18)Beginning Outstanding - Public Debt for Private Purpose: $246,203,000 ($3930.76)Outstanding Nonguaranteed - Industrial Revenue: $237,130,000 ($3785.90)Retired Unspecified Public Purpose: $20,979,000 ($334.94)Retired Nonguaranteed - Public Debt for Private Purpose: $9,073,000 ($144.86)Issue, Unspecified Public Purpose: $5,575,000 ($89.01)
Bossier City government finances - Cash and Securities in 2021 (per resident):
Bond Funds - Cash and Securities: $75,520,000 ($1205.72)
Other Funds - Cash and Securities: $153,461,000 ($2450.08)
Sinking Funds - Cash and Securities: $251,970,000 ($4022.83)
10.12% of this county's 2021 resident taxpayers lived in other counties in 2020 ($48,869 average adjusted gross income )
Here:
10.12%Louisiana average:
6.53%
0.28% of residents moved from foreign countries ($1,603 average AGI )Bossier Parish:
0.28%Louisiana average:
0.02%
Top counties from which taxpayers relocated into this county between 2020 and 2021:
10.10% of this county's 2020 resident taxpayers moved to other counties in 2021 ($53,901 average adjusted gross income )
Here:
10.10%Louisiana average:
7.33%
0.21% of residents moved to foreign countries ($1,285 average AGI )Bossier Parish:
0.21%Louisiana average:
0.02%
Top counties to which taxpayers relocated from this county between 2020 and 2021:
Businesses in Bossier City, LA
Name Count Name Count
AT&T 3 Lowe's 1 Academy Sports + Outdoors 1 Marriott 3 Advance Auto Parts 2 MasterBrand Cabinets 1 Albertsons 1 Maurices 1 American Eagle Outfitters 1 Mazda 1 Applebee's 1 McDonald's 5 Arby's 1 Men's Wearhouse 1 Ashley Furniture 1 Microtel 1 Audi 1 Motel 6 1 AutoZone 1 Motherhood Maternity 1 Baskin-Robbins 1 Nike 7 Bath & Body Works 2 Nissan 1 Bed Bath & Beyond 1 Office Depot 1 Blockbuster 1 Old Navy 1 Buffalo Wild Wings 1 Olive Garden 1 Burger King 4 Outback 1 CVS 2 Outback Steakhouse 1 Casual Male XL 1 Papa John's Pizza 1 Catherines 1 Payless 2 Chevrolet 1 Penske 1 Chick-Fil-A 2 PetSmart 1 Chuck E. Cheese's 1 Pizza Hut 3 Church's Chicken 1 Plato's Closet 1 Circle K 8 Popeyes 2 Cold Stone Creamery 1 Quality 1 Comfort Inn 1 Quiznos 2 Crossland Economy Studios 1 RadioShack 2 Dairy Queen 1 Ramada 1 Domino's Pizza 2 Red Lobster 1 DressBarn 1 Rodeway Inn 1 Dressbarn 1 Ruby Tuesday 1 Econo Lodge 1 Rue21 1 FedEx 10 Ryan's Grill 1 Finish Line 1 SONIC Drive-In 5 Firestone Complete Auto Care 1 Sears 2 Foot Locker 1 Shoe Carnival 1 Ford 1 Spencer Gifts 1 GNC 1 Sprint Nextel 1 GameStop 2 Starbucks 3 Gap 1 Subaru 1 Goodwill 1 Subway 9 Gymboree 1 Super 8 1 H&R Block 4 T-Mobile 3 Hilton 1 Taco Bell 5 Home Depot 1 Target 1 Hot Topic 1 The Room Place 1 IHOP 2 Toyota 1 JCPenney 1 Toys"R"Us 2 Jones New York 3 U-Haul 6 Journeys 1 UPS 11 Juicy Couture 1 Vans 2 Justice 3 Verizon Wireless 1 KFC 1 Victoria's Secret 1 Kmart 1 Volkswagen 1 Kroger 2 Waffle House 3 La Quinta 1 Walgreens 2 Lane Bryant 2 Walmart 1 Lane Furniture 3 Wendy's 4 Little Caesars Pizza 1
Strongest AM radio stations in Bossier City:
KEEL (710 AM; 50 kW; SHREVEPORT, LA; Owner: CITICASTERS LICENSES, L.P.)
KWKH (1130 AM; 50 kW; SHREVEPORT, LA; Owner: CITICASTERS LICENSES, L.P.)
KOKA (980 AM; 5 kW; SHREVEPORT, LA; Owner: ACCESS.1 COMMUNICATIONS - SHREVEPORT, LLC)
KSYB (1300 AM; 5 kW; SHREVEPORT, LA; Owner: AMISTAD COMMUNICATIONS, INC.)
KBCL (1070 AM; daytime; 0 kW; BOSSIER CITY, LA; Owner: BARNABAS CENTER MINISTRIES)
KRMD (1340 AM; 1 kW; SHREVEPORT, LA; Owner: CUMULUS LICENSING CORP.)
KIOU (1480 AM; 1 kW; SHREVEPORT, LA; Owner: METROPOLITAN RADIO GROUPS, INC.)
KPYN (900 AM; 10 kW; ATLANTA, TX; Owner: FAMILY WORSHIP CENTER CHURCH, INC.)
KNCB (1320 AM; 5 kW; VIVIAN, LA; Owner: NORTH CADDO BROADCASTING CO.)
KGHT (880 AM; 50 kW; SHERIDAN, AR; Owner: METROPOLITAN RADIO GROUP, INC.)
KTRH (740 AM; 50 kW; HOUSTON, TX; Owner: AMFM TEXAS LICENSES LIMITED PARTNERSHIP)
KAAY (1090 AM; 50 kW; LITTLE ROCK, AR; Owner: CITADEL BROADCASTING COMPANY)
KFXR (1190 AM; 50 kW; DALLAS, TX; Owner: CLEAR CHANNEL BROADCASTING LICENSES, INC.)
Strongest FM radio stations in Bossier City:
KMJJ-FM (99.7 FM; SHREVEPORT, LA; Owner: CUMULUS LICENSING CORP.)
KBED (102.9 FM; SHREVEPORT, LA; Owner: CUMULUS LICENSING CORP.)
KSCL (91.3 FM; SHREVEPORT, LA; Owner: CENTENARY COLLEGE OF LOUISIANA)
KRMD-FM (101.1 FM; SHREVEPORT, LA; Owner: CUMULUS LICENSING CORP.)
KVKI-FM (96.5 FM; SHREVEPORT, LA; Owner: CITICASTERS LICENSES, L.P.)
KBTT (103.7 FM; HAUGHTON, LA; Owner: ACCESS.1 COMMUNICATIONS - SHREVEPORT, LLC)
KRUF (94.5 FM; SHREVEPORT, LA; Owner: CITICASTERS LICENSES, L.P.)
KLKL (95.7 FM; MINDEN, LA; Owner: ACCESS.1 COMMUNICATIONS - SHREVEPORT, LLC)
KXKS-FM (93.7 FM; SHREVEPORT, LA; Owner: CITICASTERS LICENSES, L.P.)
KDAQ (89.9 FM; SHREVEPORT, LA; Owner: BD. SUP. LA ST. UNIV. & AGRIC. MECH.)
KVMA-FM (107.9 FM; MAGNOLIA, AR; Owner: COLUMBIA BROADCASTING CO., INC.)
KSYR (92.1 FM; BENTON, LA; Owner: ACCESS.1 COMMUNICATIONS - SHREVEPORT, LLC)
KDKS-FM (102.1 FM; BLANCHARD, LA; Owner: ACCESS.1 COMMUNICATIONS - SHREVEPORT, LLC)
KTAL-FM (98.1 FM; TEXARKANA, TX; Owner: ACCESS.1 COMMUNICATIONS - SHREVEPORT, LLC)
KTUX (98.9 FM; CARTHAGE, TX; Owner: CITICASTERS LICENSES, L.P.)
KYLA (106.7 FM; HOMER, LA; Owner: NWLA BROADCASTING, L.L.C)
K214BE (90.7 FM; SHREVEPORT, ETC., LA; Owner: EDUCATIONAL RADIO FOUND. OF EAST TX.)
TV broadcast stations around Bossier City:
K67FD (Channel 67; SHREVEPORT, LA; Owner: VENTANA TELEVISION, INC.)
KBXS-CA (Channel 50; SHREVEPORT, LA; Owner: THE BOX WORLDWIDE LLC)
KTBS-TV (Channel 3; SHREVEPORT, LA; Owner: KTBS, INC.)
KADO-LP (Channel 15; SHREVEPORT, LA; Owner: WORD OF LIFE MINISTRIES, INC.)
K42FE (Channel 42; SHREVEPORT, LA; Owner: THREE ANGELS BROADCASTING NETWORK)
KMSS-TV (Channel 33; SHREVEPORT, LA; Owner: COMCORP OF TEXAS LICENSE CORP.)
KSLA-TV (Channel 12; SHREVEPORT, LA; Owner: KSLA, LLC)
KSHV (Channel 45; SHREVEPORT, LA; Owner: WHITE KNIGHT BROADCASTING OF SHREVEPORT LIC. CORP.)
KLTS-TV (Channel 24; SHREVEPORT, LA; Owner: LOUISIANA EDUCATIONAL TELEVISION AUTHORITY)
K59GO (Channel 59; SHREVEPORT, LA; Owner: TRINITY BROADCASTING NETWORK, INC.)
KTAL-TV (Channel 6; TEXARKANA, TX; Owner: NEXSTAR BROADCASTING OF LOUISIANA, LLC)
KPXJ (Channel 21; MINDEN, LA; Owner: PAXSON COMMUNICATIONS LICENSE COMPANY, LLC)
National Bridge Inventory (NBI) Statistics 166 Number of bridges2,923ft / 891m Total length $50,667,000 Total costs2,836,776 Total average daily traffic283,703 Total average daily truck traffic
New bridges - historical statistics
1 1920-1929 2 1930-1939 1 1940-1949 4 1950-1959 31 1960-1969 27 1970-1979 8 1980-1989 11 1990-1999 17 2000-2009 11 2010-2019 2 2020-2022
See full National Bridge Inventory statistics for Bossier City, LA
Home Mortgage Disclosure Act Aggregated Statistics For Year 2009(Based on 6 full and 6 partial tracts) A) FHA, FSA/RHS & VA B) Conventional C) Refinancings D) Home Improvement Loans E) Loans on Dwellings For 5+ Families F) Non-occupant Loans on G) Loans On Manufactured Number Average Value Number Average Value Number Average Value Number Average Value Number Average Value Number Average Value Number Average Value
LOANS ORIGINATED 377 $152,821 161 $164,911 620 $140,498 25 $41,266 0 $0 99 $72,492 7 $44,114 APPLICATIONS APPROVED, NOT ACCEPTED 8 $151,389 3 $151,243 74 $136,897 4 $45,828 1 $745,000 5 $77,446 1 $37,970 APPLICATIONS DENIED 47 $133,444 28 $97,261 246 $121,489 40 $24,935 0 $0 20 $78,387 6 $60,612 APPLICATIONS WITHDRAWN 37 $133,113 10 $189,351 164 $137,111 5 $74,484 0 $0 10 $86,406 1 $54,000 FILES CLOSED FOR INCOMPLETENESS 4 $79,708 2 $152,425 40 $122,432 3 $47,740 0 $0 2 $28,000 1 $103,290
Aggregated Statistics For Year 2008(Based on 6 full and 6 partial tracts) A) FHA, FSA/RHS & VA B) Conventional C) Refinancings D) Home Improvement Loans E) Loans on Dwellings For 5+ Families F) Non-occupant Loans on G) Loans On Manufactured Number Average Value Number Average Value Number Average Value Number Average Value Number Average Value Number Average Value Number Average Value
LOANS ORIGINATED 271 $140,038 269 $148,062 407 $114,661 58 $35,854 1 $227,000 124 $88,886 11 $39,968 APPLICATIONS APPROVED, NOT ACCEPTED 12 $124,018 24 $165,962 86 $130,696 10 $56,888 0 $0 11 $85,712 5 $60,908 APPLICATIONS DENIED 46 $129,593 61 $110,929 351 $113,723 96 $42,023 0 $0 31 $81,018 22 $29,926 APPLICATIONS WITHDRAWN 40 $122,966 30 $160,273 161 $129,567 5 $84,252 1 $500,000 12 $83,252 0 $0 FILES CLOSED FOR INCOMPLETENESS 3 $99,000 6 $97,755 25 $129,914 2 $54,270 0 $0 3 $81,747 0 $0
Aggregated Statistics For Year 2007(Based on 6 full and 6 partial tracts) A) FHA, FSA/RHS & VA B) Conventional C) Refinancings D) Home Improvement Loans E) Loans on Dwellings For 5+ Families F) Non-occupant Loans on G) Loans On Manufactured Number Average Value Number Average Value Number Average Value Number Average Value Number Average Value Number Average Value Number Average Value
LOANS ORIGINATED 186 $136,855 582 $125,425 510 $107,506 116 $39,683 3 $2,886,123 169 $68,806 18 $31,775 APPLICATIONS APPROVED, NOT ACCEPTED 10 $148,489 77 $121,950 134 $110,174 24 $36,990 0 $0 28 $81,373 14 $50,688 APPLICATIONS DENIED 26 $120,507 118 $96,054 408 $101,064 150 $37,860 1 $6,563,000 42 $79,574 31 $34,784 APPLICATIONS WITHDRAWN 15 $134,989 53 $124,485 161 $117,813 20 $75,156 0 $0 15 $62,739 3 $62,463 FILES CLOSED FOR INCOMPLETENESS 1 $112,810 19 $131,024 40 $113,341 1 $28,000 0 $0 5 $84,768 0 $0
Aggregated Statistics For Year 2006(Based on 6 full and 6 partial tracts) A) FHA, FSA/RHS & VA B) Conventional C) Refinancings D) Home Improvement Loans F) Non-occupant Loans on G) Loans On Manufactured Number Average Value Number Average Value Number Average Value Number Average Value Number Average Value Number Average Value
LOANS ORIGINATED 150 $133,051 847 $100,675 510 $90,374 82 $34,136 221 $66,170 18 $37,844 APPLICATIONS APPROVED, NOT ACCEPTED 7 $111,597 90 $95,521 115 $94,653 27 $32,022 23 $49,788 15 $29,319 APPLICATIONS DENIED 32 $104,930 184 $86,872 379 $93,579 117 $42,787 54 $60,533 36 $52,540 APPLICATIONS WITHDRAWN 17 $149,547 104 $96,586 189 $102,131 24 $91,773 18 $72,401 0 $0 FILES CLOSED FOR INCOMPLETENESS 4 $107,078 25 $100,075 78 $105,529 2 $57,500 3 $68,683 0 $0
Aggregated Statistics For Year 2005(Based on 6 full and 6 partial tracts) A) FHA, FSA/RHS & VA B) Conventional C) Refinancings D) Home Improvement Loans E) Loans on Dwellings For 5+ Families F) Non-occupant Loans on G) Loans On Manufactured Number Average Value Number Average Value Number Average Value Number Average Value Number Average Value Number Average Value Number Average Value
LOANS ORIGINATED 203 $120,956 737 $102,552 542 $90,081 84 $35,487 3 $1,277,667 184 $63,234 11 $29,728 APPLICATIONS APPROVED, NOT ACCEPTED 14 $129,254 120 $82,476 136 $79,923 18 $32,263 0 $0 27 $54,479 18 $37,208 APPLICATIONS DENIED 24 $94,963 188 $90,386 490 $85,329 131 $37,427 0 $0 51 $57,847 44 $50,549 APPLICATIONS WITHDRAWN 17 $133,233 109 $102,774 291 $103,070 35 $107,381 0 $0 31 $69,929 2 $59,805 FILES CLOSED FOR INCOMPLETENESS 4 $142,840 21 $86,110 88 $98,904 5 $32,776 0 $0 6 $78,802 1 $69,400
Aggregated Statistics For Year 2004(Based on 6 full and 6 partial tracts) A) FHA, FSA/RHS & VA B) Conventional C) Refinancings D) Home Improvement Loans E) Loans on Dwellings For 5+ Families F) Non-occupant Loans on G) Loans On Manufactured Number Average Value Number Average Value Number Average Value Number Average Value Number Average Value Number Average Value Number Average Value
LOANS ORIGINATED 219 $109,224 580 $96,514 569 $89,008 71 $43,733 3 $2,096,247 175 $57,744 16 $34,594 APPLICATIONS APPROVED, NOT ACCEPTED 13 $98,337 94 $84,517 144 $76,303 17 $17,706 0 $0 19 $62,719 7 $30,539 APPLICATIONS DENIED 39 $93,841 126 $74,792 518 $75,617 114 $29,742 0 $0 49 $49,255 45 $44,701 APPLICATIONS WITHDRAWN 16 $115,705 55 $120,965 351 $88,670 14 $41,256 0 $0 17 $71,416 2 $42,380 FILES CLOSED FOR INCOMPLETENESS 1 $122,170 15 $121,371 35 $85,446 6 $56,492 0 $0 5 $53,872 0 $0
Aggregated Statistics For Year 2003(Based on 6 full and 6 partial tracts) A) FHA, FSA/RHS & VA B) Conventional C) Refinancings D) Home Improvement Loans E) Loans on Dwellings For 5+ Families F) Non-occupant Loans on Number Average Value Number Average Value Number Average Value Number Average Value Number Average Value Number Average Value
LOANS ORIGINATED 285 $94,672 495 $94,544 1,010 $93,195 74 $21,124 2 $3,774,700 190 $54,053 APPLICATIONS APPROVED, NOT ACCEPTED 12 $75,130 71 $74,244 179 $76,344 14 $24,446 0 $0 16 $44,524 APPLICATIONS DENIED 31 $74,829 109 $58,221 550 $70,094 56 $18,523 0 $0 48 $56,370 APPLICATIONS WITHDRAWN 22 $95,547 48 $93,274 302 $84,103 2 $84,635 0 $0 17 $62,932 FILES CLOSED FOR INCOMPLETENESS 0 $0 13 $105,523 44 $87,009 2 $28,910 0 $0 3 $81,020
Aggregated Statistics For Year 2002(Based on 5 full and 5 partial tracts) A) FHA, FSA/RHS & VA B) Conventional C) Refinancings D) Home Improvement Loans E) Loans on Dwellings For 5+ Families F) Non-occupant Loans on Number Average Value Number Average Value Number Average Value Number Average Value Number Average Value Number Average Value
LOANS ORIGINATED 250 $89,633 320 $89,533 634 $83,660 51 $18,775 2 $3,046,270 115 $49,020 APPLICATIONS APPROVED, NOT ACCEPTED 16 $89,134 52 $73,891 133 $70,361 10 $25,803 0 $0 14 $38,564 APPLICATIONS DENIED 30 $73,133 107 $61,056 265 $67,560 54 $12,775 0 $0 21 $48,345 APPLICATIONS WITHDRAWN 21 $75,375 32 $84,366 164 $78,392 5 $23,082 0 $0 6 $52,948 FILES CLOSED FOR INCOMPLETENESS 3 $49,077 16 $74,599 92 $77,265 1 $15,000 0 $0 4 $86,598
Aggregated Statistics For Year 2001(Based on 5 full and 5 partial tracts) A) FHA, FSA/RHS & VA B) Conventional C) Refinancings D) Home Improvement Loans E) Loans on Dwellings For 5+ Families F) Non-occupant Loans on Number Average Value Number Average Value Number Average Value Number Average Value Number Average Value Number Average Value
LOANS ORIGINATED 300 $80,916 253 $94,442 476 $79,249 66 $16,257 3 $1,080,667 75 $49,736 APPLICATIONS APPROVED, NOT ACCEPTED 7 $71,893 44 $63,379 82 $67,359 17 $13,989 0 $0 10 $35,108 APPLICATIONS DENIED 19 $61,031 128 $49,617 366 $57,108 93 $11,212 0 $0 24 $43,855 APPLICATIONS WITHDRAWN 10 $71,161 36 $84,162 233 $60,044 11 $31,085 0 $0 12 $49,972 FILES CLOSED FOR INCOMPLETENESS 2 $45,495 8 $126,082 45 $81,212 0 $0 0 $0 5 $52,238
Aggregated Statistics For Year 2000(Based on 5 full and 5 partial tracts) A) FHA, FSA/RHS & VA B) Conventional C) Refinancings D) Home Improvement Loans E) Loans on Dwellings For 5+ Families F) Non-occupant Loans on Number Average Value Number Average Value Number Average Value Number Average Value Number Average Value Number Average Value
LOANS ORIGINATED 249 $73,246 249 $89,417 199 $58,499 83 $10,847 2 $378,500 38 $46,373 APPLICATIONS APPROVED, NOT ACCEPTED 21 $58,517 64 $57,842 68 $49,441 29 $10,423 0 $0 9 $33,993 APPLICATIONS DENIED 34 $47,202 231 $41,815 297 $44,994 91 $11,319 0 $0 34 $39,984 APPLICATIONS WITHDRAWN 12 $53,251 33 $90,761 205 $48,464 4 $29,370 0 $0 3 $48,783 FILES CLOSED FOR INCOMPLETENESS 6 $50,778 10 $65,299 35 $56,730 1 $8,000 0 $0 3 $38,810
Aggregated Statistics For Year 1999(Based on 7 full and 6 partial tracts) A) FHA, FSA/RHS & VA B) Conventional C) Refinancings D) Home Improvement Loans F) Non-occupant Loans on Number Average Value Number Average Value Number Average Value Number Average Value Number Average Value
LOANS ORIGINATED 349 $75,007 332 $91,311 388 $61,771 133 $10,861 53 $41,561 APPLICATIONS APPROVED, NOT ACCEPTED 7 $87,911 100 $58,211 99 $46,954 37 $12,011 11 $52,439 APPLICATIONS DENIED 26 $74,152 243 $46,906 280 $50,814 118 $9,639 31 $33,947 APPLICATIONS WITHDRAWN 26 $70,412 50 $82,132 201 $53,737 11 $14,935 7 $40,089 FILES CLOSED FOR INCOMPLETENESS 5 $71,102 17 $109,182 63 $52,370 1 $20,000 6 $37,757
Detailed mortgage data for all 12 tracts in Bossier City, LA
Private Mortgage Insurance Companies Aggregated Statistics For Year 2009(Based on 6 full and 3 partial tracts) A) Conventional B) Refinancings C) Non-occupant Loans on Number Average Value Number Average Value Number Average Value
LOANS ORIGINATED 38 $228,345 34 $183,496 0 $0 APPLICATIONS APPROVED, NOT ACCEPTED 9 $209,193 11 $132,011 3 $72,180 APPLICATIONS DENIED 5 $189,800 3 $224,620 0 $0 APPLICATIONS WITHDRAWN 5 $243,824 2 $269,485 0 $0 FILES CLOSED FOR INCOMPLETENESS 1 $276,000 1 $312,870 0 $0
Aggregated Statistics For Year 2008(Based on 6 full and 5 partial tracts) A) Conventional B) Refinancings C) Non-occupant Loans on Number Average Value Number Average Value Number Average Value
LOANS ORIGINATED 128 $141,398 46 $134,025 22 $75,139 APPLICATIONS APPROVED, NOT ACCEPTED 40 $118,252 19 $128,026 7 $66,139 APPLICATIONS DENIED 7 $110,490 2 $43,190 2 $65,395 APPLICATIONS WITHDRAWN 3 $113,547 2 $133,775 0 $0 FILES CLOSED FOR INCOMPLETENESS 5 $106,142 2 $85,045 3 $88,743
Aggregated Statistics For Year 2007(Based on 6 full and 6 partial tracts) A) Conventional B) Refinancings C) Non-occupant Loans on Number Average Value Number Average Value Number Average Value
LOANS ORIGINATED 308 $132,002 57 $147,653 37 $68,703 APPLICATIONS APPROVED, NOT ACCEPTED 49 $140,503 14 $148,282 6 $49,515 APPLICATIONS DENIED 3 $88,373 0 $0 0 $0 APPLICATIONS WITHDRAWN 12 $136,372 1 $201,620 2 $61,495 FILES CLOSED FOR INCOMPLETENESS 2 $67,000 0 $0 1 $40,000
Aggregated Statistics For Year 2006(Based on 6 full and 5 partial tracts) A) Conventional B) Refinancings C) Non-occupant Loans on Number Average Value Number Average Value Number Average Value
LOANS ORIGINATED 292 $113,314 46 $111,899 41 $66,711 APPLICATIONS APPROVED, NOT ACCEPTED 47 $125,181 17 $110,538 7 $43,577 APPLICATIONS DENIED 2 $93,000 1 $100,450 2 $63,460 APPLICATIONS WITHDRAWN 9 $144,200 3 $108,027 1 $62,000 FILES CLOSED FOR INCOMPLETENESS 1 $60,000 2 $118,000 0 $0
Aggregated Statistics For Year 2005(Based on 6 full and 5 partial tracts) A) Conventional B) Refinancings C) Non-occupant Loans on Number Average Value Number Average Value Number Average Value
LOANS ORIGINATED 285 $111,799 52 $125,368 52 $66,543 APPLICATIONS APPROVED, NOT ACCEPTED 35 $99,897 13 $109,653 4 $67,298 APPLICATIONS DENIED 5 $81,968 2 $252,000 5 $112,488 APPLICATIONS WITHDRAWN 12 $115,144 2 $127,260 5 $86,962 FILES CLOSED FOR INCOMPLETENESS 1 $235,390 2 $71,090 0 $0
Aggregated Statistics For Year 2004(Based on 6 full and 5 partial tracts) A) Conventional B) Refinancings C) Non-occupant Loans on D) Loans On Manufactured Number Average Value Number Average Value Number Average Value Number Average Value
LOANS ORIGINATED 258 $105,924 63 $107,407 51 $55,921 1 $82,000 APPLICATIONS APPROVED, NOT ACCEPTED 27 $92,771 23 $141,302 3 $44,333 1 $67,000 APPLICATIONS DENIED 2 $115,635 0 $0 0 $0 0 $0 APPLICATIONS WITHDRAWN 9 $93,183 10 $103,334 5 $93,518 1 $82,000 FILES CLOSED FOR INCOMPLETENESS 3 $117,063 1 $188,380 1 $66,000 0 $0
Aggregated Statistics For Year 2003(Based on 6 full and 5 partial tracts) A) Conventional B) Refinancings C) Non-occupant Loans on Number Average Value Number Average Value Number Average Value
LOANS ORIGINATED 236 $97,957 139 $111,918 54 $54,374 APPLICATIONS APPROVED, NOT ACCEPTED 26 $97,704 32 $113,944 5 $59,396 APPLICATIONS DENIED 5 $96,546 0 $0 1 $105,410 APPLICATIONS WITHDRAWN 7 $87,979 15 $111,203 3 $70,927 FILES CLOSED FOR INCOMPLETENESS 1 $119,550 0 $0 0 $0
Aggregated Statistics For Year 2002(Based on 5 full and 4 partial tracts) A) Conventional B) Refinancings C) Non-occupant Loans on Number Average Value Number Average Value Number Average Value
LOANS ORIGINATED 133 $96,302 87 $101,900 39 $61,872 APPLICATIONS APPROVED, NOT ACCEPTED 11 $94,449 18 $115,617 6 $97,337 APPLICATIONS DENIED 4 $65,892 0 $0 0 $0 APPLICATIONS WITHDRAWN 7 $72,054 3 $101,980 2 $89,835 FILES CLOSED FOR INCOMPLETENESS 0 $0 0 $0 0 $0
Aggregated Statistics For Year 2001(Based on 5 full and 4 partial tracts) A) Conventional B) Refinancings C) Non-occupant Loans on Number Average Value Number Average Value Number Average Value
LOANS ORIGINATED 120 $98,618 52 $107,913 24 $41,008 APPLICATIONS APPROVED, NOT ACCEPTED 4 $70,700 16 $105,866 2 $50,920 APPLICATIONS DENIED 3 $88,367 2 $70,870 1 $30,970 APPLICATIONS WITHDRAWN 4 $156,810 3 $135,467 0 $0 FILES CLOSED FOR INCOMPLETENESS 1 $83,000 1 $313,960 0 $0
Aggregated Statistics For Year 2000(Based on 5 full and 4 partial tracts) A) Conventional B) Refinancings C) Non-occupant Loans on Number Average Value Number Average Value Number Average Value
LOANS ORIGINATED 83 $107,315 13 $89,046 9 $44,068 APPLICATIONS APPROVED, NOT ACCEPTED 10 $111,788 5 $82,762 2 $33,000 APPLICATIONS DENIED 2 $59,365 1 $160,810 0 $0 APPLICATIONS WITHDRAWN 2 $190,400 0 $0 0 $0 FILES CLOSED FOR INCOMPLETENESS 0 $0 0 $0 0 $0
Aggregated Statistics For Year 1999(Based on 5 full and 5 partial tracts) A) Conventional B) Refinancings C) Non-occupant Loans on Number Average Value Number Average Value Number Average Value
LOANS ORIGINATED 119 $104,627 35 $77,467 14 $49,152 APPLICATIONS APPROVED, NOT ACCEPTED 9 $140,153 4 $135,380 0 $0 APPLICATIONS DENIED 5 $55,444 1 $82,540 0 $0 APPLICATIONS WITHDRAWN 6 $122,807 1 $140,800 0 $0 FILES CLOSED FOR INCOMPLETENESS 3 $187,023 0 $0 0 $0
Fire-safe hotels and motels in Bossier City, Louisiana:
La Quinta Inn #568, 309 Preston Blvd, Bossier City, Louisiana 71111 Phone: (318) 747-4400, Fax: (318) 747-1516
Econo Lodge Inn & Suites, 4300 Industrial Dr, Bossier City, Louisiana 71112 Phone: (318) 746-5050, Fax: (318) 742-6154
Americas Best Value Inn, 1836 Old Minden Rd, Bossier City, Louisiana 71111 Phone: (318) 747-7700, Fax: (318) 742-2779
The Hampton Inn, 1005 Gould Dr, Bossier City, Louisiana 71111 Phone: (318) 752-1112, Fax: (318) 752-1405
Crossland Economy Studios - Shreveport - Bossier City, 3070 E Texas St, Bossier City, Louisiana 71111 Phone: (318) 747-5800, Fax: (318) 747-5805
Ramada Inn, 750 Isle Of Capri Blvd, Bossier City, Louisiana 71111 Phone: (318) 746-8410, Fax: (318) 746-8410
Comfort Inn Bossier, 1111 Delhi, Bossier City, Louisiana 71111 Phone: (318) 221-2400, Fax: (318) 221-2909
Best Western Airline Motor Inn, 1984 Airline Dr, Bossier City, Louisiana 71172 Phone: (318) 742-6000, Fax: (318) 742-4615
17 other hotels and motels
All 25 fire-safe hotels and motels in Bossier City, Louisiana
Most common first names in Bossier City, LA among deceased individuals Name Count Lived (average)
Mary 263 76.8 years James 255 70.5 years William 219 71.6 years John 208 73.1 years Robert 163 69.5 years Charles 124 68.0 years Willie 106 75.8 years Dorothy 82 73.8 years Thomas 80 70.2 years George 79 74.2 years
Most common last names in Bossier City, LA among deceased individuals Last name Count Lived (average)
Smith 155 75.7 years Johnson 113 73.9 years Williams 109 72.6 years Davis 70 74.6 years Jones 64 75.6 years Thomas 59 72.9 years Brown 56 77.3 years Moore 51 73.1 years Walker 49 76.5 years Taylor 43 71.7 years
Bossier City compared to Louisiana state average:
Unemployed percentage significantly below state average. Hispanic race population percentage above state average. Median age below state average. Length of stay since moving in significantly above state average. Bossier City on our top lists :
#1 on the list of "Top 101 cities with largest percentage of females in occupations: health technologists and technicians (population 50,000+)"
#9 on the list of "Top 101 cities with largest percentage of females in industries: mining, quarrying, and oil and gas extraction (population 50,000+)"
#16 on the list of "Top 101 cities with the largest city-data.com crime index decrease from 2002 to 2012 (population 50,000+)"
#19 on the list of "Top 101 cities with the most recent year of entry for the foreign-born population (2,000+ people)+"
#22 on the list of "Top 101 cities with largest percentage of males in industries: utilities (population 50,000+)"
#26 on the list of "Top 101 cities with largest percentage of males in occupations: installation, maintenance, and repair occupations (population 50,000+)"
#27 on the list of "Top 101 cities with the largest percentage of people in military disciplinary barracks (population 1,000+)"
#27 on the list of "Top 101 cities with largest percentage of females in industries: health care and social assistance (population 50,000+)"
#31 on the list of "Top 101 cities with largest percentage of males in industries: health care and social assistance (population 50,000+)"
#31 on the list of "Top 100 cities with strongest arts, entertainment, recreation, accommodation and food services industries (pop. 50,000+)"
#47 on the list of "Top 101 cities with most building permits per 10,000 residents (population 50,000+)"
#51 on the list of "Top 101 cities with the largest percentage of people in military transient quarters for temporary residents (population 1,000+)"
#56 on the list of "Top 101 cities with largest percentage of females in industries: arts, entertainment, and recreation (population 50,000+)"
#58 on the list of "Top 101 cities with largest percentage of females in industries: agriculture, forestry, fishing and hunting (population 50,000+)"
#58 on the list of "Top 101 cities with largest percentage of males in industries: mining, quarrying, and oil and gas extraction (population 50,000+)"
#59 on the list of "Top 101 cities with largest percentage of males in occupations: life, physical, and social science occupations (population 50,000+)"
#62 on the list of "Top 100 cities with shortest commuting times (pop. 50,000+)"
#63 on the list of "Top 101 cities with largest percentage of males in occupations: construction and extraction occupations (population 50,000+)"
#68 on the list of "Top 101 cities with largest percentage of males in occupations: community and social service occupations (population 50,000+)"
#69 on the list of "Top 101 cities with largest percentage of females in occupations: business and financial operations occupations (population 50,000+)"
#10 (71110) on the list of "Top 101 zip codes with the smallest percentage of taxpayers reporting profit/loss from business in 2012 (pop 1,000+)"
#13 (71110) on the list of "Top 101 zip codes with the largest percentage of returns reporting salary or wage in 2012 (pop 1,000+)"
#20 (71110) on the list of "Top 101 zip codes with the smallest percentage of taxpayers using paid preparers for 2012 taxes (pop 1,000+)"
#43 (71111) on the list of "Top 101 zip codes with the most casinos in 2005"
#68 (71110) on the list of "Top 101 zip codes with the lowest 2012 average reported profit/loss from business (pop 1,000+)"
#38 on the list of "Top 101 counties with the highest percentage of residents relocating from foreign countries between 2010 and 2011"
#48 on the list of "Top 101 counties with the highest percentage of residents relocating to other counties in 2011 (pop. 50,000+)"
#68 on the list of "Top 101 counties with the highest percentage of residents relocating to foreign countries in 2011"
#79 on the list of "Top 101 counties with the highest percentage of residents relocating from other counties between 2010 and 2011"
#100 on the list of "Top 101 counties with the largest number of people moving in compared to moving out (pop. 50,000+)"
Top Patent Applicants
Scott Quigley (22)
Mark Jeffrey Lowe (11)
Patrick C. Whitchurch (8)
Grant Nuckolls (7)
Scott D. Quigley (5)
Travis Mcelveen (5)
Michael Andrew Theodos (4)
Henry Preston Hutson (4)
Michael A. Theodos (3)
Travis Almer (3)
Total of 99 patent applications in 2008-2024.
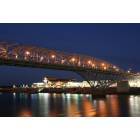

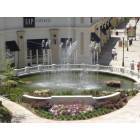
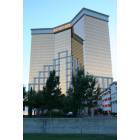

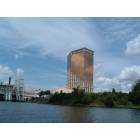
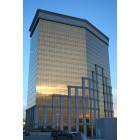
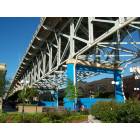
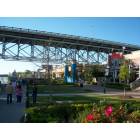
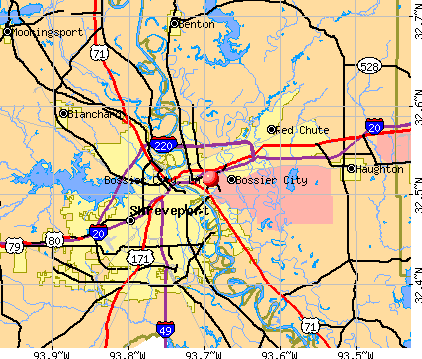


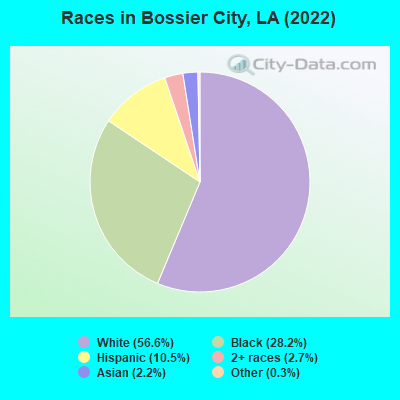
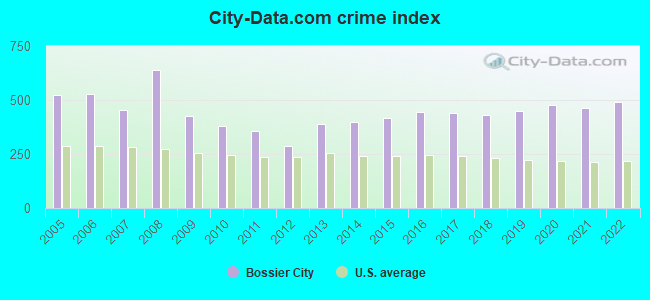
 Recent articles from our blog. Our writers, many of them Ph.D. graduates or candidates, create easy-to-read articles on a wide variety of topics.

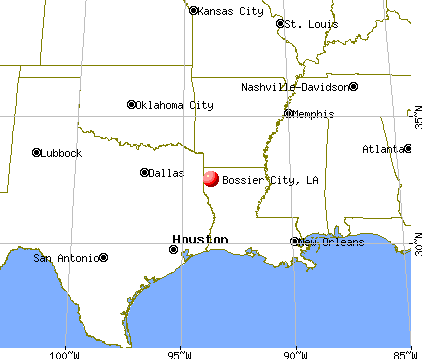
 (5.8 miles
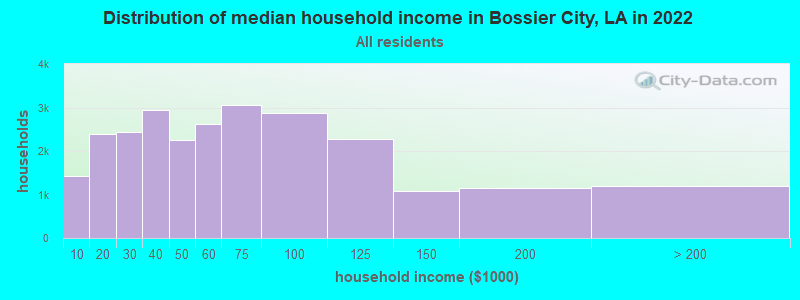

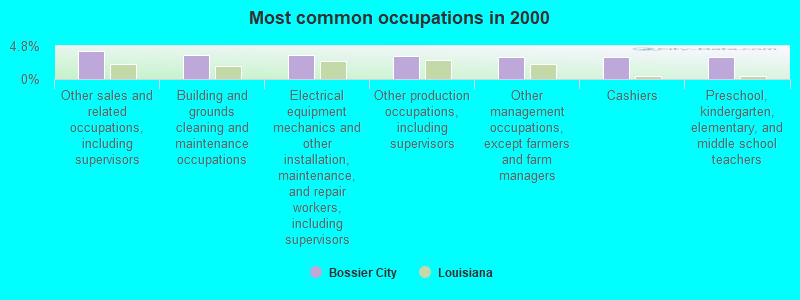
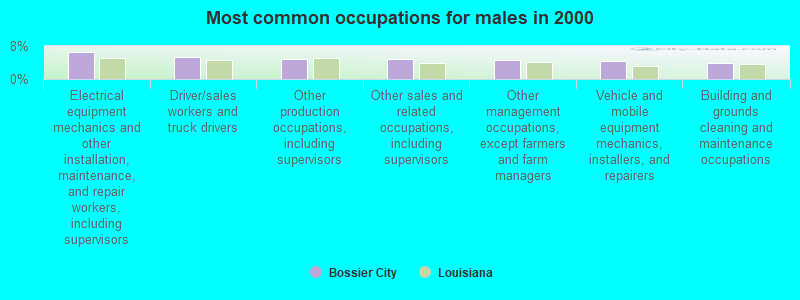
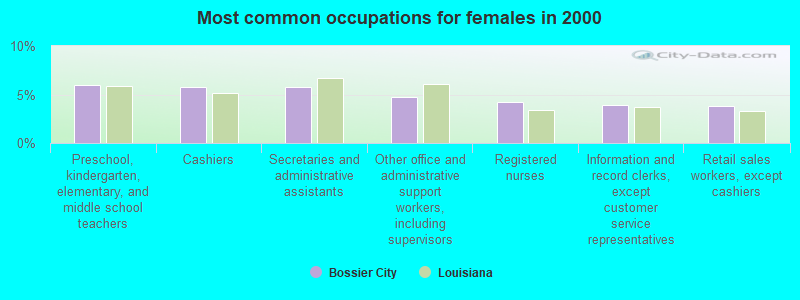


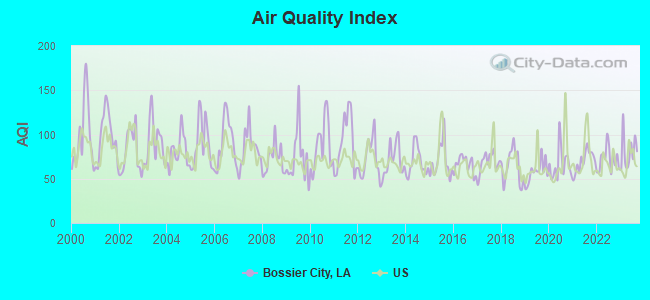
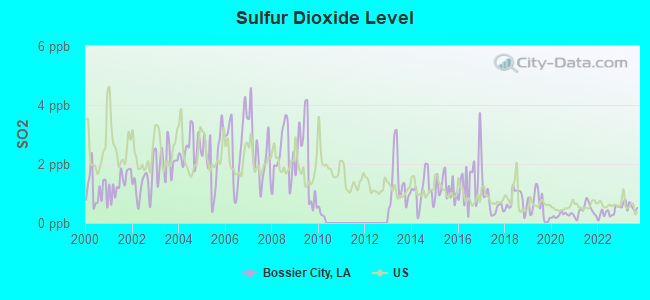
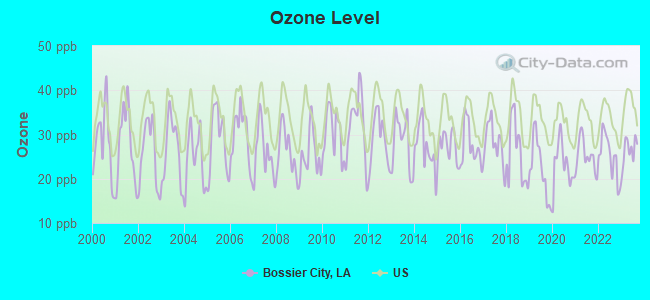
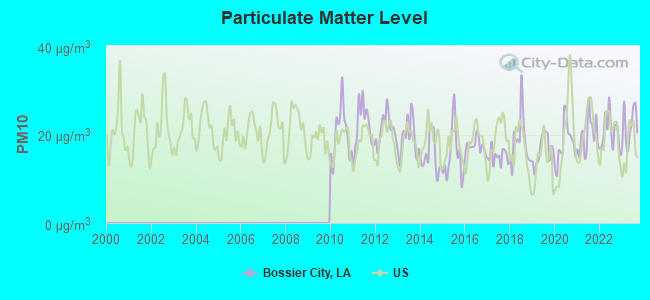
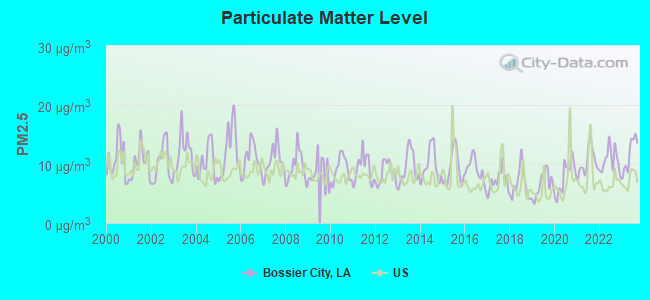

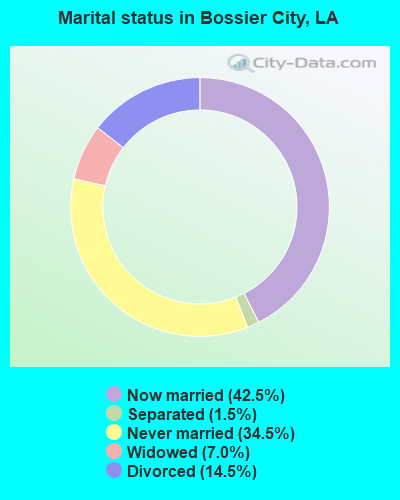
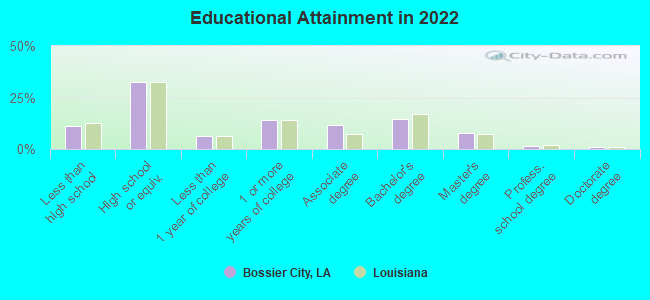
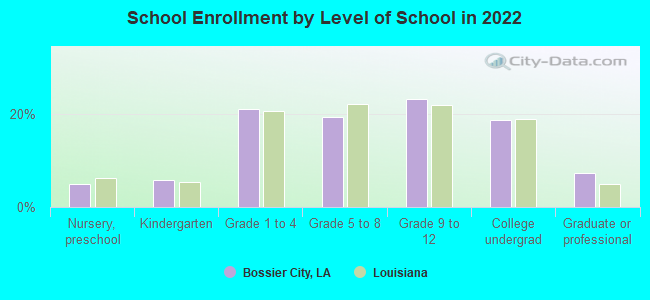


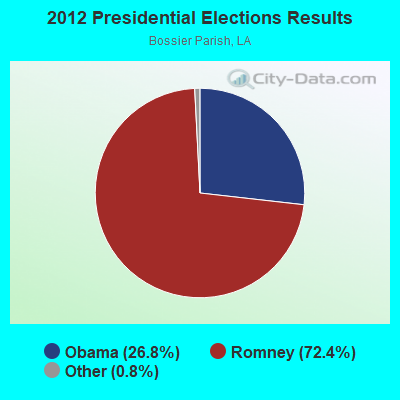
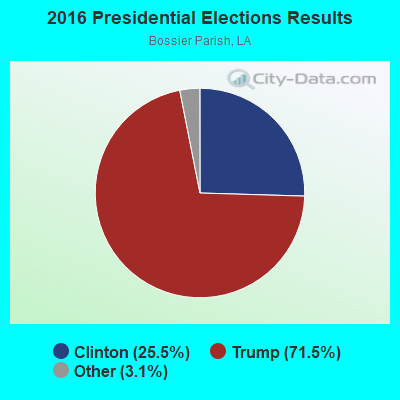

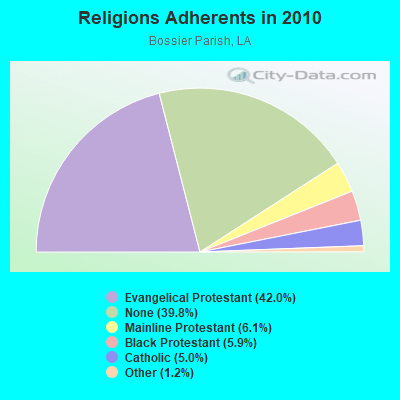
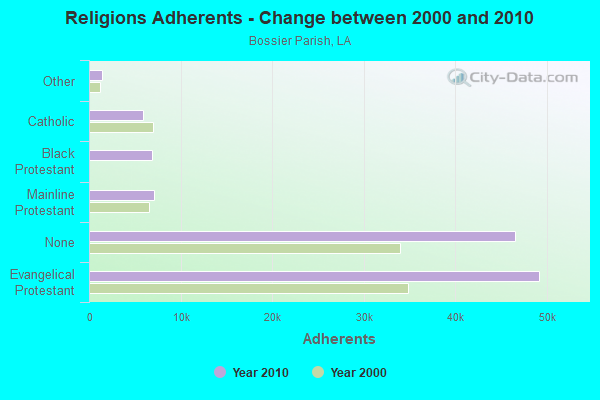
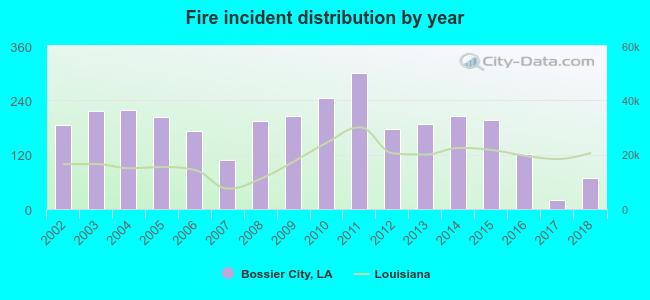 According to the data from the years 2002 - 2018 the average number of fire incidents per year is 178. The highest number of fires - 301 took place in 2011, and the least - 19 in 2017. The data has a dropping trend.
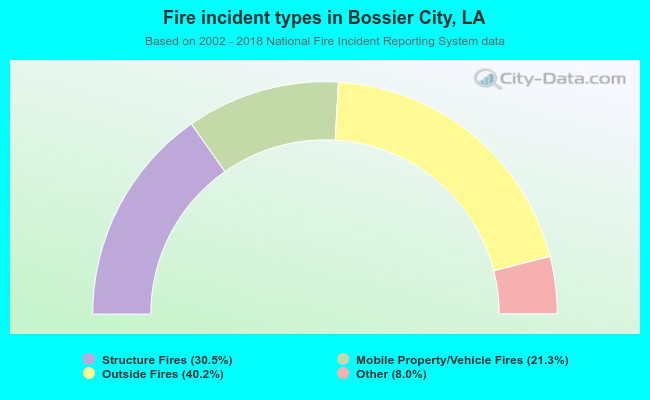 When looking into fire subcategories, the most incidents belonged to: Outside Fires (40.2%), and Structure Fires (30.5%).