Bellingham, Massachusetts

Bellingham: Morning autumn colors along the Charles River on High St.
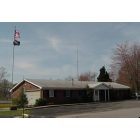
Bellingham
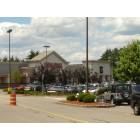
Bellingham: Charles River Center
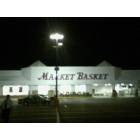
Bellingham: Bellingham Market Basket Grocery Store
- add
your
Submit your own pictures of this place and show them to the world
- OSM Map
- General Map
- Google Map
- MSN Map
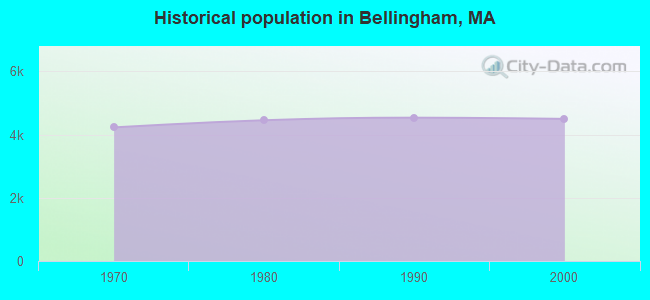
Population change since 2000: +7.9%
| Males: 2,182 | |
| Females: 2,672 |
| Median resident age: | 46.7 years |
| Massachusetts median age: | 40.3 years |
Zip codes: 02019.
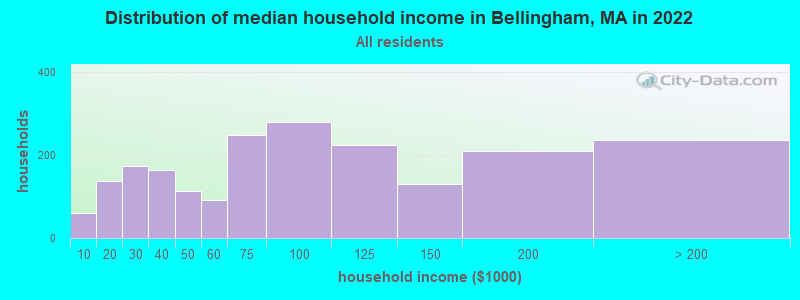
| Bellingham: | $73,770 |
| MA: | $94,488 |
Estimated per capita income in 2022: $46,240 (it was $24,633 in 2000)
Bellingham CDP income, earnings, and wages data
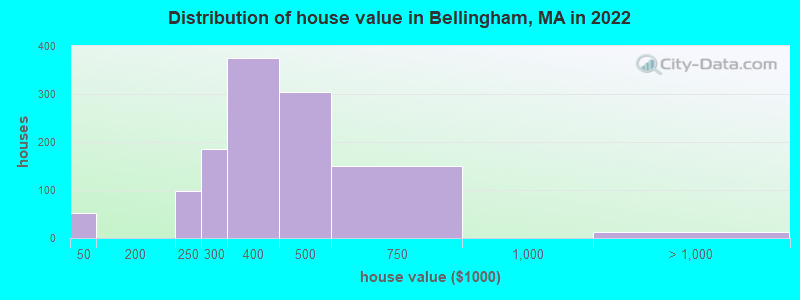
Estimated median house or condo value in 2022: $391,387 (it was $157,200 in 2000)
| Bellingham: | $391,387 |
| MA: | $534,700 |
Mean prices in 2022: all housing units: $811,449; detached houses: $851,375; townhouses or other attached units: $650,242; in 2-unit structures: $825,093; in 3-to-4-unit structures: $853,292; in 5-or-more-unit structures: $584,259; mobile homes: $91,001
Median gross rent in 2022: $1,877.
(3.1% for White Non-Hispanic residents, 19.0% for Black residents)
Detailed information about poverty and poor residents in Bellingham, MA

Compare current foreclosures near Bellingham, MA:
| Photo | Address | Area | Beds / Baths | Price | Details |
|---|---|---|---|---|---|

|
#1
S Main St
Bellingham, MA 02019
|
2,105 sq. feet
|
2 baths 3 beds |
show details | |

|
#2
Penny Ln
Bellingham, MA 02019
|
1,994 sq. feet
|
3 baths 4 beds |
show details | |

|
#3
Lakeshore Dr
Bellingham, MA 02019
|
1,110 sq. feet
|
2 baths 3 beds |
show details | |

|
#4
Suffolk St
Bellingham, MA 02019
|
1,355 sq. feet
|
2 baths 3 beds |
show details | |

|
#5
Caroline Dr
Bellingham, MA 02019
|
1,552 sq. feet
|
1 baths 3 beds |
show details | |

|
#6
Essex St
Bellingham, MA 02019
|
1,036 sq. feet
|
1 baths 2 beds |
show details | |

|
#7
Susan Ln
Bellingham, MA 02019
|
1,627 sq. feet
|
2 baths 3 beds |
show details | |

|
#8
Mechanic St
Bellingham, MA 02019
|
2,060 sq. feet
|
1 baths 4 beds |
show details | |

|
#9
Center St
Bellingham, MA 02019
|
1,642 sq. feet
|
1 baths 3 beds |
show details | |

|
#10
Lakeshore Dr
Bellingham, MA 02019
|
2,044 sq. feet
|
2 baths 3 beds |
show details |
| Photo | Address | Area | Beds / Baths | Price | Details |
|---|---|---|---|---|---|

|
#11
Rockland Cir
Bellingham, MA 02019
|
2,273 sq. feet
|
2 baths 4 beds |
show details | |

|
#12
Squire Ln
Bellingham, MA 02019
|
1,438 sq. feet
|
1 baths 3 beds |
show details | |

|
#13
Dorothy Ave
Bellingham, MA 02019
|
1,231 sq. feet
|
1 baths 2 beds |
show details | |

|
#14
Silver Ave
Bellingham, MA 02019
|
1,582 sq. feet
|
2 baths 3 beds |
show details | |

|
#15
Caroline Dr
Bellingham, MA 02019
|
1,216 sq. feet
|
1 baths 3 beds |
show details | |

|
#16
Jeannine Rd
Bellingham, MA 02019
|
2,680 sq. feet
|
2 baths 3 beds |
show details | |

|
#17
S Main St
Bellingham, MA 02019
|
1,482 sq. feet
|
2 baths 4 beds |
show details | |

|
#18
Ruthellen Rd
Bellingham, MA 02019
|
1,716 sq. feet
|
1 baths 2 beds |
show details | |

|
#19
Summer St
Bellingham, MA 02019
|
- sq. feet
|
- baths - beds |
show details | |

|
#20
Welker Way
Bellingham, MA 02019
|
- sq. feet
|
- baths - beds |
show details |
| Photo | Address | Area | Beds / Baths | Price | Details |
|---|---|---|---|---|---|

|
#21
Brisson St
Bellingham, MA 02019
|
- sq. feet
|
- baths - beds |
show details | |

|
#22
Jefferson Pl
Bellingham, MA 02019
|
- sq. feet
|
- baths - beds |
show details | |

|
#23
Cook Rd
Cumberland, RI 02864
|
2,050 sq. feet
|
2 baths 4 beds |
$724,900
|
show details |

|
#24
Loomis St
North Attleboro, MA 02760
|
2,294 sq. feet
|
2 baths 4 beds |
$700,000
|
show details |

|
#25
Stillman St
Framingham, MA 01702
|
1,122 sq. feet
|
1 baths 2 beds |
$290,000
|
show details |

|
#26
Cherry St
Framingham, MA 01701
|
1,380 sq. feet
|
1 baths 4 beds |
show details | |

|
#27
Cedar St
Foxboro, MA 02035
|
972 sq. feet
|
2 baths 2 beds |
show details | |

|
#28
Vaillencourt Dr
Framingham, MA 01701
|
2,318 sq. feet
|
4 baths 4 beds |
show details | |

|
#29
Maple St
Norfolk, MA 02056
|
1,746 sq. feet
|
2 baths 3 beds |
show details | |

|
#30
Hannah Dr
Whitinsville, MA 01588
|
2,563 sq. feet
|
3 baths 4 beds |
show details |
| Photo | Address | Area | Beds / Baths | Price | Details |
|---|---|---|---|---|---|

|
#31
1/2 Putnam Hill Road
Sutton, MA 01590
|
1,415 sq. feet
|
1 baths 3 beds |
show details | |

|
#32
Pitts St
Natick, MA 01760
|
2,576 sq. feet
|
4 baths 4 beds |
show details | |

|
#33
Rome Blvd
Attleboro, MA 02703
|
1,791 sq. feet
|
3 baths 4 beds |
show details | |

|
#34
Johnson St
Ashland, MA 01721
|
1,356 sq. feet
|
2 baths 3 beds |
show details | |

|
#35
Elm Ct
Millbury, MA 01527
|
1,064 sq. feet
|
2 baths 3 beds |
show details | |

|
#36
Pine St
Franklin, MA 02038
|
2,002 sq. feet
|
3 baths 5 beds |
show details | |

|
#37
Union St
Foxboro, MA 02035
|
1,278 sq. feet
|
2 baths 3 beds |
show details | |

|
#38
Wedgewood Dr
Hopkinton, MA 01748
|
4,903 sq. feet
|
5 baths 4 beds |
show details | |

|
#39
Oak Hill Dr
Walpole, MA 02081
|
1,641 sq. feet
|
2 baths 3 beds |
show details | |

|
#40
Briarwood Rd
Franklin, MA 02038
|
1,664 sq. feet
|
2 baths 2 beds |
show details |
| Photo | Address | Area | Beds / Baths | Price | Details |
|---|---|---|---|---|---|

|
#41
Juniper Rd Unit A10
North Attleboro, MA 02760
|
693 sq. feet
|
1 baths 1 beds |
show details | |

|
#42
Juniper Rd # C9
North Attleboro, MA 02760
|
697 sq. feet
|
1 baths 1 beds |
show details | |

|
#43
Western Ave
Natick, MA 01760
|
1,508 sq. feet
|
2 baths 3 beds |
show details | |

|
#44
Valley Green Court
Providence, RI 02904
|
1,440 sq. feet
|
3 baths 2 beds |
show details | |

|
#45
Cedar St
Westborough, MA 01581
|
1,342 sq. feet
|
1 baths 3 beds |
show details | |

|
#46
Pleasant St
Upton, MA 01568
|
816 sq. feet
|
2 baths 2 beds |
show details | |

|
#47
Church St
Whitinsville, MA 01588
|
1,872 sq. feet
|
3 baths 3 beds |
show details | |

|
#48
Surro Dr
Framingham, MA 01701
|
2,912 sq. feet
|
4 baths 4 beds |
show details | |

|
#49
Scott Rd
Cumberland, RI 02864
|
- sq. feet
|
2 baths 1 beds |
show details | |

|
Check over 1 million property listings on Foreclosure.com!
|
browse all offers | |||


- 3,97585.4%White alone
- 2274.9%Hispanic
- 1964.2%Two or more races
- 861.8%Black alone
- 651.4%Asian alone
- 340.7%Other race alone
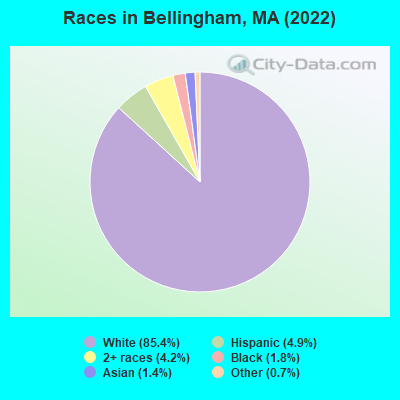
Races in Bellingham detailed stats: ancestries, foreign born residents, place of birth
According to our research of Massachusetts and other state lists, there were 9 registered sex offenders living in Bellingham, Massachusetts as of June 10, 2024.
The ratio of all residents to sex offenders in Bellingham is 602 to 1.
Type |
2009 |
2010 |
2011 |
2012 |
2013 |
2014 |
2015 |
2016 |
2017 |
2018 |
2019 |
2020 |
2021 |
2022 |
|---|---|---|---|---|---|---|---|---|---|---|---|---|---|---|
| Murders (per 100,000) | 0 (0.0) | 0 (0.0) | 0 (0.0) | 0 (0.0) | 0 (0.0) | 0 (0.0) | 0 (0.0) | 0 (0.0) | 0 (0.0) | 0 (0.0) | 0 (0.0) | 0 (0.0) | 1 (5.7) | 0 (0.0) |
| Rapes (per 100,000) | 4 (24.6) | 1 (6.1) | 2 (12.2) | 1 (6.0) | 3 (18.1) | 1 (6.0) | 5 (29.6) | 6 (35.5) | 4 (23.4) | 4 (23.3) | 3 (17.5) | 3 (17.3) | 2 (11.3) | 10 (58.9) |
| Robberies (per 100,000) | 5 (30.8) | 4 (24.5) | 5 (30.4) | 4 (24.1) | 8 (48.1) | 8 (47.6) | 10 (59.2) | 2 (11.8) | 3 (17.5) | 2 (11.6) | 2 (11.7) | 6 (34.6) | 1 (5.7) | 2 (11.8) |
| Assaults (per 100,000) | 20 (123.2) | 16 (98.0) | 22 (133.9) | 23 (138.6) | 24 (144.4) | 21 (125.0) | 18 (106.6) | 26 (153.6) | 21 (122.7) | 13 (75.7) | 20 (116.7) | 27 (155.8) | 28 (158.8) | 17 (100.2) |
| Burglaries (per 100,000) | 34 (209.4) | 43 (263.3) | 38 (231.3) | 46 (277.2) | 55 (330.9) | 50 (297.6) | 34 (201.4) | 26 (153.6) | 17 (99.3) | 17 (98.9) | 16 (93.3) | 15 (86.6) | 8 (45.4) | 15 (88.4) |
| Thefts (per 100,000) | 176 (1,084) | 226 (1,384) | 288 (1,753) | 280 (1,687) | 225 (1,354) | 207 (1,232) | 265 (1,570) | 278 (1,643) | 237 (1,384) | 186 (1,082) | 171 (997.5) | 179 (1,033) | 153 (867.6) | 145 (854.7) |
| Auto thefts (per 100,000) | 15 (92.4) | 10 (61.2) | 15 (91.3) | 21 (126.6) | 11 (66.2) | 15 (89.3) | 9 (53.3) | 17 (100.5) | 8 (46.7) | 8 (46.6) | 8 (46.7) | 8 (46.2) | 7 (39.7) | 5 (29.5) |
| Arson (per 100,000) | 2 (12.3) | 2 (12.2) | 0 (0.0) | 2 (12.1) | 3 (18.1) | 3 (17.9) | 2 (11.8) | 1 (5.9) | 0 (0.0) | 1 (5.8) | 2 (11.7) | 1 (5.8) | 1 (5.7) | 0 (0.0) |
| City-Data.com crime index | 119.0 | 110.5 | 139.2 | 136.8 | 140.4 | 121.3 | 144.0 | 147.1 | 114.5 | 91.2 | 91.0 | 106.5 | 94.9 | 113.5 |
The City-Data.com crime index weighs serious crimes and violent crimes more heavily. Higher means more crime, U.S. average is 246.1. It adjusts for the number of visitors and daily workers commuting into cities.

Crime rate in Bellingham detailed stats: murders, rapes, robberies, assaults, burglaries, thefts, arson
Full-time law enforcement employees in 2021, including police officers: 39 (30 officers - 27 male; 3 female).
| Officers per 1,000 residents here: | 1.70 |
| Massachusetts average: | 2.53 |
 Recent articles from our blog. Our writers, many of them Ph.D. graduates or candidates, create easy-to-read articles on a wide variety of topics.

 | Crisis on MA roads (369 replies) |
| Thoughts on Bellingham ... (30 replies) |
| Houses in Bellingham/Hopedale (12 replies) |
| 2021 Real Estate Observations (1729 replies) |
| household income map of Boston area (75 replies) |
| Bellingham area and schools versus North Attleboro? (20 replies) |
Latest news from Bellingham, MA collected exclusively by city-data.com from local newspapers, TV, and radio stations
Ancestries: Irish (20.0%), American (13.6%), Italian (10.0%), French (8.0%), French Canadian (7.0%), English (6.1%).
Current Local Time: EST time zone
Incorporated in 1719
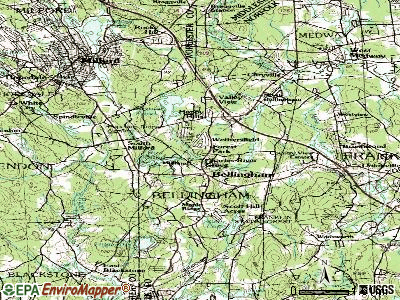
Elevation: 293 feet
Land area: 5.28 square miles.
Population density: 919 people per square mile (low).
318 residents are foreign born (2.1% Latin America, 1.7% Asia, 1.4% Europe, 1.4% North America).
| This place: | 6.8% |
| Massachusetts: | 17.6% |
Median real estate property taxes paid for housing units with mortgages in 2022: $4,263 (1.0%)
Median real estate property taxes paid for housing units with no mortgage in 2022: $4,301 (1.2%)
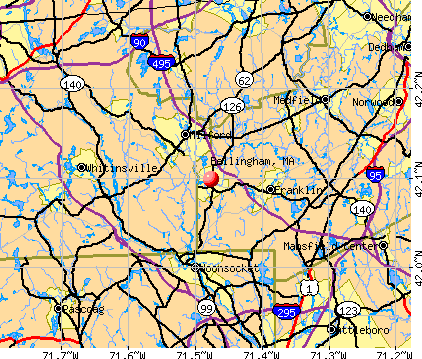
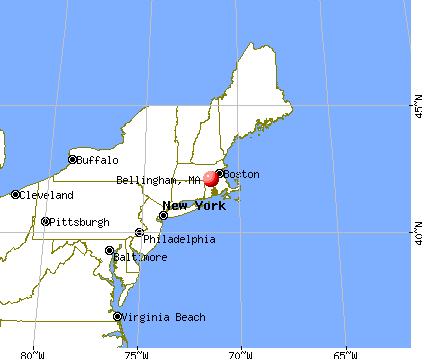
Nearest city with pop. 50,000+: Framingham, MA  (14.2 miles , pop. 66,910).
Nearest city with pop. 200,000+: Boston, MA (25.2 miles , pop. 589,141).
Nearest city with pop. 1,000,000+: Bronx, NY (151.4 miles , pop. 1,332,650).
Nearest cities:
), ), )Latitude: 42.10 N, Longitude: 71.48 W
Daytime population change due to commuting: +1,314 (+28.2%)
Workers who live and work in this place: 399 (17.8%)
Area codes: 508, 774

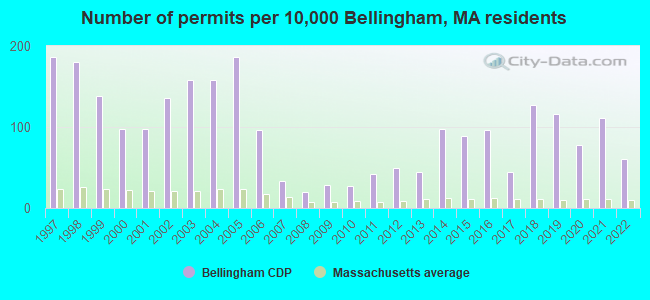
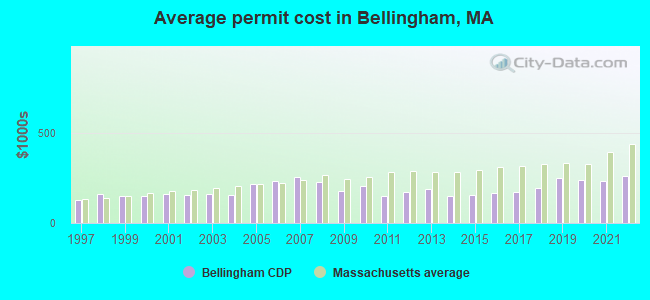
Single-family new house construction building permits:
- 2022: 27 buildings, average cost: $260,800
- 2021: 50 buildings, average cost: $229,600
- 2020: 35 buildings, average cost: $238,600
- 2019: 52 buildings, average cost: $250,800
- 2018: 57 buildings, average cost: $191,100
- 2017: 20 buildings, average cost: $170,800
- 2016: 43 buildings, average cost: $167,400
- 2015: 40 buildings, average cost: $153,400
- 2014: 44 buildings, average cost: $150,100
- 2013: 20 buildings, average cost: $188,600
- 2012: 22 buildings, average cost: $172,500
- 2011: 19 buildings, average cost: $149,100
- 2010: 12 buildings, average cost: $205,100
- 2009: 13 buildings, average cost: $178,200
- 2008: 9 buildings, average cost: $228,900
- 2007: 15 buildings, average cost: $255,900
- 2006: 43 buildings, average cost: $230,800
- 2005: 84 buildings, average cost: $215,200
- 2004: 71 buildings, average cost: $152,500
- 2003: 71 buildings, average cost: $159,700
- 2002: 61 buildings, average cost: $153,000
- 2001: 44 buildings, average cost: $159,800
- 2000: 44 buildings, average cost: $148,900
- 1999: 62 buildings, average cost: $149,600
- 1998: 81 buildings, average cost: $158,800
- 1997: 84 buildings, average cost: $125,500
| Here: | 3.1% |
| Massachusetts: | 3.5% |
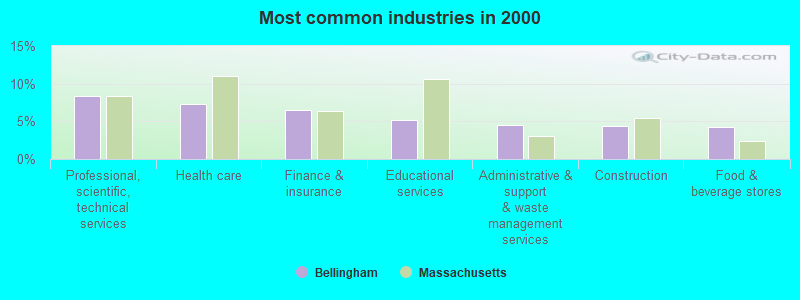
- Professional, scientific, technical services (8.3%)
- Health care (7.4%)
- Finance & insurance (6.5%)
- Educational services (5.1%)
- Administrative & support & waste management services (4.6%)
- Construction (4.4%)
- Food & beverage stores (4.3%)
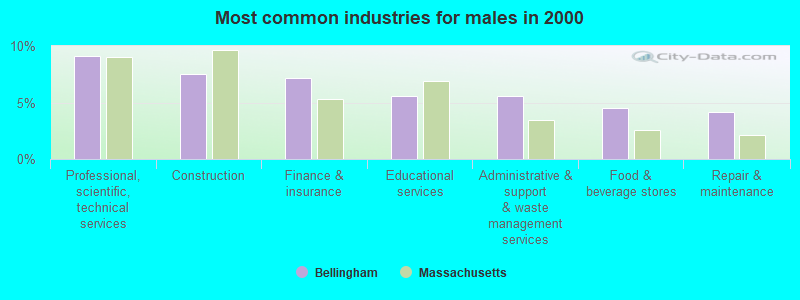
- Professional, scientific, technical services (9.1%)
- Construction (7.5%)
- Finance & insurance (7.2%)
- Educational services (5.6%)
- Administrative & support & waste management services (5.6%)
- Food & beverage stores (4.5%)
- Repair & maintenance (4.1%)
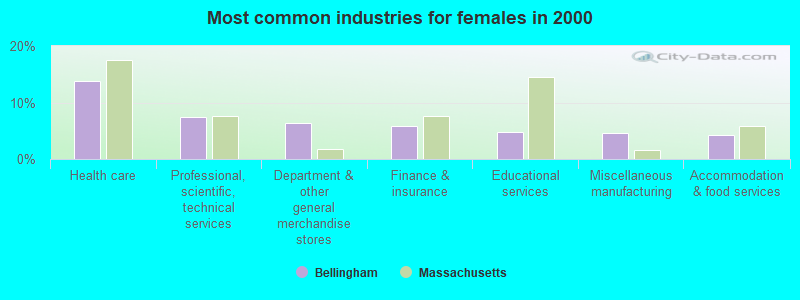
- Health care (13.8%)
- Professional, scientific, technical services (7.5%)
- Department & other general merchandise stores (6.4%)
- Finance & insurance (5.8%)
- Educational services (4.7%)
- Miscellaneous manufacturing (4.6%)
- Accommodation & food services (4.2%)
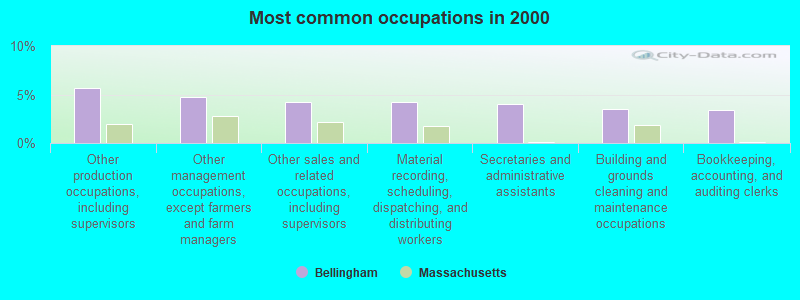
- Other production occupations, including supervisors (5.7%)
- Other management occupations, except farmers and farm managers (4.7%)
- Other sales and related occupations, including supervisors (4.3%)
- Material recording, scheduling, dispatching, and distributing workers (4.2%)
- Secretaries and administrative assistants (4.0%)
- Building and grounds cleaning and maintenance occupations (3.6%)
- Bookkeeping, accounting, and auditing clerks (3.4%)
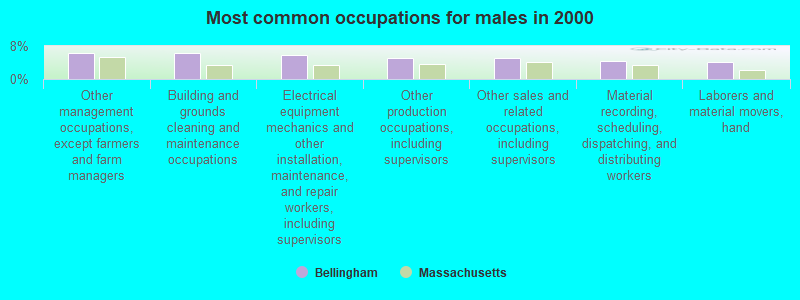
- Other management occupations, except farmers and farm managers (6.3%)
- Building and grounds cleaning and maintenance occupations (6.3%)
- Electrical equipment mechanics and other installation, maintenance, and repair workers, including supervisors (5.8%)
- Other production occupations, including supervisors (5.0%)
- Other sales and related occupations, including supervisors (5.0%)
- Material recording, scheduling, dispatching, and distributing workers (4.3%)
- Laborers and material movers, hand (4.1%)

- Secretaries and administrative assistants (8.0%)
- Bookkeeping, accounting, and auditing clerks (6.8%)
- Other production occupations, including supervisors (6.4%)
- Child care workers (5.0%)
- Other office and administrative support workers, including supervisors (4.8%)
- Cashiers (4.7%)
- Customer service representatives (4.7%)
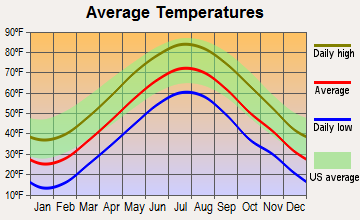
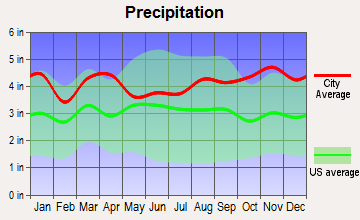
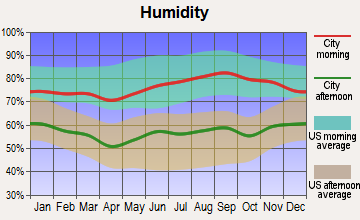
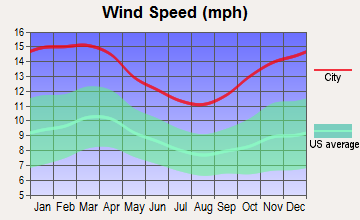
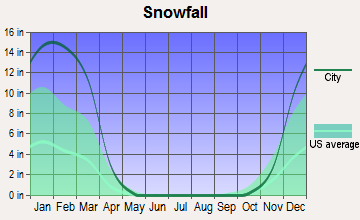
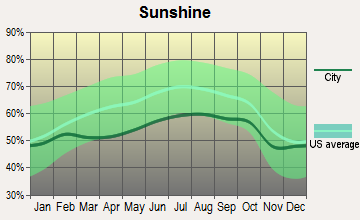
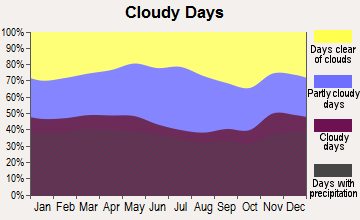
Average climate in Bellingham, Massachusetts
Based on data reported by over 4,000 weather stations
(lower is better)
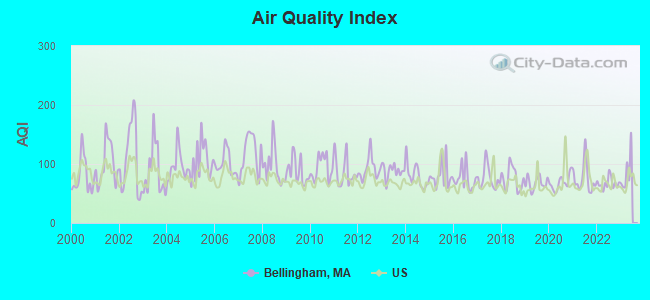
Air Quality Index (AQI) level in 2022 was 67.1. This is about average.
| City: | 67.1 |
| U.S.: | 72.6 |
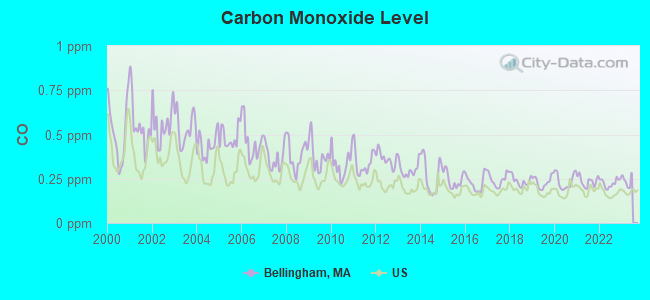
Carbon Monoxide (CO) [ppm] level in 2022 was 0.226. This is about average. Closest monitor was 15.9 miles away from the city center.
| City: | 0.226 |
| U.S.: | 0.251 |
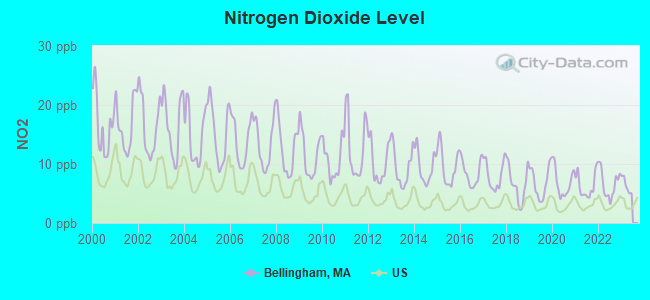
Nitrogen Dioxide (NO2) [ppb] level in 2022 was 6.60. This is worse than average. Closest monitor was 6.7 miles away from the city center.
| City: | 6.60 |
| U.S.: | 5.11 |
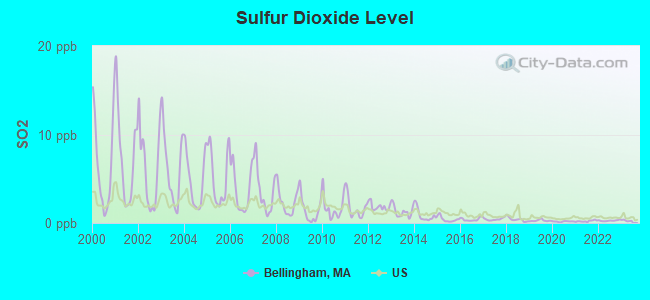
Sulfur Dioxide (SO2) [ppb] level in 2022 was 0.269. This is significantly better than average. Closest monitor was 6.7 miles away from the city center.
| City: | 0.269 |
| U.S.: | 1.515 |
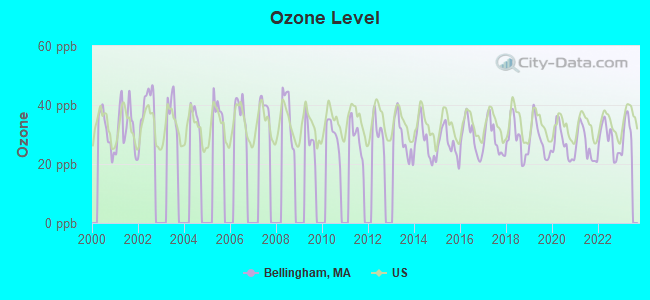
Ozone [ppb] level in 2022 was 28.2. This is about average. Closest monitor was 7.3 miles away from the city center.
| City: | 28.2 |
| U.S.: | 33.3 |
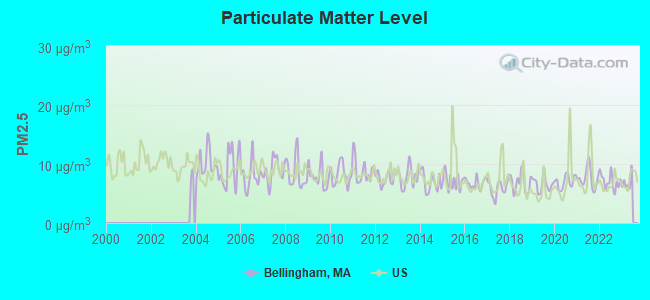
Particulate Matter (PM2.5) [µg/m3] level in 2022 was 7.03. This is about average. Closest monitor was 16.0 miles away from the city center.
| City: | 7.03 |
| U.S.: | 8.11 |
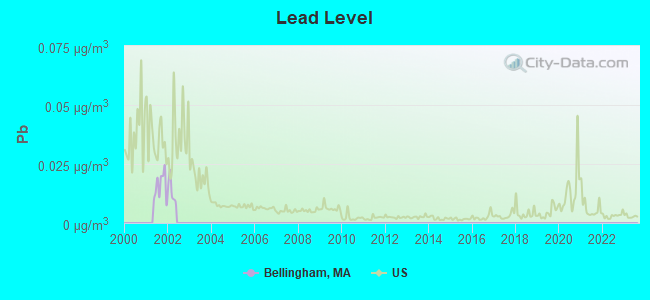
Lead (Pb) [µg/m3] level in 2001 was 0.0156. This is significantly worse than average. Closest monitor was 16.2 miles away from the city center.
| City: | 0.0156 |
| U.S.: | 0.0093 |
Tornado activity:
Bellingham-area historical tornado activity is near Massachusetts state average. It is 36% smaller than the overall U.S. average.
On 6/9/1953, a category F4 (max. wind speeds 207-260 mph) tornado 14.1 miles away from the Bellingham place center killed 90 people and injured 1228 people and caused between $50,000,000 and $500,000,000 in damages.
On 6/9/1953, a category F3 (max. wind speeds 158-206 mph) tornado 14.6 miles away from the place center injured 17 people and caused between $500,000 and $5,000,000 in damages.
Earthquake activity:
Bellingham-area historical earthquake activity is significantly above Massachusetts state average. It is 73% smaller than the overall U.S. average.On 10/7/1983 at 10:18:46, a magnitude 5.3 (5.1 MB, 5.3 LG, 5.1 ML, Class: Moderate, Intensity: VI - VII) earthquake occurred 193.5 miles away from Bellingham center
On 4/20/2002 at 10:50:47, a magnitude 5.3 (5.3 ML, Depth: 3.0 mi) earthquake occurred 200.9 miles away from Bellingham center
On 1/19/1982 at 00:14:42, a magnitude 4.7 (4.5 MB, 4.7 MD, 4.5 LG, Class: Light, Intensity: IV - V) earthquake occurred 97.2 miles away from the city center
On 4/20/2002 at 10:50:47, a magnitude 5.2 (5.2 MB, 4.2 MS, 5.2 MW, 5.0 MW) earthquake occurred 200.1 miles away from Bellingham center
On 10/16/2012 at 23:12:25, a magnitude 4.7 (4.7 ML, Depth: 10.0 mi) earthquake occurred 111.7 miles away from Bellingham center
On 8/22/1992 at 12:20:32, a magnitude 4.8 (4.8 MB, 3.8 MS, 4.7 LG, Depth: 6.2 mi) earthquake occurred 215.7 miles away from Bellingham center
Magnitude types: regional Lg-wave magnitude (LG), body-wave magnitude (MB), duration magnitude (MD), local magnitude (ML), surface-wave magnitude (MS), moment magnitude (MW)
Natural disasters:
The number of natural disasters in Norfolk County (31) is a lot greater than the US average (15).Major Disasters (Presidential) Declared: 18
Emergencies Declared: 13
Causes of natural disasters: Floods: 12, Storms: 10, Hurricanes: 6, Snowstorms: 5, Snows: 3, Winter Storms: 3, Blizzards: 2, Explosion: 1, Heavy Rain: 1, Snowfall: 1, Tropical Storm: 1, Water Main Break: 1, Wind: 1 (Note: some incidents may be assigned to more than one category).
Hospitals and medical centers near Bellingham:
- CONTINUING CARE CENTER AT HOPEDALE (Nursing Home, about 2 miles away; HOPEDALE, MA)
- HOPEDALE GARDEN NURSING HOME (Nursing Home, about 2 miles away; HOPEDALE, MA)
- FMC DIALYSIS SERVICES OF BLACKSTONE VALLEY (Dialysis Facility, about 4 miles away; MILFORD, MA)
- VNA AND HOSPICE OF GREATER MILFORD (Home Health Center, about 4 miles away; MILFORD, MA)
- BLAIRE HOUSE OF MILFORD (Nursing Home, about 4 miles away; MILFORD, MA)
- MILFORD REGIONAL MEDICAL CENTER Acute Care Hospitals (about 4 miles away; MILFORD, MA)
- ADIN MANOR CONVALESCENT HOME,T (Nursing Home, about 4 miles away; HOPEDALE, MA)
Amtrak stations near Bellingham:
- 13 miles: FRAMINGHAM (443 WAVERLY ST.) . Services: public payphones, snack bar, paid short-term parking, taxi stand, public transit connection.
- 19 miles: ROUTE 128 (WESTWOOD, UNIVERSITY AVE. & RTE. 128) . Services: ticket office, enclosed waiting area, public restrooms, public payphones, vending machines, paid short-term parking, taxi stand, public transit connection.
- 20 miles: PROVIDENCE (100 GASPEE ST.) . Services: ticket office, fully wheelchair accessible, enclosed waiting area, public restrooms, public payphones, snack bar, ATM, paid short-term parking, paid long-term parking, call for car rental service, taxi stand, public transit connection.
Colleges/universities with over 2000 students nearest to Bellingham:
- Bryant University (about 13 miles; Smithfield, RI; Full-time enrollment: 3,440)
- Framingham State University (about 14 miles; Framingham, MA; FT enrollment: 5,743)
- Wellesley College (about 17 miles; Wellesley, MA; FT enrollment: 2,658)
- Babson College (about 18 miles; Wellesley, MA; FT enrollment: 3,230)
- Rhode Island College (about 18 miles; Providence, RI; FT enrollment: 7,189)
- Providence College (about 18 miles; Providence, RI; FT enrollment: 4,312)
- Massachusetts Bay Community College (about 19 miles; Wellesley Hills, MA; FT enrollment: 3,636)
Public high schools in Bellingham:
- BELLINGHAM HIGH SCHOOL (Students: 765, Location: 80 BLACKSTONE STREET, Grades: 9-12)
- PRIMAVERA JUNIOR/SENIOR HIGH SCHOOL (Location: 80 HARPIN STREET, Grades: 7-12)
Public elementary/middle schools in Bellingham:
- BELLINGHAM MEMORIAL MIDDLE SCHOOL (Students: 819, Location: 130 BLACKSTONE STREET, Grades: 5-8)
- SOUTH ELEMENTARY (Students: 412, Location: 70 HARPIN STREET, Grades: KG-4)
- CLARA MACY ELEMENTARY (Students: 277, Location: 60 MONIQUE DR, Grades: KG-4)
- STALL BROOK (Students: 274, Location: 342 HARTFORD AVENUE, Grades: KG-4)
Points of interest:
Notable location: Bellingham Town Offices (A). Display/hide its location on the map
Churches in Bellingham include: First Baptist Church (A), Saint Blaise Church (B). Display/hide their locations on the map
Cemeteries: Center Cemetery (1), North Bellingham Cemetery (2), Bellingham Center Cemetery (3). Display/hide their locations on the map
Reservoir: Box Pond (A). Display/hide its location on the map
Streams, rivers, and creeks: Beaver Brook (A). Display/hide its location on the map
Birthplace of: Jason DeLucia - Martial artist, John Milton Thayer - Union Army general, Levi Cook - Politician, Ted Lewis (voice actor) - Actor.
Drinking water stations with addresses in Bellingham and their reported violations in the past:
BELLINGHAM DPW WATER SEWER DIV. (Population served: 15,285, Groundwater):Past health violations:Past monitoring violations:
- MCL, Monthly (TCR) - In MAY-2013, Contaminant: Coliform. Follow-up actions: St AO (w/o penalty) issued (JUN-28-2013), St Compliance achieved (JUN-28-2013)
- MCL, Monthly (TCR) - In JUL-2011, Contaminant: Coliform. Follow-up actions: St AO (w/o penalty) issued (SEP-09-2011)
- MCL, Monthly (TCR) - In DEC-2010, Contaminant: Coliform. Follow-up actions: St AO (w/o penalty) issued (FEB-04-2011), St Compliance achieved (FEB-04-2011)
- MCL, Monthly (TCR) - In SEP-2009, Contaminant: Coliform. Follow-up actions: St AO (w/o penalty) issued (OCT-13-2009), St Compliance achieved (OCT-13-2009)
- MCL, Monthly (TCR) - In JUL-2009, Contaminant: Coliform. Follow-up actions: St AO (w/o penalty) issued (AUG-25-2009), St Compliance achieved (AUG-25-2009)
- MCL, Monthly (TCR) - In NOV-2008, Contaminant: Coliform. Follow-up actions: St AO (w/o penalty) issued (JAN-26-2009), St Compliance achieved (JAN-26-2009)
- Monitoring, Repeat Major (TCR) - In DEC-2013, Contaminant: Coliform (TCR). Follow-up actions: St AO (w/o penalty) issued (MAR-03-2014)
- Monitoring and Reporting (DBP) - Between OCT-2005 and DEC-2005, Contaminant: TTHM. Follow-up actions: St AO (w/o penalty) issued (FEB-17-2006)
| This place: | 2.5 people |
| Massachusetts: | 2.5 people |
| This place: | 68.2% |
| Whole state: | 63.0% |
| This place: | 6.9% |
| Whole state: | 7.0% |
Likely homosexual households (counted as self-reported same-sex unmarried-partner households)
- Lesbian couples: 0.4% of all households
- Gay men: 0.2% of all households
Banks with branches in Bellingham (2011 data):
- RBS Citizens, National Association: Bellingham Stop & Shop Branch at 70 Pulaski Boulevard, branch established on 2004/10/28; Bellingham Dunkin Donuts at 815 South Main Street, branch established on 2009/10/05. Info updated 2007/09/19: Bank assets: $106,940.6 mil, Deposits: $75,690.2 mil, headquarters in Providence, RI, positive income, 1135 total offices, Holding Company: Uk Financial Investments Limited
- Dean Co-operative Bank: Pulaski Branch at 411 Pulaski Boulevard, branch established on 1987/10/13; Operations Branch at 435-437 Pulaski Boulevard, branch established on 2000/01/01. Info updated 2006/11/03: Bank assets: $223.1 mil, Deposits: $183.8 mil, headquarters in Franklin, MA, positive income, Mortgage Lending Specialization, 5 total offices
- Middlesex Savings Bank: Bellingham Branch at 267 Hartford Avenue, branch established on 1999/06/25. Info updated 2009/07/16: Bank assets: $4,034.8 mil, Deposits: $3,490.0 mil, headquarters in Natick, MA, positive income, Mortgage Lending Specialization, 33 total offices, Holding Company: Middlesex Bancorp Mhc
- Charles River Bank: Bellingham Branch at 3 South Maple St, branch established on 2009/03/30. Info updated 2009/07/27: Bank assets: $187.0 mil, Deposits: $156.1 mil, headquarters in Medway, MA, positive income, Mortgage Lending Specialization, 4 total offices, Holding Company: Charles River Bancorp, Mhc
- Sovereign Bank, National Association: Bellingham Branch at 13 North Main Street, branch established on 1970/11/18. Info updated 2012/01/31: Bank assets: $78,146.9 mil, Deposits: $48,042.9 mil, headquarters in Wilmington, DE, positive income, Commercial Lending Specialization, 718 total offices, Holding Company: Banco Santander, S.A.
- The Milford National Bank and Trust Company: Bellingham Branch at 286 Hartford Avenue, branch established on 1999/08/12. Info updated 2006/11/03: Bank assets: $267.5 mil, Deposits: $233.6 mil, headquarters in Milford, MA, positive income, Commercial Lending Specialization, 6 total offices, Holding Company: Mnb Bancorp
- Rockland Trust Company: Bellingham Branch at 4 North Main Street, branch established on 1974/04/09. Info updated 2009/05/20: Bank assets: $4,974.4 mil, Deposits: $3,903.9 mil, headquarters in Rockland, MA, positive income, Commercial Lending Specialization, 67 total offices, Holding Company: Independent Bank Corp.
For population 15 years and over in Bellingham:
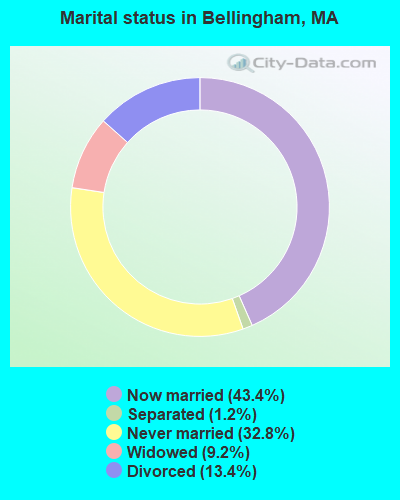
- Never married: 32.8%
- Now married: 43.4%
- Separated: 1.2%
- Widowed: 9.2%
- Divorced: 13.4%
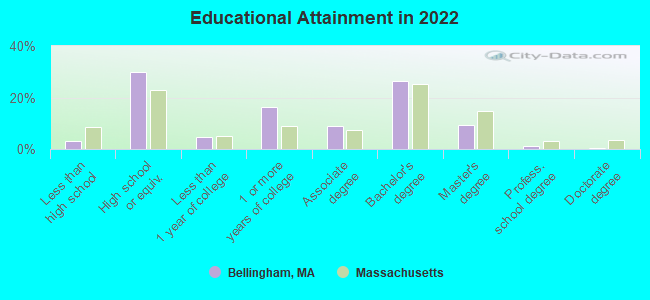
For population 25 years and over in Bellingham:
- High school or higher: 96.7%
- Bachelor's degree or higher: 36.1%
- Graduate or professional degree: 10.5%
- Unemployed: 2.5%
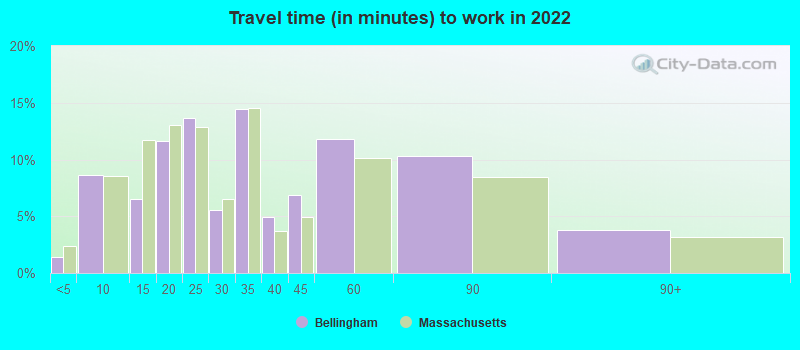
- Mean travel time to work (commute): 27.7 minutes
| Here: | 9.4 |
| Massachusetts average: | 13.0 |
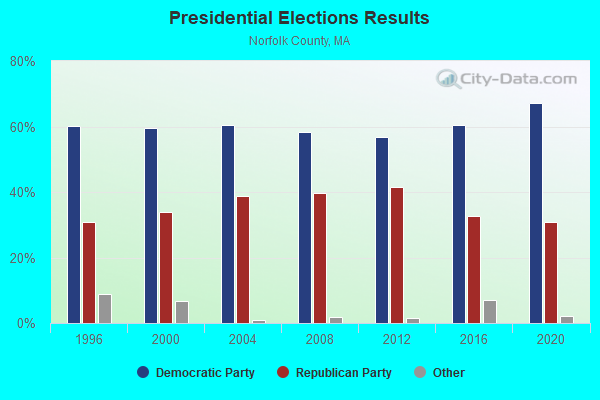
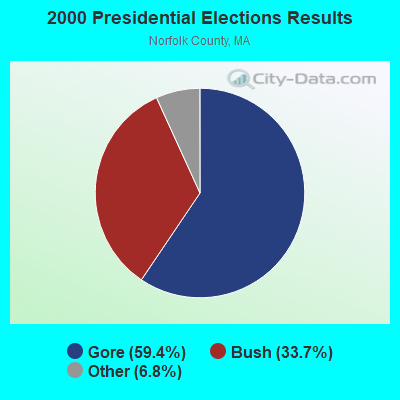
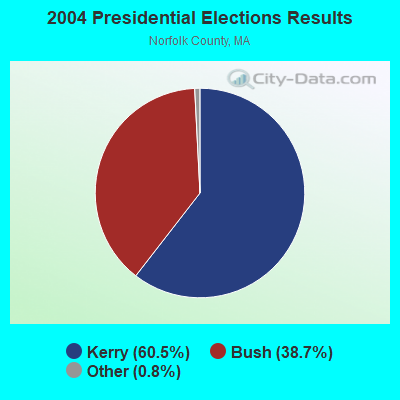
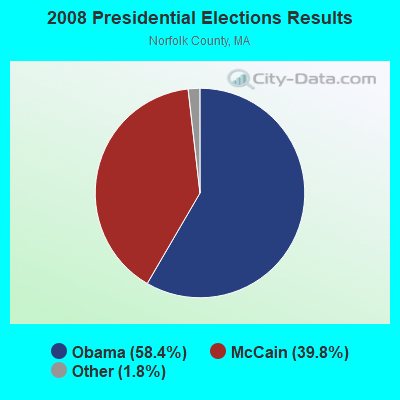
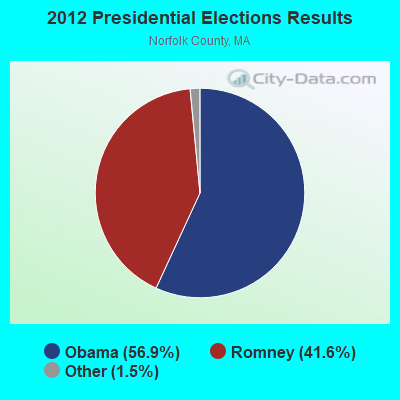

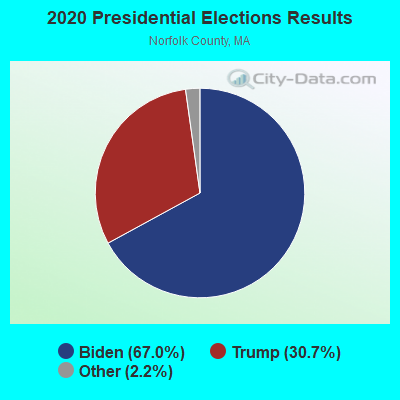
Graphs represent county-level data. Detailed 2008 Election Results
Religion statistics for Bellingham, MA (based on Norfolk County data)
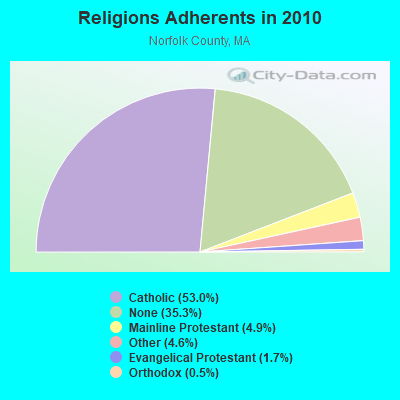
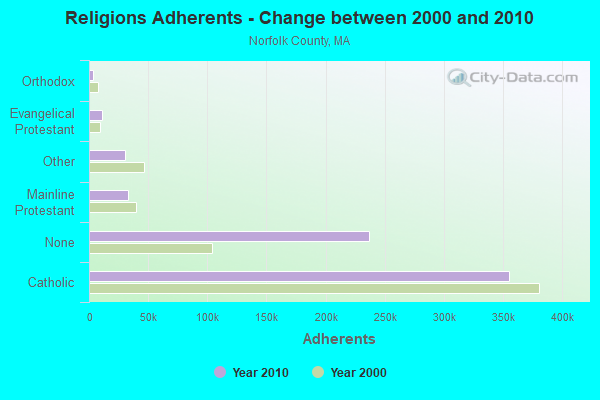
| Religion | Adherents | Congregations |
|---|---|---|
| Catholic | 355,321 | 52 |
| Mainline Protestant | 33,086 | 115 |
| Other | 30,593 | 75 |
| Evangelical Protestant | 11,323 | 89 |
| Orthodox | 3,539 | 9 |
| None | 236,988 | - |
Food Environment Statistics:
| This county: | 1.65 / 10,000 pop. |
| Massachusetts: | 1.98 / 10,000 pop. |
| This county: | 0.09 / 10,000 pop. |
| State: | 0.05 / 10,000 pop. |
| Norfolk County: | 2.04 / 10,000 pop. |
| Massachusetts: | 2.22 / 10,000 pop. |
| Norfolk County: | 1.57 / 10,000 pop. |
| State: | 1.77 / 10,000 pop. |
| Norfolk County: | 8.48 / 10,000 pop. |
| Massachusetts: | 8.76 / 10,000 pop. |
| This county: | 7.1% |
| Massachusetts: | 8.1% |
| Here: | 19.1% |
| Massachusetts: | 22.5% |
| Here: | 12.9% |
| Massachusetts: | 16.5% |
Health and Nutrition:
| Bellingham: | 49.5% |
| Massachusetts: | 50.5% |
| Here: | 48.6% |
| Massachusetts: | 48.0% |
| Bellingham: | 29.1 |
| State: | 28.4 |
| Bellingham: | 22.8% |
| Massachusetts: | 20.7% |
| Bellingham: | 8.1% |
| State: | 10.4% |
| This city: | 6.8 |
| Massachusetts: | 6.8 |
| This city: | 38.9% |
| Massachusetts: | 33.4% |
| Bellingham: | 57.4% |
| Massachusetts: | 57.1% |
| Bellingham: | 79.7% |
| State: | 79.2% |
More about Health and Nutrition of Bellingham, MA Residents
8.01% of this county's 2021 resident taxpayers lived in other counties in 2020 ($110,572 average adjusted gross income)
| Here: | 8.01% |
| Massachusetts average: | 6.35% |
0.01% of residents moved from foreign countries ($78 average AGI)
Norfolk County: 0.01% Massachusetts average: 0.01%
Top counties from which taxpayers relocated into this county between 2020 and 2021:
| from Suffolk County, MA | |
| from Middlesex County, MA | |
| from Plymouth County, MA |
8.55% of this county's 2020 resident taxpayers moved to other counties in 2021 ($128,358 average adjusted gross income)
| Here: | 8.55% |
| Massachusetts average: | 7.18% |
0.01% of residents moved to foreign countries ($348 average AGI)
Norfolk County: 0.01% Massachusetts average: 0.02%
Top counties to which taxpayers relocated from this county between 2020 and 2021:
| to Suffolk County, MA | |
| to Middlesex County, MA | |
| to Plymouth County, MA |
| Businesses in Bellingham, MA | ||||
| Name | Count | Name | Count | |
|---|---|---|---|---|
| Ace Hardware | 1 | Nike | 1 | |
| Advance Auto Parts | 1 | Old Navy | 1 | |
| Barnes & Noble | 1 | Outback | 1 | |
| CVS | 1 | Outback Steakhouse | 1 | |
| Cold Stone Creamery | 1 | PetSmart | 1 | |
| Dairy Queen | 1 | Pier 1 Imports | 1 | |
| Domino's Pizza | 1 | Staples | 1 | |
| Dunkin Donuts | 5 | Stop & Shop | 1 | |
| FedEx | 2 | Subway | 1 | |
| GameStop | 1 | T-Mobile | 2 | |
| Gap | 1 | Toys"R"Us | 1 | |
| H&R Block | 1 | U-Haul | 1 | |
| Home Depot | 1 | Verizon Wireless | 1 | |
| JoS. A. Bank | 1 | Walgreens | 2 | |
| MasterBrand Cabinets | 2 | Walmart | 1 | |
| McDonald's | 1 | Whole Foods Market | 1 | |
Strongest AM radio stations in Bellingham:
- WALE (990 AM; 50 kW; GREENVILLE, RI; Owner: NORTH AMERICAN BROADCASTING CO., INC.)
- WAMG (890 AM; 25 kW; DEDHAM, MA; Owner: MEGA COMMUNICATIONS OF DEDHAM LICENSEE, LLC)
- WKOX (1200 AM; 50 kW; FRAMINGHAM, MA; Owner: CAPSTAR TX LIMITED PARTNERSHIP)
- WEEI (850 AM; 50 kW; BOSTON, MA; Owner: ENTERCOM BOSTON LICENSE, LLC)
- WBIX (1060 AM; 40 kW; NATICK, MA; Owner: LANGER BROADCASTING CORPORATION)
- WCRN (830 AM; 50 kW; WORCESTER, MA; Owner: CARTER BROADCASTING CORPORATION)
- WRKO (680 AM; 50 kW; BOSTON, MA; Owner: ENTERCOM BOSTON LICENSE, LLC)
- WMRC (1490 AM; 1 kW; MILFORD, MA; Owner: FIRST CLASS RADIO CORP.)
- WWZN (1510 AM; 50 kW; BOSTON, MA; Owner: ROSE CITY RADIO CORPORATION)
- WNRI (1380 AM; 2 kW; WOONSOCKET, RI; Owner: ANASTOS MEDIA GROUP, INC.)
- WRCA (1330 AM; 25 kW; WALTHAM, MA; Owner: WRCA LICENSE, LLC)
- WBZ (1030 AM; 50 kW; BOSTON, MA; Owner: INFINITY BROADCASTING OPERATIONS, INC.)
- WDDZ (550 AM; 5 kW; PAWTUCKET, RI; Owner: ABC, INC.)
Strongest FM radio stations in Bellingham:
- WGAO (88.3 FM; FRANKLIN, MA; Owner: DEAN COLLEGE)
- WWKX (106.3 FM; WOONSOCKET, RI; Owner: AAA ENTERTAINMENT LICENSING LLC)
- WBMX (98.5 FM; BOSTON, MA; Owner: INFINITY RADIO OPERATIONS INC.)
- WJMN (94.5 FM; BOSTON, MA; Owner: AMFM RADIO LICENSES, L.L.C.)
- WBOS (92.9 FM; BROOKLINE, MA; Owner: GREATER BOSTON RADIO, INC.)
- WCRB (102.5 FM; WALTHAM, MA; Owner: CHARLES RIVER BROADCASTING WCRB LICE)
- WTKK (96.9 FM; BOSTON, MA; Owner: GREATER BOSTON RADIO, INC.)
- WROR-FM (105.7 FM; FRAMINGHAM, MA; Owner: GREATER BOSTON RADIO, INC.)
- WGBH (89.7 FM; BOSTON, MA; Owner: WGBH EDUCATIONAL FOUNDATION)
- WWBB (101.5 FM; PROVIDENCE, RI; Owner: CLEAR CHANNEL BROADCASTING LICENSES, INC.)
- WBUR-FM (90.9 FM; BOSTON, MA; Owner: TRUSTEES OF BOSTON UNIVERSITY)
- WODS (103.3 FM; BOSTON, MA; Owner: INFINITY BROADCASTING OPERATIONS, INC.)
- WXKS-FM (107.9 FM; MEDFORD, MA; Owner: AMFM RADIO LICENSES, L.L.C.)
- WMJX (106.7 FM; BOSTON, MA; Owner: GREATER BOSTON RADIO, INC.)
- WAAF (107.3 FM; WORCESTER, MA; Owner: ENTERCOM BOSTON LICENSE, LLC)
- WHHB (99.9 FM; HOLLISTON, MA; Owner: HOLLISTON HIGH SCHOOL)
- WSNE-FM (93.3 FM; TAUNTON, MA; Owner: CAPSTAR TX LIMITED PARTNERSHIP)
- WSRS (96.1 FM; WORCESTER, MA; Owner: CAPSTAR TX LIMITED PARTNERSHIP)
- WPRO-FM (92.3 FM; PROVIDENCE, RI; Owner: CITADEL BROADCASTING COMPANY)
- WBCN (104.1 FM; BOSTON, MA; Owner: HEMISPHERE BROADCASTING CORPORATION)
TV broadcast stations around Bellingham:
- WCVB-TV (Channel 5; BOSTON, MA; Owner: WCVB HEARST-ARGYLE TV, INC.)
- WGBH-TV (Channel 2; BOSTON, MA; Owner: WGBH EDUCATIONAL FOUNDATION)
- WMFP (Channel 62; LAWRENCE, MA; Owner: WSAH LICENSE, INC.)
- WHDH-TV (Channel 7; BOSTON, MA; Owner: WHDH-TV)
- WBZ-TV (Channel 4; BOSTON, MA; Owner: VIACOM INC.)
- WGBX-TV (Channel 44; BOSTON, MA; Owner: WGBH EDUCATIONAL FOUNDATION)
- WSBK-TV (Channel 38; BOSTON, MA; Owner: VIACOM INC.)
- WLVI-TV (Channel 56; CAMBRIDGE, MA; Owner: WLVI, INC.)
- WUNI (Channel 27; WORCESTER, MA; Owner: ENTRAVISION HOLDINGS, LLC)
- WUTF (Channel 66; MARLBOROUGH, MA; Owner: TELEFUTURA BOSTON LLC)
- WFXT (Channel 25; BOSTON, MA; Owner: FOX TELEVISION STATIONS INC.)
- WNAC-TV (Channel 64; PROVIDENCE, RI; Owner: WNAC, LLC)
- WPRI-TV (Channel 12; PROVIDENCE, RI; Owner: TVL BROADCASTING OF RHODE ISLAND, LLC)
- WLNE-TV (Channel 6; NEW BEDFORD, MA; Owner: FREEDOM BROADCASTING OF SOUTHERN NEW ENGLAND, INC.)
- WJAR (Channel 10; PROVIDENCE, RI; Owner: OUTLET BROADCASTING, INC.)
- W40BO (Channel 40; BOSTON, MA; Owner: PAXSON COMMUNICATIONS LPTV, INC.)
- WWDP (Channel 46; NORWELL, MA; Owner: NORWELL TELEVISION, LLC)
- WSBE-TV (Channel 36; PROVIDENCE, RI; Owner: RHODE ISLAND PUBLIC TELECOM. AUTHORITY)
- WBPX (Channel 68; BOSTON, MA; Owner: PAXSON BOSTON-68 LICENSE, INC.)
- WPXQ (Channel 69; BLOCK ISLAND, RI; Owner: OCEAN STATE TELEVISION, L.L.C.)
- WTMU-LP (Channel 32; BOSTON, MA; Owner: ZGS BOSTON, INC.)
- WCEA-LP (Channel 58; BOSTON, MA; Owner: CHANNEL 19 TV CORPORATION)
- WYDN (Channel 48; WORCESTER, MA; Owner: EDUCATIONAL PUBLIC TV CORPORATION)
- WRIW-LP (Channel 50; PROVIDENCE, RI; Owner: ZGS PROVIDENCE, INC.)
- WLWC (Channel 28; NEW BEDFORD, MA; Owner: C-28 FCC LICENSEE SUBSIDIARY, LLC)
- National Bridge Inventory (NBI) Statistics
- 8Number of bridges
- 49ft / 15.4mTotal length
- $14,434,000Total costs
- 168,749Total average daily traffic
- 10,378Total average daily truck traffic
- 246,814Total future (year 2031) average daily traffic
FCC Registered Antenna Towers:
2- ROBERT L STOW, 121 Depot Street (Lat: 42.096389 Lon: -71.483056), Type: 48.8, Overall height: 48.8 m, Registrant: Tower Depot LLC, Belli-ngham, Phone: (508) 966-2333
- Robert Stow, 121 Depot Street (Lat: 42.096389 Lon: -71.483056), Type: 48.8, Overall height: 48.8 m, Registrant: Tower Depot LLC, Belli-ngham, Phone: (508) 966-2333
FCC Registered Broadcast Land Mobile Towers:
13 (See the full list of FCC Registered Broadcast Land Mobile Towers in Bellingham, MA)FCC Registered Microwave Towers:
2- BOS1816, 121 Depot Street (Lat: 42.096389 Lon: -71.483056), Type: Tower, Structure height: 48.8 m, Call Sign: WQHM674, Licensee ID: L01728370,
Assigned Frequencies: 10915.0 MHz, 17820.0 MHz, Grant Date: 09/11/2007, Expiration Date: 09/11/2017, Cancellation Date: 09/09/2013, Certifier: Joseph M Sandri Jr., Registrant: Fibertower Network Services, Corp., Debtor-In-Possession, 1875 Eye Street, Nw, 5th Floor, Room 505, Washington, DC 20006, Phone: (202) 223-1028, Email:
- BELLINGHAM, Lat: 42.078722 Lon: -71.465667, Call Sign: WQLA969,
Assigned Frequencies: 956.343 MHz, Grant Date: 09/25/2019, Expiration Date: 11/17/2029, Certifier: Donald F Dimartino, Registrant: Town Of Bellingham, 26 Blackstone St, Bellingham, MA 02019, Phone: (508) 966-5816, Fax: (508) 966-5814, Email:
FCC Registered Amateur Radio Licenses:
82 (See the full list of FCC Registered Amateur Radio Licenses in Bellingham)FAA Registered Aircraft:
5- Aircraft: PIPER PA-28-161 (Category: Land, Seats: 4, Weight: Up to 12,499 Pounds, Speed: 108 mph), Engine: LYCOMING 0-320 SERIES (180 HP) (Reciprocating)
N-Number: 1036Q, N1036Q, N-1036Q, Serial Number: 28-7716079, Year manufactured: 1977, Airworthiness Date: 02/18/1977, Certificate Issue Date: 04/12/2017
Registrant (Individual): Michael Kelley, 54 High St, Bellingham, MA 02019 - Aircraft: CESSNA 172M (Category: Land, Seats: 4, Weight: Up to 12,499 Pounds, Speed: 108 mph), Engine: LYCOMING 0-320 SERIES (180 HP) (4 Cycle)
N-Number: 21819, N21819, N-21819, Serial Number: 17264029, Year manufactured: 1974, Airworthiness Date: 09/27/1974, Certificate Issue Date: 04/06/2007
Registrant (LLC): Middlesex Aviation Partners LLC, 49 Wethersfield Rd, Bellingham, MA 02019 - Aircraft: CESSNA 172N (Category: Land, Seats: 4, Weight: Up to 12,499 Pounds, Speed: 105 mph), Engine: LYCOMING 0-320 SERIES (180 HP) (Reciprocating)
N-Number: 734TA, N734TA, N-734TA, Serial Number: 17269090, Year manufactured: 1977, Airworthiness Date: 05/12/1977, Certificate Issue Date: 06/26/1996
Registrant (Corporation): Ironbound Aviation Inc, 154 North St, Bellingham, MA 02019 - Aircraft: DJI INNOVATIONS PHANTOM 3 PROFESSION (Category: Land, Engines: 4), Engine: Electric
N-Number: 508PR, N508PR, N-508PR, Serial Number: P76DCE26013870, Certificate Issue Date: 09/30/2015
Registrant (LLC): 508 Productions LLC, 420 Pulaski Blvd, Bellingham, MA 02019
Deregistered: Cancel Date: 01/18/2019 - Aircraft: STINSON 108-1 (Category: Land, Seats: 4, Weight: Up to 12,499 Pounds, Speed: 84 mph), Engine: FRANKLIN 6A4165 SERIES (165 HP) (Reciprocating)
N-Number: 875D, N875D, N-875D, Serial Number: 1082875, Year manufactured: 1947
Registrant (Individual): George F Cartier, 151 S Main St, S Bellingham, MA 00000
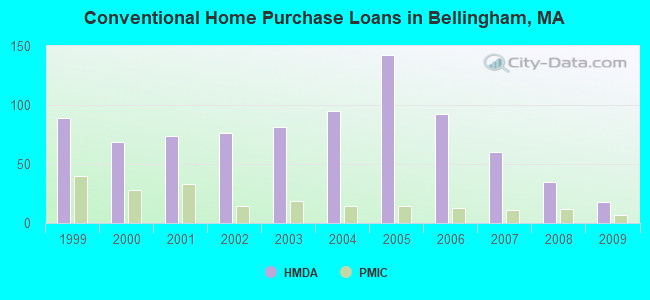
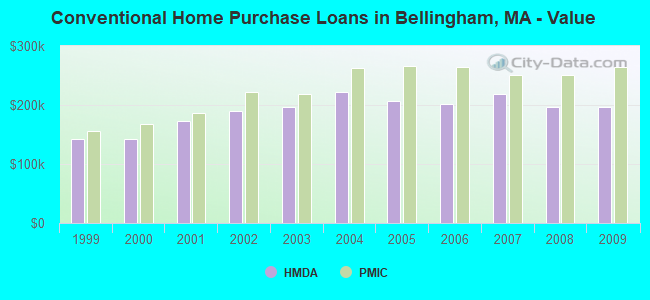
| Home Mortgage Disclosure Act Aggregated Statistics For Year 2009 (Based on 1 partial tract) | ||||||||||
| A) FHA, FSA/RHS & VA Home Purchase Loans | B) Conventional Home Purchase Loans | C) Refinancings | D) Home Improvement Loans | F) Non-occupant Loans on < 5 Family Dwellings (A B C & D) | ||||||
|---|---|---|---|---|---|---|---|---|---|---|
| Number | Average Value | Number | Average Value | Number | Average Value | Number | Average Value | Number | Average Value | |
| LOANS ORIGINATED | 23 | $228,094 | 18 | $196,232 | 139 | $207,796 | 8 | $89,586 | 4 | $153,122 |
| APPLICATIONS APPROVED, NOT ACCEPTED | 2 | $200,120 | 2 | $143,060 | 7 | $235,090 | 0 | $0 | 1 | $79,940 |
| APPLICATIONS DENIED | 4 | $190,888 | 3 | $222,540 | 45 | $223,032 | 2 | $50,720 | 3 | $152,527 |
| APPLICATIONS WITHDRAWN | 2 | $180,550 | 4 | $170,352 | 28 | $230,345 | 3 | $129,557 | 1 | $54,580 |
| FILES CLOSED FOR INCOMPLETENESS | 0 | $0 | 1 | $27,570 | 8 | $235,542 | 2 | $30,320 | 0 | $0 |
Detailed HMDA statistics for the following Tracts: 4431.01
| Private Mortgage Insurance Companies Aggregated Statistics For Year 2009 (Based on 1 partial tract) | ||||
| A) Conventional Home Purchase Loans | B) Refinancings | |||
|---|---|---|---|---|
| Number | Average Value | Number | Average Value | |
| LOANS ORIGINATED | 7 | $264,860 | 5 | $294,946 |
| APPLICATIONS APPROVED, NOT ACCEPTED | 0 | $0 | 2 | $268,760 |
| APPLICATIONS DENIED | 1 | $100,890 | 2 | $340,430 |
| APPLICATIONS WITHDRAWN | 0 | $0 | 1 | $326,920 |
| FILES CLOSED FOR INCOMPLETENESS | 0 | $0 | 0 | $0 |
Detailed PMIC statistics for the following Tracts: 4431.01
2002 - 2018 National Fire Incident Reporting System (NFIRS) incidents
- Fire incident types reported to NFIRS in Bellingham, MA
- 57049.0%Structure Fires
- 38433.0%Outside Fires
- 16814.4%Mobile Property/Vehicle Fires
- 413.5%Other
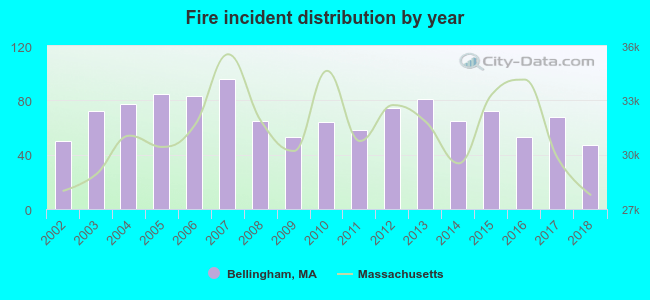 According to the data from the years 2002 - 2018 the average number of fires per year is 68. The highest number of reported fires - 96 took place in 2007, and the least - 47 in 2018. The data has a declining trend.
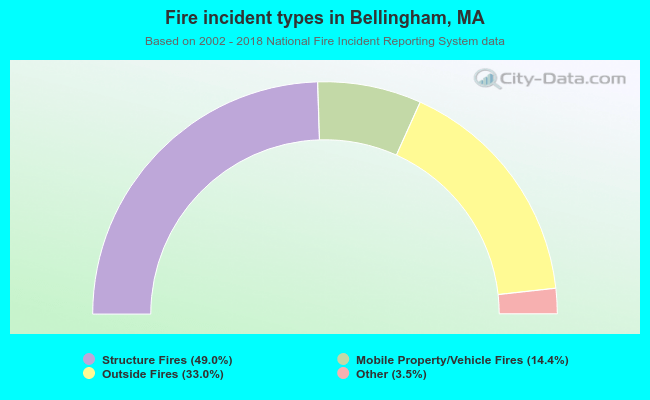 When looking into fire subcategories, the most reports belonged to: Structure Fires (49.0%), and Outside Fires (33.0%).
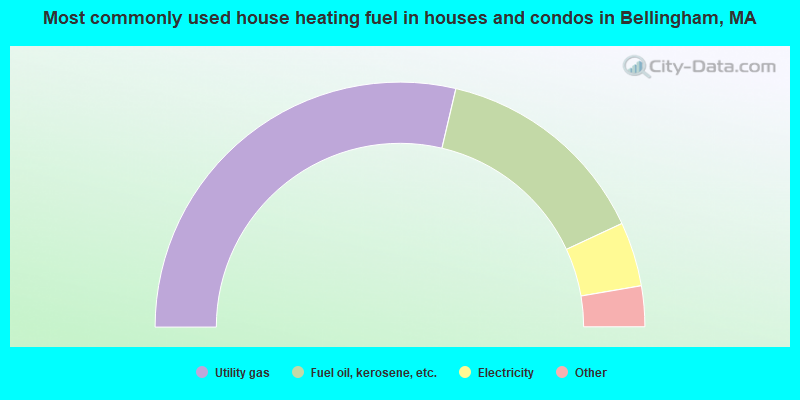
- 57.4%Utility gas
- 28.8%Fuel oil, kerosene, etc.
- 8.5%Electricity
- 3.8%Bottled, tank, or LP gas
- 0.8%Solar energy
- 0.7%Other fuel
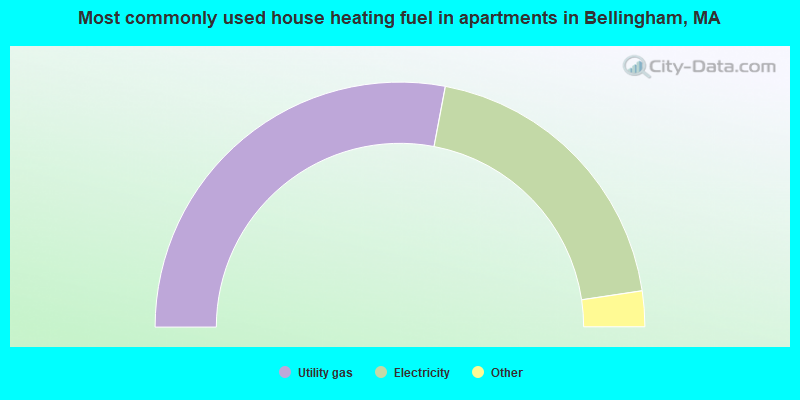
- 56.0%Utility gas
- 39.4%Electricity
- 2.6%No fuel used
- 2.0%Bottled, tank, or LP gas
Bellingham compared to Massachusetts state average:
- Unemployed percentage significantly below state average.
- Black race population percentage significantly below state average.
- Hispanic race population percentage below state average.
- Foreign-born population percentage significantly below state average.
- Length of stay since moving in significantly above state average.
- House age below state average.
- Number of college students below state average.
Bellingham on our top lists:
- #16 on the list of "Top 101 cities with the most residents born in Barbados (population 500+)"
- #24 on the list of "Top 101 cities with the most residents born in Lebanon (population 500+)"
- #7 on the list of "Top 101 counties with the highest percentage of residents that visited a dentist within the past year"
- #12 on the list of "Top 101 counties with the lowest percentage of residents that keep firearms around their homes"
- #13 on the list of "Top 101 counties with the best general health status score of residents (1-5), 3 years of data"
- #18 on the list of "Top 101 counties with the lowest Nitrogen Dioxide air pollution readings in 2012 (ppm)"
- #25 on the list of "Top 101 counties with the lowest number of infant deaths per 1000 residents 2007-2013 (pop. 50,000+)"

|
|
Total of 206 patent applications in 2008-2024.