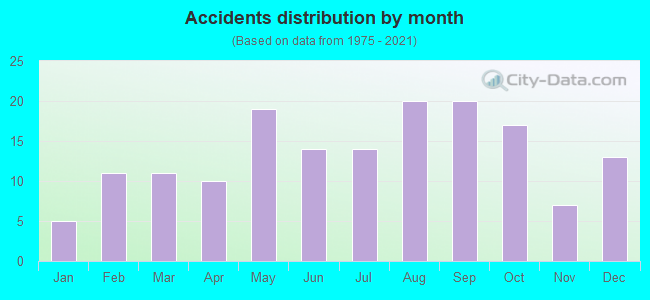
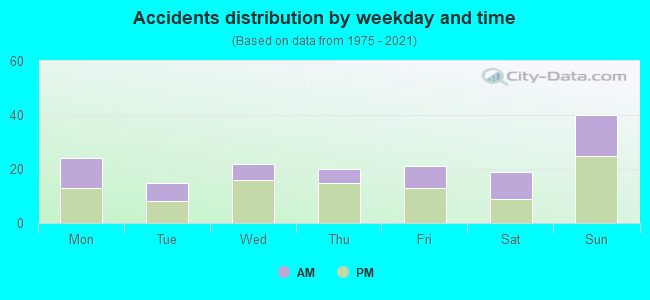
Fatal car crashes and road traffic accidents in Annapolis, Maryland
- Fatal car crash and road traffic accident statistics for 2021
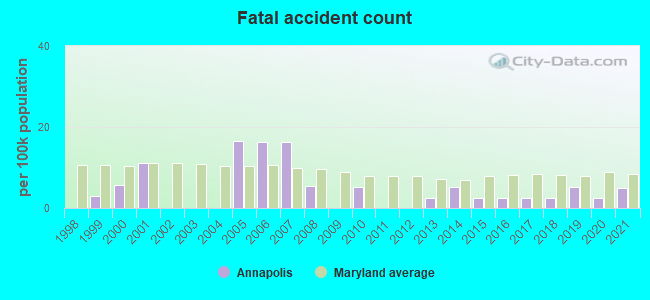
- Fatal accident count2
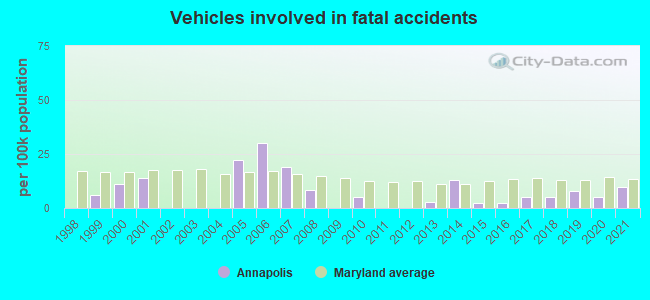
- Vehicles involved in fatal accidents4
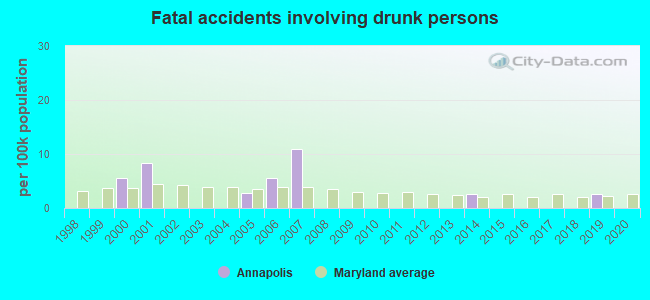
- Fatal accidents involving drunk persons0
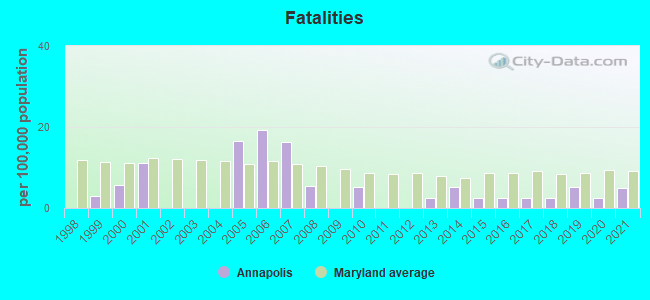
- Fatalities2
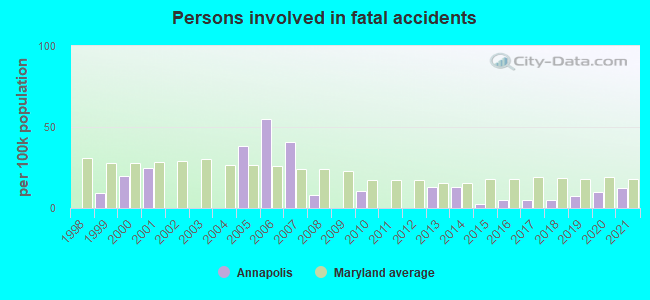
- Persons involved in fatal accidents5
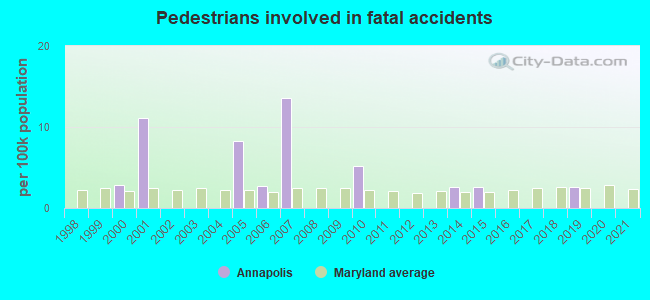
- Pedestrians involved in fatal accidents0
- Fatal car crash and road traffic accident statistics for 2020
- Fatal accident count1
- Vehicles involved in fatal accidents2
- Fatal accidents involving drunk persons0
- Fatalities1
- Persons involved in fatal accidents4
- Pedestrians involved in fatal accidents0
- Fatal car crash and road traffic accident statistics for 2019
- Fatal accident count2
- Vehicles involved in fatal accidents3
- Fatal accidents involving drunk persons1
- Fatalities2
- Persons involved in fatal accidents3
- Pedestrians involved in fatal accidents1
- Fatal car crash and road traffic accident statistics for 2018
- Fatal accident count1
- Vehicles involved in fatal accidents2
- Fatal accidents involving drunk persons0
- Fatalities1
- Persons involved in fatal accidents2
- Pedestrians involved in fatal accidents0
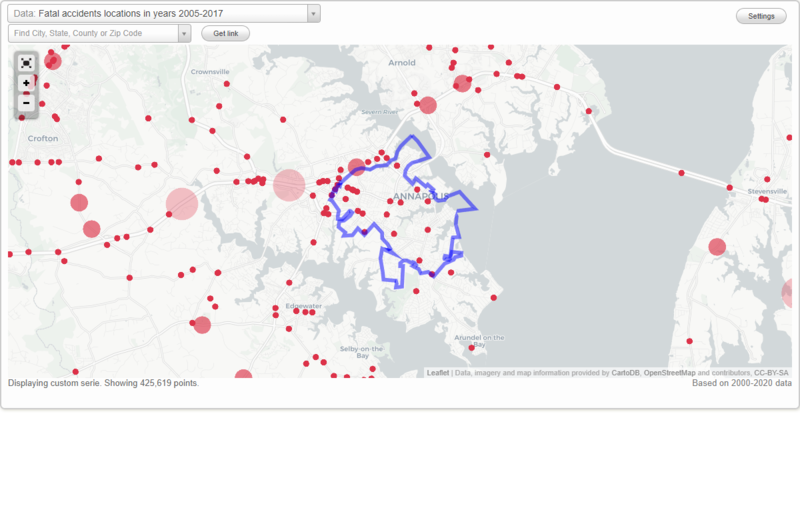
Data:
Latest news about accidents in Annapolis, MD collected exclusively by city-data.com from local newspapers, TV, and radio stations
No street view available for this location
Annapolis fatal accident statistics for 1998 - 2021
Average EMS response time
- Annapolis(Based on 65 reports) 10.8 mins
- Anne Arundel County(Based on 814 reports) 6.3 mins
- Maryland(Based on 9,353 reports) 7.8 mins
Average hospital transport time
- Annapolis(Based on 5 reports) 34.2 mins
- Anne Arundel County(Based on 135 reports) 44.4 mins
- Maryland(Based on 1,208 reports) 40.4 mins
Daylight
- Annapolis(Based on 162 reports) 38.3%
- Anne Arundel County(Based on 2,436 reports) 41.1%
- Maryland(Based on 26,905 reports) 43.4%
Dark - Not Lighted
- Annapolis(Based on 162 reports) 29.6%
- Anne Arundel County(Based on 2,436 reports) 26.6%
- Maryland(Based on 26,905 reports) 27.6%
Dark - Lighted
- Annapolis(Based on 162 reports) 29.0%
- Anne Arundel County(Based on 2,436 reports) 28.7%
- Maryland(Based on 26,905 reports) 25.2%
Dusk
- Annapolis(Based on 162 reports) 1.9%
- Anne Arundel County(Based on 2,436 reports) 1.4%
- Maryland(Based on 26,905 reports) 1.6%
Other
- Annapolis(Based on 162 reports) 0.6%
- Anne Arundel County(Based on 2,436 reports) 0.1%
- Maryland(Based on 26,905 reports) 0.0%
Dawn
- Annapolis(Based on 162 reports) 0.6%
- Anne Arundel County(Based on 2,436 reports) 1.2%
- Maryland(Based on 26,905 reports) 1.4%
Clear
- Annapolis(Based on 162 reports) 87.0%
- Anne Arundel County(Based on 2,422 reports) 86.3%
- Maryland(Based on 26,827 reports) 86.0%
Rain
- Annapolis(Based on 162 reports) 8.0%
- Anne Arundel County(Based on 2,422 reports) 10.7%
- Maryland(Based on 26,827 reports) 10.0%
Unknown
- Annapolis(Based on 162 reports) 2.5%
- Anne Arundel County(Based on 2,422 reports) 1.4%
- Maryland(Based on 26,827 reports) 1.5%
Snow
- Annapolis(Based on 162 reports) 1.2%
- Anne Arundel County(Based on 2,422 reports) 0.7%
- Maryland(Based on 26,827 reports) 1.0%
Fog, Smog, Smoke
- Annapolis(Based on 162 reports) 1.2%
- Anne Arundel County(Based on 2,422 reports) 0.6%
- Maryland(Based on 26,827 reports) 0.8%

Annapolis fatal car crash and road traffic accident list for 2021
| # | Date | Location | Vehicles | Drunk persons | Fatalites | Persons | Pedestrians |
|---|
| 1 | May 25, 2021 04:45 PM | Mu-1165, Mu-2410 | 2 | - | 1
| 3 | - |
| 2 | Nov 18, 2021 05:35 PM | Mu-3220 | 2 | - | 1
| 2 | - |
Annapolis fatal car crash and road traffic accident list for 2020
| # | Date | Location | Vehicles | Drunk persons | Fatalites | Persons | Pedestrians |
|---|
| 1 | May 23, 2020 11:59 AM | Sr-450, Cr-2826 | 2 | - | 1
| 4 | - |
Annapolis fatal car crash and road traffic accident list for 2019
| # | Date | Location | Vehicles | Drunk persons | Fatalites | Persons | Pedestrians |
|---|
| 1 | Apr 22, 2019 08:00 AM | Sr-450 | 2 | - | 1
| 2 | - |
| 2 | Dec 3, 2019 06:23 PM | Sr-450 | 1 | 1
| 1 | 1 | 1 |
Annapolis fatal car crash and road traffic accident list for 2018
| # | Date | Location | Vehicles | Drunk persons | Fatalites | Persons | Pedestrians |
|---|
| 1 | Oct 11, 2018 09:09 AM | Sr-450 | 2 | - | 1
| 2 | - |
Annapolis fatal car crash and road traffic accident list for 2017
| # | Date | Location | Vehicles | Drunk persons | Fatalites | Persons | Pedestrians |
|---|
| 1 | Oct 1, 2017 10:32 PM | Sr-450 | 2 | - | 1
| 2 | - |
Annapolis fatal car crash and road traffic accident list for 2016
| # | Date | Location | Vehicles | Drunk persons | Fatalites | Persons | Pedestrians |
|---|
| 1 | Mar 21, 2016 10:39 PM | Mu-240, Mu-1155 | 1 | - | 1
| 2 | - |
Annapolis fatal car crash and road traffic accident list for 2015
| # | Date | Location | Vehicles | Drunk persons | Fatalites | Persons | Pedestrians |
|---|
| 1 | Dec 14, 2015 08:31 AM | Sr-70 | 1 | - | 1
| 1 | 1 |
Annapolis fatal car crash and road traffic accident list for 2014
| # | Date | Location | Vehicles | Drunk persons | Fatalites | Persons | Pedestrians |
|---|
| 1 | Jul 30, 2014 07:15 PM | Sr-450, Gibralter Ave | 3 | 1
| 1 | 3 | - |
| 2 | Oct 28, 2014 03:18 PM | Mu-960 | 2 | - | 1
| 2 | 1 |
Annapolis fatal car crash and road traffic accident list for 2013
| # | Date | Location | Vehicles | Drunk persons | Fatalites | Persons | Pedestrians |
|---|
| 1 | Jul 4, 2013 07:11 PM | Mu-110 | 1 | - | 1
| 5 | - |
Annapolis fatal car crash and road traffic accident list for 2010
| # | Date | Location | Vehicles | Drunk persons | Fatalites | Persons | Pedestrians |
|---|
| 1 | Jan 1, 2010 01:59 AM | Co-2930 | 1 | - | 1
| 3 | 1 |
| 2 | Jun 10, 2010 12:50 AM | Sr-450 | 1 | - | 1
| 1 | 1 |
Annapolis fatal car crash and road traffic accident list for 2008
| # | Date | Location | Vehicles | Drunk persons | Fatalites | Persons | Pedestrians |
|---|
| 1 | Jul 5, 2008 00:51 AM | Mu-2150, Ridgley Ave | 2 | - | 1
| 2 | - |
| 2 | Sep 4, 2008 09:56 AM | Co-2801 | 1 | - | 1
| 1 | - |
Annapolis fatal car crash and road traffic accident list for 2007
- Fatal accident count6
- Vehicles involved in fatal accidents7
- Fatal accidents involving drunk persons4
- Fatalities6
- Persons involved in fatal accidents15
- Pedestrians involved in fatal accidents5
Dark - Lighted
- Annapolis(Based on 6 reports) 50.0%
- Anne Arundel County(Based on 43 reports) 20.9%
- Maryland(Based on 557 reports) 25.7%
Daylight
- Annapolis(Based on 6 reports) 33.3%
- Anne Arundel County(Based on 43 reports) 51.2%
- Maryland(Based on 557 reports) 46.3%
Dark - Not Lighted
- Annapolis(Based on 6 reports) 16.7%
- Anne Arundel County(Based on 43 reports) 25.6%
- Maryland(Based on 557 reports) 23.2%
Clear
- Annapolis(Based on 6 reports) 83.3%
- Anne Arundel County(Based on 43 reports) 95.3%
- Maryland(Based on 558 reports) 89.8%
Rain
- Annapolis(Based on 6 reports) 16.7%
- Anne Arundel County(Based on 43 reports) 4.7%
- Maryland(Based on 558 reports) 7.0%
| # | Date | Location | Vehicles | Drunk persons | Fatalites | Persons | Pedestrians |
|---|
| 1 | May 3, 2007 00:48 AM | Co-3506, Sr-2 | 1 | 1
| 1 | 1 | - |
| 2 | May 31, 2007 09:48 PM | Sr-387 | 1 | - | 1
| 5 | 4 |
| 3 | Aug 18, 2007 06:26 PM | Co-4424, Op-4720 | 1 | - | 1
| 4 | 1 |
| 4 | Sep 2, 2007 06:03 PM | Sr-2 | 1 | 1
| 1 | 1 | - |
| 5 | Oct 9, 2007 10:48 PM | Mu-2250 | 1 | - | 1
| 1 | - |
| 6 | Nov 9, 2007 01:20 AM | Sr-450 | 2 | 2
| 1 | 3 | - |
Annapolis fatal car crash and road traffic accident list for 2006
- Fatal accident count6
- Vehicles involved in fatal accidents11
- Fatal accidents involving drunk persons2
- Fatalities7
- Persons involved in fatal accidents20
- Pedestrians involved in fatal accidents1
Daylight
- Annapolis(Based on 6 reports) 66.7%
- Anne Arundel County(Based on 59 reports) 54.2%
- Maryland(Based on 594 reports) 46.3%
Dark - Lighted
- Annapolis(Based on 6 reports) 33.3%
- Anne Arundel County(Based on 59 reports) 23.7%
- Maryland(Based on 594 reports) 23.4%
Clear
- Annapolis(Based on 6 reports) 100.0%
- Anne Arundel County(Based on 59 reports) 91.5%
- Maryland(Based on 594 reports) 90.6%
| # | Date | Location | Vehicles | Drunk persons | Fatalites | Persons | Pedestrians |
|---|
| 1 | May 12, 2006 08:22 AM | Co-22930, Madison St | 1 | - | 1
| 3 | 1 |
| 2 | Sep 24, 2006 01:04 AM | Sr-436, Co-2789 | 2 | 1
| 1 | 2 | - |
| 3 | Aug 20, 2006 08:36 PM | I-595 Ramp, Us-50 | 1 | - | 1
| 1 | - |
| 4 | Sep 29, 2006 02:39 PM | Sr-450, Parole St | 3 | - | 1
| 3 | - |
| 5 | Dec 5, 2006 03:27 PM | Mu-1500, Mu-1215 | 2 | - | 1
| 3 | - |
| 6 | Dec 30, 2006 05:26 AM | Co-2800, Co-2801 | 2 | 1
| 2 | 8 | - |
Annapolis fatal car crash and road traffic accident list for 2005
- Fatal accident count6
- Vehicles involved in fatal accidents8
- Fatal accidents involving drunk persons1
- Fatalities6
- Persons involved in fatal accidents14
- Pedestrians involved in fatal accidents3
Daylight
- Annapolis(Based on 6 reports) 50.0%
- Anne Arundel County(Based on 50 reports) 52.0%
- Maryland(Based on 577 reports) 45.1%
Dusk
- Annapolis(Based on 6 reports) 16.7%
- Anne Arundel County(Based on 50 reports) 8.0%
- Maryland(Based on 577 reports) 2.3%
Dark - Not Lighted
- Annapolis(Based on 6 reports) 16.7%
- Anne Arundel County(Based on 50 reports) 22.0%
- Maryland(Based on 577 reports) 25.1%
Dark - Lighted
- Annapolis(Based on 6 reports) 16.7%
- Anne Arundel County(Based on 50 reports) 18.0%
- Maryland(Based on 577 reports) 26.3%
Clear
- Annapolis(Based on 6 reports) 83.3%
- Anne Arundel County(Based on 50 reports) 86.0%
- Maryland(Based on 577 reports) 86.5%
Rain
- Annapolis(Based on 6 reports) 16.7%
- Anne Arundel County(Based on 50 reports) 14.0%
- Maryland(Based on 577 reports) 10.9%
| # | Date | Location | Vehicles | Drunk persons | Fatalites | Persons | Pedestrians |
|---|
| 1 | May 12, 2005 06:46 AM | Us-50, Sr-450 | 1 | - | 1
| 2 | - |
| 2 | Jun 25, 2005 00:13 AM | Mu-30, Mu-60 | 1 | - | 1
| 1 | 1 |
| 3 | Oct 22, 2005 04:58 PM | Co-5464, C0-2867 | 2 | - | 1
| 5 | - |
| 4 | Oct 1, 2005 08:00 PM | Sr-665, Sr-665c | 2 | 1
| 1 | 3 | 1 |
| 5 | Jan 27, 2005 03:12 PM | Co-5464, Mu-1460 | 1 | - | 1
| 2 | 1 |
| 6 | Nov 7, 2005 06:09 PM | Us-50, Whitehall Road | 1 | - | 1
| 1 | - |
Annapolis fatal car crash and road traffic accident list for 2001
- Fatal accident count4
- Vehicles involved in fatal accidents5
- Fatal accidents involving drunk persons3
- Fatalities4
- Persons involved in fatal accidents9
- Pedestrians involved in fatal accidents4
Daylight
- Annapolis(Based on 4 reports) 50.0%
- Anne Arundel County(Based on 45 reports) 31.1%
- Maryland(Based on 600 reports) 49.7%
Dark - Lighted
- Annapolis(Based on 4 reports) 25.0%
- Anne Arundel County(Based on 45 reports) 35.6%
- Maryland(Based on 600 reports) 25.3%
Dark - Not Lighted
- Annapolis(Based on 4 reports) 25.0%
- Anne Arundel County(Based on 45 reports) 33.3%
- Maryland(Based on 600 reports) 24.0%
Clear
- Annapolis(Based on 4 reports) 100.0%
- Anne Arundel County(Based on 45 reports) 88.9%
- Maryland(Based on 600 reports) 90.7%
| # | Date | Location | Vehicles | Drunk persons | Fatalites | Persons | Pedestrians |
|---|
| 1 | Feb 7, 2001 09:40 PM | Riva Rd | 1 | - | 1
| 3 | 1 |
| 2 | Mar 17, 2001 02:18 PM | Sr-648 | 1 | 1
| 1 | 2 | 1 |
| 3 | Jun 21, 2001 00:54 AM | Sr-665 | 2 | 2
| 1 | 2 | 1 |
| 4 | May 5, 2001 02:19 PM | Sr-436 | 1 | - | 1
| 2 | 1 |
Annapolis fatal car crash and road traffic accident list for 2000
| # | Date | Location | Vehicles | Drunk persons | Fatalites | Persons | Pedestrians |
|---|
| 1 | Apr 25, 2000 10:01 PM | Horsey Road | 2 | 1
| 1 | 3 | 1 |
| 2 | May 5, 2000 08:52 PM | Sr-2 | 2 | 1
| 1 | 4 | - |
Annapolis fatal car crash and road traffic accident list for 1999
| # | Date | Location | Vehicles | Drunk persons | Fatalites | Persons | Pedestrians |
|---|
| 1 | Apr 30, 1999 04:05 PM | Sr-450 | 2 | - | 1
| 3 | - |
Annapolis fatal car crash and road traffic accident list for 1997
| # | Date | Location | Vehicles | Drunk persons | Fatalites | Persons | Pedestrians |
|---|
| 1 | May 12, 1997 07:06 PM | Mu 240 | 2 | - | 1
| 3 | - |
| 2 | Jun 28, 1997 02:36 AM | Us50 | 1 | - | 1
| 2 | 1 |
| 3 | Jun 21, 1997 04:35 AM | Bay Ridge | 1 | 1
| 1 | 1 | - |
Annapolis fatal car crash and road traffic accident list for 1992
- Fatal accident count5
- Vehicles involved in fatal accidents6
- Fatalities6
- Persons involved in fatal accidents8
Average EMS response time
- Annapolis(Based on 5 reports) 7.4 mins
- Anne Arundel County(Based on 46 reports) 5.1 mins
- Maryland(Based on 522 reports) 8.8 mins
Daylight
- Annapolis(Based on 5 reports) 60.0%
- Anne Arundel County(Based on 51 reports) 54.9%
- Maryland(Based on 581 reports) 44.1%
Dark - Not Lighted
- Annapolis(Based on 5 reports) 40.0%
- Anne Arundel County(Based on 51 reports) 29.4%
- Maryland(Based on 581 reports) 27.5%
Clear
- Annapolis(Based on 5 reports) 60.0%
- Anne Arundel County(Based on 51 reports) 80.4%
- Maryland(Based on 584 reports) 83.2%
Snow
- Annapolis(Based on 5 reports) 20.0%
- Anne Arundel County(Based on 51 reports) 3.9%
- Maryland(Based on 584 reports) 2.6%
Rain
- Annapolis(Based on 5 reports) 20.0%
- Anne Arundel County(Based on 51 reports) 15.7%
- Maryland(Based on 584 reports) 13.5%
| # | Date | Location | Vehicles | Drunk persons | Fatalites | Persons | Pedestrians |
|---|
| 1 | Jan 25, 1992 11:03 PM | I68 | 2 | - | 1
| 3 | - |
| 2 | Mar 11, 1992 07:00 AM | 50 | 1 | - | 1
| 1 | - |
| 3 | Aug 6, 1992 03:55 PM | 3 | 1 | - | 2
| 2 | - |
| 4 | Aug 9, 1992 07:00 PM | 2449 | 1 | - | 1
| 1 | - |
| 5 | Nov 3, 1992 04:08 AM | I97 | 1 | - | 1
| 1 | - |
Annapolis fatal car crash and road traffic accident list for 1991
- Fatal accident count8
- Vehicles involved in fatal accidents12
- Fatal accidents involving drunk persons1
- Fatalities10
- Persons involved in fatal accidents21
- Pedestrians involved in fatal accidents6
Average EMS response time
- Annapolis(Based on 8 reports) 2.6 mins
- Anne Arundel County(Based on 45 reports) 4.7 mins
- Maryland(Based on 581 reports) 8.3 mins
Daylight
- Annapolis(Based on 8 reports) 50.0%
- Anne Arundel County(Based on 52 reports) 50.0%
- Maryland(Based on 625 reports) 46.6%
Dark - Not Lighted
- Annapolis(Based on 8 reports) 25.0%
- Anne Arundel County(Based on 52 reports) 30.8%
- Maryland(Based on 625 reports) 27.8%
Dark - Lighted
- Annapolis(Based on 8 reports) 25.0%
- Anne Arundel County(Based on 52 reports) 19.2%
- Maryland(Based on 625 reports) 24.3%
Clear
- Annapolis(Based on 8 reports) 87.5%
- Anne Arundel County(Based on 52 reports) 90.4%
- Maryland(Based on 629 reports) 87.8%
Rain
- Annapolis(Based on 8 reports) 12.5%
- Anne Arundel County(Based on 52 reports) 9.6%
- Maryland(Based on 629 reports) 11.0%
| # | Date | Location | Vehicles | Drunk persons | Fatalites | Persons | Pedestrians |
|---|
| 1 | Jun 21, 1991 12:26 AM | I68 | 1 | - | 1
| 2 | 1 |
| 2 | Aug 23, 1991 10:30 AM | 908c | 2 | - | 2
| 4 | - |
| 3 | Sep 17, 1991 09:35 AM | 50 | 3 | - | 2
| 5 | 2 |
| 4 | Sep 29, 1991 07:45 PM | 241 | 1 | - | 1
| 2 | 1 |
| 5 | Sep 21991 00:30 AM | | 1 | - | 1
| 1 | - |
| 6 | Oct 31, 1991 09:02 AM | 50 | 1 | - | 1
| 2 | 1 |
| 7 | Nov 20, 1991 08:40 PM | 2835 | 1 | - | 1
| 2 | 1 |
| 8 | Dec 24, 1991 01:06 AM | 50 | 2 | 1
| 1 | 3 | - |
Annapolis fatal car crash and road traffic accident list for 1990
- Fatal accident count5
- Vehicles involved in fatal accidents8
- Fatal accidents involving drunk persons2
- Fatalities6
- Persons involved in fatal accidents19
Daylight
- Annapolis(Based on 5 reports) 60.0%
- Anne Arundel County(Based on 59 reports) 40.7%
- Maryland(Based on 658 reports) 41.8%
Dark - Lighted
- Annapolis(Based on 5 reports) 40.0%
- Anne Arundel County(Based on 59 reports) 33.9%
- Maryland(Based on 658 reports) 22.0%
Clear
- Annapolis(Based on 5 reports) 100.0%
- Anne Arundel County(Based on 59 reports) 94.9%
- Maryland(Based on 661 reports) 87.9%
| # | Date | Location | Vehicles | Drunk persons | Fatalites | Persons | Pedestrians |
|---|
| 1 | Apr 21, 1990 04:11 PM | 450 | 2 | 1
| 1 | 4 | - |
| 2 | May 20, 1990 12:20 AM | 50 | 2 | - | 1
| 6 | - |
| 3 | Jun 17, 1990 01:33 AM | 68 | 1 | 1
| 2 | 2 | - |
| 4 | Jul 24, 1990 06:50 PM | 2836 | 2 | - | 1
| 5 | - |
| 5 | Aug 12, 1990 87:99 PM | 2836 | 1 | - | 1
| 2 | - |
Annapolis fatal car crash and road traffic accident list for 1989
- Fatal accident count5
- Vehicles involved in fatal accidents10
- Fatal accidents involving drunk persons1
- Fatalities5
- Persons involved in fatal accidents20
Average EMS response time
- Annapolis(Based on 5 reports) 3.2 mins
- Anne Arundel County(Based on 49 reports) 5.5 mins
- Maryland(Based on 564 reports) 8.1 mins
Dark - Not Lighted
- Annapolis(Based on 5 reports) 40.0%
- Anne Arundel County(Based on 54 reports) 38.9%
- Maryland(Based on 654 reports) 33.2%
Dark - Lighted
- Annapolis(Based on 5 reports) 40.0%
- Anne Arundel County(Based on 54 reports) 18.5%
- Maryland(Based on 654 reports) 21.7%
Daylight
- Annapolis(Based on 5 reports) 20.0%
- Anne Arundel County(Based on 54 reports) 40.7%
- Maryland(Based on 654 reports) 41.7%
Clear
- Annapolis(Based on 5 reports) 80.0%
- Anne Arundel County(Based on 54 reports) 90.7%
- Maryland(Based on 654 reports) 85.3%
Rain
- Annapolis(Based on 5 reports) 20.0%
- Anne Arundel County(Based on 54 reports) 9.3%
- Maryland(Based on 654 reports) 13.6%
| # | Date | Location | Vehicles | Drunk persons | Fatalites | Persons | Pedestrians |
|---|
| 1 | Mar 181989 01:33 AM | | 2 | - | 1
| 5 | - |
| 2 | Mar 31, 1989 00:15 AM | Md0450 | 1 | - | 1
| 2 | - |
| 3 | Sep 28, 1989 03:30 PM | 50 | 3 | - | 1
| 8 | - |
| 4 | Sep 22, 1989 00:48 AM | 2836 | 2 | - | 1
| 3 | - |
| 5 | Dec 28, 1989 07:00 PM | 665ul | 2 | 1
| 1 | 2 | - |
Annapolis fatal car crash and road traffic accident list for 1988
- Fatal accident count6
- Vehicles involved in fatal accidents7
- Fatal accidents involving drunk persons1
- Fatalities6
- Persons involved in fatal accidents14
Average EMS response time
- Annapolis(Based on 4 reports) 3.8 mins
- Anne Arundel County(Based on 40 reports) 5.7 mins
- Maryland(Based on 627 reports) 8.8 mins
Dark - Not Lighted
- Annapolis(Based on 6 reports) 83.3%
- Anne Arundel County(Based on 61 reports) 39.3%
- Maryland(Based on 709 reports) 31.9%
Daylight
- Annapolis(Based on 6 reports) 16.7%
- Anne Arundel County(Based on 61 reports) 37.7%
- Maryland(Based on 709 reports) 43.9%
Clear
- Annapolis(Based on 6 reports) 83.3%
- Anne Arundel County(Based on 61 reports) 85.2%
- Maryland(Based on 710 reports) 85.9%
Rain
- Annapolis(Based on 6 reports) 16.7%
- Anne Arundel County(Based on 61 reports) 14.8%
- Maryland(Based on 710 reports) 12.8%
| # | Date | Location | Vehicles | Drunk persons | Fatalites | Persons | Pedestrians |
|---|
| 1 | Apr 13, 1988 00:17 AM | Us0050 | 2 | 1
| 1 | 2 | - |
| 2 | Jul 10, 1988 00:50 AM | Mu1500 | 1 | - | 1
| 3 | - |
| 3 | Jul 2, 1988 11:38 PM | Md0070 | 1 | - | 1
| 4 | - |
| 4 | Aug 10, 1988 04:55 PM | Md0450 | 1 | - | 1
| 1 | - |
| 5 | Aug 12, 1988 09:05 PM | Md0450 | 1 | - | 1
| 2 | - |
| 6 | Dec 24, 1988 06:27 PM | Mu1500 | 1 | - | 1
| 2 | - |
Annapolis fatal car crash and road traffic accident list for 1987
- Fatal accident count7
- Vehicles involved in fatal accidents10
- Fatal accidents involving drunk persons5
- Fatalities7
- Persons involved in fatal accidents22
Average EMS response time
- Annapolis(Based on 5 reports) 7.2 mins
- Anne Arundel County(Based on 60 reports) 5.1 mins
- Maryland(Based on 640 reports) 8.6 mins
Dark - Lighted
- Annapolis(Based on 7 reports) 42.9%
- Anne Arundel County(Based on 73 reports) 49.3%
- Maryland(Based on 727 reports) 26.5%
Dark - Not Lighted
- Annapolis(Based on 7 reports) 42.9%
- Anne Arundel County(Based on 73 reports) 24.7%
- Maryland(Based on 727 reports) 28.3%
Daylight
- Annapolis(Based on 7 reports) 14.3%
- Anne Arundel County(Based on 73 reports) 24.7%
- Maryland(Based on 727 reports) 41.7%
Clear
- Annapolis(Based on 7 reports) 100.0%
- Anne Arundel County(Based on 74 reports) 87.8%
- Maryland(Based on 729 reports) 87.9%
| # | Date | Location | Vehicles | Drunk persons | Fatalites | Persons | Pedestrians |
|---|
| 1 | Feb 28, 1987 00:30 AM | Md0665 | 1 | 1
| 1 | 3 | - |
| 2 | Apr 13, 1987 02:29 AM | Mu1500 | 1 | 1
| 1 | 1 | - |
| 3 | May 30, 1987 01:37 AM | Co2519 | 1 | 1
| 1 | 2 | - |
| 4 | Jun 20, 1987 02:42 AM | Md0665 | 1 | 1
| 1 | 4 | - |
| 5 | Aug 20, 1987 06:46 PM | Co2986 | 1 | - | 1
| 2 | - |
| 6 | Sep 30, 1987 08:50 PM | Md0178 | 2 | 1
| 1 | 6 | - |
| 7 | Nov 18, 1987 09:23 PM | Md0450 | 3 | - | 1
| 4 | - |
Annapolis fatal car crash and road traffic accident list for 1986
- Fatal accident count6
- Vehicles involved in fatal accidents8
- Fatal accidents involving drunk persons3
- Fatalities6
- Persons involved in fatal accidents13
Average EMS response time
- Annapolis(Based on 5 reports) 4.8 mins
- Anne Arundel County(Based on 71 reports) 5.0 mins
- Maryland(Based on 665 reports) 8.3 mins
Daylight
- Annapolis(Based on 6 reports) 50.0%
- Anne Arundel County(Based on 82 reports) 43.9%
- Maryland(Based on 713 reports) 42.1%
Dark - Not Lighted
- Annapolis(Based on 6 reports) 33.3%
- Anne Arundel County(Based on 82 reports) 17.1%
- Maryland(Based on 713 reports) 29.3%
Dark - Lighted
- Annapolis(Based on 6 reports) 16.7%
- Anne Arundel County(Based on 82 reports) 39.0%
- Maryland(Based on 713 reports) 24.1%
Clear
- Annapolis(Based on 6 reports) 100.0%
- Anne Arundel County(Based on 82 reports) 92.7%
- Maryland(Based on 716 reports) 88.4%
| # | Date | Location | Vehicles | Drunk persons | Fatalites | Persons | Pedestrians |
|---|
| 1 | Mar 3, 1986 07:40 AM | Md0178 | 2 | - | 1
| 2 | - |
| 2 | Aug 19, 1986 02:23 PM | 0068 | 2 | - | 1
| 2 | - |
| 3 | Aug 8, 1986 05:49 PM | Co2521 | 1 | - | 1
| 2 | - |
| 4 | Sep 3, 1986 08:51 PM | Co0938 | 1 | 1
| 1 | 4 | - |
| 5 | Sep 18, 1986 03:13 AM | Co2931 | 1 | 1
| 1 | 2 | - |
| 6 | Oct 4, 1986 00:15 AM | Md0450 | 1 | 1
| 1 | 1 | - |
Annapolis fatal car crash and road traffic accident list for 1985
- Fatal accident count8
- Vehicles involved in fatal accidents11
- Fatal accidents involving drunk persons3
- Fatalities8
- Persons involved in fatal accidents15
Average EMS response time
- Annapolis(Based on 7 reports) 5.6 mins
- Anne Arundel County(Based on 56 reports) 4.9 mins
- Maryland(Based on 634 reports) 6.8 mins
Daylight
- Annapolis(Based on 8 reports) 37.5%
- Anne Arundel County(Based on 59 reports) 44.1%
- Maryland(Based on 654 reports) 43.4%
Dark - Not Lighted
- Annapolis(Based on 8 reports) 37.5%
- Anne Arundel County(Based on 59 reports) 30.5%
- Maryland(Based on 654 reports) 30.3%
Dark - Lighted
- Annapolis(Based on 8 reports) 25.0%
- Anne Arundel County(Based on 59 reports) 23.7%
- Maryland(Based on 654 reports) 22.9%
Clear
- Annapolis(Based on 8 reports) 100.0%
- Anne Arundel County(Based on 59 reports) 89.8%
- Maryland(Based on 656 reports) 83.2%
| # | Date | Location | Vehicles | Drunk persons | Fatalites | Persons | Pedestrians |
|---|
| 1 | Mar 2, 1985 04:27 PM | Co2420 | 1 | - | 1
| 1 | - |
| 2 | Mar 27, 1985 10:49 AM | Us0050 | 2 | - | 1
| 3 | - |
| 3 | May 1, 1985 04:28 PM | Md0665 | 2 | 1
| 1 | 2 | - |
| 4 | Jul 13, 1985 09:06 PM | Md0665 | 1 | - | 1
| 2 | - |
| 5 | Aug 11, 1985 09:40 PM | Us0050 | 1 | - | 1
| 2 | - |
| 6 | Oct 20, 1985 01:40 AM | Md0450 | 1 | 1
| 1 | 1 | - |
| 7 | Nov 13, 1985 11:25 PM | Md0178 | 2 | 1
| 1 | 2 | - |
| 8 | Jun 29, 1985 09:30 PM | Mu1500 | 1 | - | 1
| 2 | - |
Annapolis fatal car crash and road traffic accident list for 1984
- Fatal accident count7
- Vehicles involved in fatal accidents9
- Fatal accidents involving drunk persons5
- Fatalities8
- Persons involved in fatal accidents19
Average EMS response time
- Annapolis(Based on 6 reports) 6.7 mins
- Anne Arundel County(Based on 43 reports) 6.0 mins
- Maryland(Based on 551 reports) 7.4 mins
Dark - Not Lighted
- Annapolis(Based on 7 reports) 42.9%
- Anne Arundel County(Based on 54 reports) 38.9%
- Maryland(Based on 585 reports) 33.3%
Dark - Lighted
- Annapolis(Based on 7 reports) 28.6%
- Anne Arundel County(Based on 54 reports) 24.1%
- Maryland(Based on 585 reports) 25.3%
Dawn
- Annapolis(Based on 7 reports) 14.3%
- Anne Arundel County(Based on 54 reports) 5.6%
- Maryland(Based on 585 reports) 2.2%
Daylight
- Annapolis(Based on 7 reports) 14.3%
- Anne Arundel County(Based on 54 reports) 29.6%
- Maryland(Based on 585 reports) 36.6%
Clear
- Annapolis(Based on 7 reports) 100.0%
- Anne Arundel County(Based on 54 reports) 90.7%
- Maryland(Based on 588 reports) 85.9%
| # | Date | Location | Vehicles | Drunk persons | Fatalites | Persons | Pedestrians |
|---|
| 1 | Feb 26, 1984 02:48 AM | Co2749 | 1 | 1
| 1 | 1 | - |
| 2 | Feb 29, 1984 10:10 PM | Co2957 | 1 | 1
| 2 | 7 | - |
| 3 | Mar 18, 1984 02:25 AM | Md0002 | 2 | 2
| 1 | 3 | - |
| 4 | May 11, 1984 06:22 AM | Md0178 | 1 | - | 1
| 2 | - |
| 5 | Jul 2, 1984 02:05 PM | Us0050 | 1 | - | 1
| 2 | - |
| 6 | Oct 19, 1984 00:30 AM | Us0050 | 2 | 1
| 1 | 2 | - |
| 7 | Jul 28, 1984 09:40 PM | Md0648 | 1 | - | 1
| 2 | - |
Annapolis fatal car crash and road traffic accident list for 1983
- Fatal accident count4
- Vehicles involved in fatal accidents7
- Fatal accidents involving drunk persons2
- Fatalities4
- Persons involved in fatal accidents9
Daylight
- Annapolis(Based on 4 reports) 50.0%
- Anne Arundel County(Based on 65 reports) 36.9%
- Maryland(Based on 606 reports) 40.9%
Dark - Lighted
- Annapolis(Based on 4 reports) 25.0%
- Anne Arundel County(Based on 65 reports) 30.8%
- Maryland(Based on 606 reports) 27.7%
Dark - Not Lighted
- Annapolis(Based on 4 reports) 25.0%
- Anne Arundel County(Based on 65 reports) 29.2%
- Maryland(Based on 606 reports) 28.7%
Clear
- Annapolis(Based on 4 reports) 100.0%
- Anne Arundel County(Based on 65 reports) 87.7%
- Maryland(Based on 607 reports) 84.3%
| # | Date | Location | Vehicles | Drunk persons | Fatalites | Persons | Pedestrians |
|---|
| 1 | Apr 30, 1983 04:12 PM | Md0178 | 2 | 1
| 1 | 4 | - |
| 2 | Oct 17, 1983 07:08 PM | Md0665 | 2 | - | 1
| 2 | - |
| 3 | Oct 26, 1983 00:40 AM | C00143 | 1 | 1
| 1 | 1 | - |
| 4 | Oct 26, 1983 10:43 AM | Mu1500 | 2 | - | 1
| 2 | - |
Annapolis fatal car crash and road traffic accident list for 1982
- Fatal accident count12
- Vehicles involved in fatal accidents17
- Fatal accidents involving drunk persons7
- Fatalities12
- Persons involved in fatal accidents30
Dark - Not Lighted
- Annapolis(Based on 12 reports) 41.7%
- Anne Arundel County(Based on 67 reports) 32.8%
- Maryland(Based on 572 reports) 33.9%
Dark - Lighted
- Annapolis(Based on 12 reports) 41.7%
- Anne Arundel County(Based on 67 reports) 32.8%
- Maryland(Based on 572 reports) 27.1%
Daylight
- Annapolis(Based on 12 reports) 16.7%
- Anne Arundel County(Based on 67 reports) 31.3%
- Maryland(Based on 572 reports) 36.2%
Clear
- Annapolis(Based on 12 reports) 83.3%
- Anne Arundel County(Based on 67 reports) 82.1%
- Maryland(Based on 575 reports) 88.0%
Fog, Smog, Smoke
- Annapolis(Based on 12 reports) 8.3%
- Anne Arundel County(Based on 67 reports) 3.0%
- Maryland(Based on 575 reports) 1.7%
Rain
- Annapolis(Based on 12 reports) 8.3%
- Anne Arundel County(Based on 67 reports) 13.4%
- Maryland(Based on 575 reports) 9.6%
| # | Date | Location | Vehicles | Drunk persons | Fatalites | Persons | Pedestrians |
|---|
| 1 | Feb 27, 1982 11:54 PM | Md0178 | 2 | - | 1
| 6 | - |
| 2 | Apr 27, 1982 00:41 AM | Co2957 | 1 | 1
| 1 | 1 | - |
| 3 | Apr 8, 1982 08:38 PM | Md0181 | 1 | 1
| 1 | 2 | - |
| 4 | May 17, 1982 03:10 PM | Us0050 | 2 | - | 1
| 2 | - |
| 5 | May 22, 1982 11:26 PM | Co2795 | 1 | - | 1
| 2 | - |
| 6 | Jun 20, 1982 12:39 AM | Us0050 | 1 | - | 1
| 3 | - |
| 7 | Jun 29, 1982 01:47 AM | Us0050 | 1 | - | 1
| 2 | - |
| 8 | Jul 2, 1982 00:47 AM | Co2774 | 1 | 1
| 1 | 3 | - |
| 9 | Jul 29, 1982 10:35 PM | Us0050 | 2 | 1
| 1 | 2 | - |
| 10 | Aug 2, 1982 02:37 AM | Us0050tl | 2 | 1
| 1 | 3 | - |
| 11 | Aug 23, 1982 10:10 PM | Us0050 | 1 | 1
| 1 | 1 | - |
| 12 | Dec 23, 1982 07:05 PM | Md0178 | 2 | 1
| 1 | 3 | - |
Annapolis fatal car crash and road traffic accident list for 1981
- Fatal accident count9
- Vehicles involved in fatal accidents11
- Fatal accidents involving drunk persons4
- Fatalities11
- Persons involved in fatal accidents19
Dark - Lighted
- Annapolis(Based on 9 reports) 44.4%
- Anne Arundel County(Based on 63 reports) 39.7%
- Maryland(Based on 689 reports) 26.1%
Dark - Not Lighted
- Annapolis(Based on 9 reports) 33.3%
- Anne Arundel County(Based on 63 reports) 28.6%
- Maryland(Based on 689 reports) 35.8%
Daylight
- Annapolis(Based on 9 reports) 11.1%
- Anne Arundel County(Based on 63 reports) 30.2%
- Maryland(Based on 689 reports) 35.8%
Dusk
- Annapolis(Based on 9 reports) 11.1%
- Anne Arundel County(Based on 63 reports) 1.6%
- Maryland(Based on 689 reports) 1.5%
Clear
- Annapolis(Based on 9 reports) 88.9%
- Anne Arundel County(Based on 63 reports) 87.3%
- Maryland(Based on 691 reports) 88.1%
Rain
- Annapolis(Based on 9 reports) 11.1%
- Anne Arundel County(Based on 63 reports) 12.7%
- Maryland(Based on 691 reports) 9.1%
Annapolis fatal car crash and road traffic accident list for 1980
- Fatal accident count7
- Vehicles involved in fatal accidents11
- Fatal accidents involving drunk persons6
- Fatalities8
- Persons involved in fatal accidents19
Dark - Lighted
- Annapolis(Based on 7 reports) 42.9%
- Anne Arundel County(Based on 61 reports) 21.3%
- Maryland(Based on 680 reports) 21.8%
Daylight
- Annapolis(Based on 7 reports) 28.6%
- Anne Arundel County(Based on 61 reports) 37.7%
- Maryland(Based on 680 reports) 34.7%
Dark - Not Lighted
- Annapolis(Based on 7 reports) 28.6%
- Anne Arundel County(Based on 61 reports) 37.7%
- Maryland(Based on 680 reports) 40.3%
Clear
- Annapolis(Based on 7 reports) 100.0%
- Anne Arundel County(Based on 61 reports) 82.0%
- Maryland(Based on 682 reports) 83.1%
Annapolis fatal car crash and road traffic accident list for 1979
- Fatal accident count8
- Vehicles involved in fatal accidents11
- Fatal accidents involving drunk persons6
- Fatalities8
- Persons involved in fatal accidents16
Daylight
- Annapolis(Based on 8 reports) 37.5%
- Anne Arundel County(Based on 56 reports) 42.9%
- Maryland(Based on 597 reports) 39.0%
Dark - Lighted
- Annapolis(Based on 8 reports) 37.5%
- Anne Arundel County(Based on 56 reports) 30.4%
- Maryland(Based on 597 reports) 25.3%
Dark - Not Lighted
- Annapolis(Based on 8 reports) 25.0%
- Anne Arundel County(Based on 56 reports) 25.0%
- Maryland(Based on 597 reports) 32.8%
Clear
- Annapolis(Based on 8 reports) 75.0%
- Anne Arundel County(Based on 56 reports) 83.9%
- Maryland(Based on 605 reports) 84.6%
Snow
- Annapolis(Based on 8 reports) 12.5%
- Anne Arundel County(Based on 56 reports) 1.8%
- Maryland(Based on 605 reports) 1.3%
Rain
- Annapolis(Based on 8 reports) 12.5%
- Anne Arundel County(Based on 56 reports) 12.5%
- Maryland(Based on 605 reports) 10.7%
Annapolis fatal car crash and road traffic accident list for 1978
- Fatal accident count5
- Vehicles involved in fatal accidents8
- Fatal accidents involving drunk persons3
- Fatalities7
- Persons involved in fatal accidents13
Daylight
- Annapolis(Based on 5 reports) 60.0%
- Anne Arundel County(Based on 58 reports) 37.9%
- Maryland(Based on 638 reports) 36.2%
Dark - Lighted
- Annapolis(Based on 5 reports) 20.0%
- Anne Arundel County(Based on 58 reports) 32.8%
- Maryland(Based on 638 reports) 26.3%
Dark - Not Lighted
- Annapolis(Based on 5 reports) 20.0%
- Anne Arundel County(Based on 58 reports) 29.3%
- Maryland(Based on 638 reports) 34.8%
Clear
- Annapolis(Based on 5 reports) 100.0%
- Anne Arundel County(Based on 61 reports) 83.6%
- Maryland(Based on 644 reports) 88.4%
Annapolis fatal car crash and road traffic accident list for 1977
- Fatal accident count4
- Vehicles involved in fatal accidents5
- Fatalities4
- Persons involved in fatal accidents8
Average EMS response time
- Annapolis(Based on 2 reports) 4.5 mins
- Anne Arundel County(Based on 11 reports) 4.2 mins
- Maryland(Based on 95 reports) 4.4 mins
Daylight
- Annapolis(Based on 4 reports) 50.0%
- Anne Arundel County(Based on 58 reports) 41.4%
- Maryland(Based on 600 reports) 41.0%
Dark - Not Lighted
- Annapolis(Based on 4 reports) 50.0%
- Anne Arundel County(Based on 58 reports) 25.9%
- Maryland(Based on 600 reports) 33.8%
Clear
- Annapolis(Based on 4 reports) 100.0%
- Anne Arundel County(Based on 58 reports) 82.8%
- Maryland(Based on 601 reports) 86.5%
Annapolis fatal car crash and road traffic accident list for 1976
- Fatal accident count6
- Vehicles involved in fatal accidents8
- Fatalities6
- Persons involved in fatal accidents15
Average EMS response time
- Annapolis(Based on 6 reports) 36.3 mins
- Anne Arundel County(Based on 60 reports) 9.0 mins
- Maryland(Based on 544 reports) 6.8 mins
Dark - Not Lighted
- Annapolis(Based on 6 reports) 50.0%
- Anne Arundel County(Based on 64 reports) 43.8%
- Maryland(Based on 597 reports) 44.2%
Daylight
- Annapolis(Based on 6 reports) 33.3%
- Anne Arundel County(Based on 64 reports) 28.1%
- Maryland(Based on 597 reports) 35.8%
Dark - Lighted
- Annapolis(Based on 6 reports) 16.7%
- Anne Arundel County(Based on 64 reports) 18.8%
- Maryland(Based on 597 reports) 13.4%
Clear
- Annapolis(Based on 6 reports) 66.7%
- Anne Arundel County(Based on 64 reports) 78.1%
- Maryland(Based on 598 reports) 82.8%
Rain
- Annapolis(Based on 6 reports) 33.3%
- Anne Arundel County(Based on 64 reports) 21.9%
- Maryland(Based on 598 reports) 13.9%
Annapolis fatal car crash and road traffic accident list for 1975
- Fatal accident count6
- Vehicles involved in fatal accidents8
- Fatalities6
- Persons involved in fatal accidents15
Average EMS response time
- Annapolis(Based on 6 reports) 36.3 mins
- Anne Arundel County(Based on 60 reports) 9.0 mins
- Maryland(Based on 544 reports) 6.8 mins
Dark - Not Lighted
- Annapolis(Based on 6 reports) 50.0%
- Anne Arundel County(Based on 64 reports) 43.8%
- Maryland(Based on 597 reports) 44.2%
Daylight
- Annapolis(Based on 6 reports) 33.3%
- Anne Arundel County(Based on 64 reports) 28.1%
- Maryland(Based on 597 reports) 35.8%
Dark - Lighted
- Annapolis(Based on 6 reports) 16.7%
- Anne Arundel County(Based on 64 reports) 18.8%
- Maryland(Based on 597 reports) 13.4%
Clear
- Annapolis(Based on 6 reports) 66.7%
- Anne Arundel County(Based on 64 reports) 78.1%
- Maryland(Based on 598 reports) 82.8%
Rain
- Annapolis(Based on 6 reports) 33.3%
- Anne Arundel County(Based on 64 reports) 21.9%
- Maryland(Based on 598 reports) 13.9%