Estimated zip code population in 2022: 6,017 Zip code population in 2010: 6,032 Zip code population in 2000: 5,975
Houses and condos: 2,404 Renter-occupied apartments: 693
% of renters here:
32%
State:
44%
March 2022 cost of living index in zip code 95470: 98.9 (near average, U.S. average is 100)
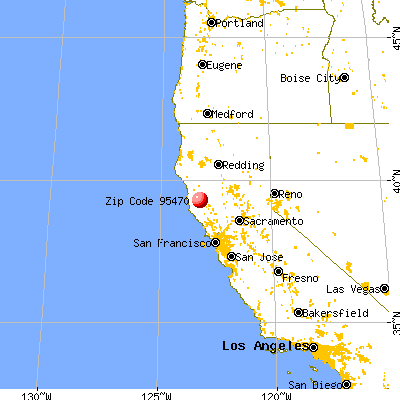
Land area: 82.5 sq. mi. Water area: 0.2 sq. mi.
Population density: 73 people per square mile
(very low).
OSM Map
General Map
Google Map
MSN Map
OSM Map
General Map
Google Map
MSN Map
OSM Map
General Map
Google Map
MSN Map
OSM Map
General Map
Google Map
MSN Map
Please wait while loading the map...
Real estate property taxes paid for housing units in 2022:
This zip code:
0.7% ($4,379)
California:
0.7% ($4,831)
Median real estate property taxes paid for housing units with mortgages in 2022: $5,551 (0.9%) Median real estate property taxes paid for housing units with no mortgage in 2022: $2,935 (0.5%)
Business Search- 14 Million verified businesses
Males: 3,293
(54.7%)
Females: 2,723
(45.3%)
For population 25 years and over in 95470:
High school or higher: 88.7%
Bachelor's degree or higher: 14.9%
Graduate or professional degree: 4.2%
Unemployed: 5.9%
Mean travel time to work (commute): 27.7 minutes
For population 15 years and over in 95470:
Never married: 33.6%
Now married: 47.6%
Separated: 1.4%
Widowed: 5.3%
Divorced: 12.1%
Zip code 95470 compared to state average:
Black race population percentage significantly below state average.
Foreign-born population percentage significantly below state average.
Length of stay since moving in significantly above state average.
House age below state average.
Percentage of population with a bachelor's degree or higher significantly below state average.
Averages for the 2020 tax year for zip code 95470, filed in 2021:
Average Adjusted Gross Income (AGI) in 2020: $64,939 (Individual Income Tax Returns)
Here:
$64,939
State:
$95,910
Salary/wage: $54,412 (reported on 74.6% of returns)
Here:
$54,412
State:
$77,331
(% of AGI for various income ranges: 1295.9% for AGIs below $25k, 3800.4% for AGIs $25k-50k, 6892.7% for AGIs $50k-75k, 10102.3% for AGIs $75k-100k, 19346.8% for AGIs $100k-200k, 71460.0% for AGIs over 200k)
Taxable interest for individuals: $1,517 (reported on 36.8% of returns)
This zip code:
$1,517
California:
$2,294
(% of AGI for various income ranges: 41.2% for AGIs below $25k, 34.0% for AGIs $25k-50k, 105.4% for AGIs $50k-75k, 147.7% for AGIs $75k-100k, 221.6% for AGIs $100k-200k, 1020.0% for AGIs over 200k)
Ordinary dividends: $5,013 (reported on 16.1% of returns)
Here:
$5,013
State:
$10,949
(% of AGI for various income ranges: 32.9% for AGIs below $25k, 61.1% for AGIs $25k-50k, 123.5% for AGIs $50k-75k, 156.9% for AGIs $75k-100k, 432.1% for AGIs $100k-200k, 1516.7% for AGIs over 200k)
Net capital gain/loss in AGI: +$15,944 (reported on 15.4% of returns)
Here:
+$15,944
State:
+$49,306
(% of AGI for various income ranges: 30.6% for AGIs below $25k, 55.7% for AGIs $25k-50k, 60.0% for AGIs $50k-75k, 440.8% for AGIs $75k-100k, 1001.1% for AGIs $100k-200k, 12690.0% for AGIs over 200k)
Profit/loss from business: +$21,005 (reported on 19.6% of returns)
Here:
+$21,005
State:
+$15,671
(% of AGI for various income ranges: 245.5% for AGIs below $25k, 460.9% for AGIs $25k-50k, 679.6% for AGIs $50k-75k, 734.6% for AGIs $75k-100k, 1289.5% for AGIs $100k-200k, 9876.7% for AGIs over 200k)
Taxable individual retirement arrangement distribution: $17,023 (reported on 7.9% of returns)
95470:
$17,023
California:
$23,505
(% of AGI for various income ranges: 42.2% for AGIs below $25k, 62.3% for AGIs $25k-50k, 173.8% for AGIs $50k-75k, 420.8% for AGIs $75k-100k, 1177.9% for AGIs $100k-200k)
Total itemized deductions: $30,469 (reported on 10.4% of returns)
Here:
$30,469
State:
$39,517
(% of AGI for various income ranges: 141.6% for AGIs below $25k, 222.3% for AGIs $25k-50k, 577.3% for AGIs $50k-75k, 619.2% for AGIs $75k-100k, 1659.5% for AGIs $100k-200k, 5366.7% for AGIs over 200k)
Charity contributions: $6,095 (reported on 6.8% of returns)
Here:
$6,095
State:
$12,598
(% of AGI for various income ranges: 6.9% for AGIs below $25k, 18.8% for AGIs $50k-75k, 19.2% for AGIs $75k-100k, 347.9% for AGIs $100k-200k, 1293.3% for AGIs over 200k)
Taxes paid: $8,041 (reported on 10.4% of returns)
95470:
$8,041
State:
$8,807
(% of AGI for various income ranges: 32.2% for AGIs below $25k, 40.2% for AGIs $25k-50k, 125.8% for AGIs $50k-75k, 202.3% for AGIs $75k-100k, 506.3% for AGIs $100k-200k, 1423.3% for AGIs over 200k)
Earned income credit: $2,030 (reported on 16.8% of returns)
Here:
$2,030
State:
$2,074
(% of AGI for various income ranges: 116.3% for AGIs below $25k, 76.8% for AGIs $25k-50k)
Percentage of individuals using paid preparers for their 2020 taxes: 92.5%
Here:
92%
State:
92%
(% for various income ranges: 89.8% for AGIs below $25k, 94.3% for AGIs $25k-50k, 95.3% for AGIs $50k-75k, 91.7% for AGIs $75k-100k, 92.9% for AGIs $100k-200k, 92.3% for AGIs over 200k)
Averages for the 2012 tax year for zip code 95470, filed in 2013:
Average Adjusted Gross Income (AGI) in 2012: $52,511 (Individual Income Tax Returns)
Here:
$52,511
State:
$72,726
Salary/wage: $42,932 (reported on 77.8% of returns)
Here:
$42,932
State:
$59,079
(% of AGI for various income ranges: 70.8% for AGIs below $25k, 72.7% for AGIs $25k-50k, 65.8% for AGIs $50k-75k, 62.2% for AGIs $75k-100k, 66.7% for AGIs $100k-200k, 39.9% for AGIs over 200k)
Taxable interest for individuals: $1,696 (reported on 39.7% of returns)
This zip code:
$1,696
California:
$2,146
(% of AGI for various income ranges: 2.4% for AGIs below $25k, 1.3% for AGIs $25k-50k, 1.5% for AGIs $50k-75k, 1.1% for AGIs $75k-100k, 0.9% for AGIs $100k-200k, 1.0% for AGIs over 200k)
Ordinary dividends: $5,309 (reported on 17.9% of returns)
Here:
$5,309
State:
$9,308
(% of AGI for various income ranges: 1.9% for AGIs below $25k, 1.3% for AGIs $25k-50k, 1.5% for AGIs $50k-75k, 2.0% for AGIs $75k-100k, 2.2% for AGIs $100k-200k, 1.8% for AGIs over 200k)
Net capital gain/loss in AGI: +$3,727 (reported on 14.4% of returns)
Here:
+$3,727
State:
+$30,460
(% of AGI for various income ranges: 3.7% for AGIs $100k-200k)
Profit/loss from business: +$16,815 (reported on 21.4% of returns)
Here:
+$16,815
State:
+$17,064
(% of AGI for various income ranges: 12.4% for AGIs below $25k, 8.6% for AGIs $25k-50k, 7.4% for AGIs $50k-75k, 8.1% for AGIs $75k-100k, 6.4% for AGIs $100k-200k)
Taxable individual retirement arrangement distribution: $13,662 (reported on 9.3% of returns)
95470:
$13,662
California:
$19,557
(% of AGI for various income ranges: 2.1% for AGIs below $25k, 2.6% for AGIs $25k-50k, 1.7% for AGIs $50k-75k, 4.0% for AGIs $75k-100k, 3.3% for AGIs $100k-200k)
Self-employment retirement plans: $18,250 (reported on 0.8% of returns)
95470:
$18,250
California:
$24,530
Total itemized deductions: $25,467 (27% of AGI, reported on 34.2% of returns)
Here:
$25,467
State:
$34,004
Here:
27.4% of AGI
State:
22.7% of AGI
(% of AGI for various income ranges: 15.7% for AGIs below $25k, 12.8% for AGIs $25k-50k, 15.8% for AGIs $50k-75k, 18.1% for AGIs $75k-100k, 17.5% for AGIs $100k-200k, 19.5% for AGIs over 200k)
Charity contributions: $2,627 (reported on 26.1% of returns)
Here:
$2,627
State:
$4,659
(% of AGI for various income ranges: 0.6% for AGIs below $25k, 0.8% for AGIs $25k-50k, 0.7% for AGIs $50k-75k, 1.3% for AGIs $75k-100k, 1.7% for AGIs $100k-200k, 2.2% for AGIs over 200k)
Taxes paid: $8,325 (reported on 34.2% of returns)
95470:
$8,325
State:
$14,448
(% of AGI for various income ranges: 3.5% for AGIs below $25k, 2.9% for AGIs $25k-50k, 4.4% for AGIs $50k-75k, 5.4% for AGIs $75k-100k, 6.9% for AGIs $100k-200k, 8.2% for AGIs over 200k)
Earned income credit: $2,023 (reported on 18.3% of returns)
Here:
$2,023
State:
$2,286
(% of AGI for various income ranges: 5.3% for AGIs below $25k, 1.1% for AGIs $25k-50k)
Percentage of individuals using paid preparers for their 2012 taxes: 65.4%
Here:
65%
State:
64%
(% for various income ranges: 59.0% for AGIs below $25k, 67.2% for AGIs $25k-50k, 68.6% for AGIs $50k-75k, 69.6% for AGIs $75k-100k, 73.3% for AGIs $100k-200k, 80.0% for AGIs over 200k)
Averages for the 2004 tax year for zip code 95470, filed in 2005:
Average Adjusted Gross Income (AGI) in 2004: $44,550 (Individual Income Tax Returns)
Here:
$44,550
State:
$58,600
Salary/wage: $37,019 (reported on 80.4% of returns)
Here:
$37,019
State:
$49,455
(% of AGI for various income ranges: 88.4% for AGIs below $10k, 70.1% for AGIs $10k-25k, 74.5% for AGIs $25k-50k, 72.8% for AGIs $50k-75k, 73.8% for AGIs $75k-100k, 51.1% for AGIs over 100k)
Taxable interest for individuals: $1,934 (reported on 51.5% of returns)
This zip code:
$1,934
California:
$2,365
(% of AGI for various income ranges: 7.3% for AGIs below $10k, 3.0% for AGIs $10k-25k, 2.0% for AGIs $25k-50k, 1.8% for AGIs $50k-75k, 1.8% for AGIs $75k-100k, 2.4% for AGIs over 100k)
Taxable dividends: $2,464 (reported on 21.9% of returns)
Here:
$2,464
State:
$4,746
(% of AGI for various income ranges: 3.7% for AGIs below $10k, 1.1% for AGIs $10k-25k, 1.5% for AGIs $25k-50k, 1.3% for AGIs $50k-75k, 0.9% for AGIs $75k-100k, 1.0% for AGIs over 100k)
Net capital gain/loss: +$16,819 (reported on 19.1% of returns)
Here:
+$16,819
State:
+$23,418
(% of AGI for various income ranges: -0.7% for AGIs below $10k, -0.5% for AGIs $10k-25k, 0.8% for AGIs $25k-50k, 1.6% for AGIs $50k-75k, 1.5% for AGIs $75k-100k, 21.5% for AGIs over 100k)
Profit/loss from business: +$15,288 (reported on 19.8% of returns)
Here:
+$15,288
State:
+$16,826
(% of AGI for various income ranges: 14.7% for AGIs below $10k, 7.2% for AGIs $10k-25k, 7.0% for AGIs $25k-50k, 8.5% for AGIs $50k-75k, 7.3% for AGIs $75k-100k, 4.5% for AGIs over 100k)
IRA payment deduction: $3,532 (reported on 3.0% of returns)
95470:
$3,532
California:
$3,192
Self-employed pension: $9,135 (reported on 1.4% of returns)
Here:
$9,135
California:
$17,688
Total itemized deductions: $22,021 (28% of AGI, reported on 36.0% of returns)
Here:
$22,021
State:
$28,113
Here:
28.3% of AGI
State:
25.3% of AGI
(% of AGI for various income ranges: 18.8% for AGIs below $10k, 17.5% for AGIs $10k-25k, 14.9% for AGIs $25k-50k, 19.2% for AGIs $50k-75k, 19.5% for AGIs $75k-100k, 17.9% for AGIs over 100k)
Charity contributions deductions: $2,452 (3% of AGI, reported on 30.0% of returns)
Here:
$2,452
State:
$3,923
Here:
3.0% of AGI
State:
3.3% of AGI
(% of AGI for various income ranges: 0.5% for AGIs below $10k, 0.9% for AGIs $10k-25k, 0.8% for AGIs $25k-50k, 1.6% for AGIs $50k-75k, 1.9% for AGIs $75k-100k, 2.4% for AGIs over 100k)
Total tax: $6,162 (reported on 75.5% of returns)
95470:
$6,162
State:
$10,761
(% of AGI for various income ranges: 3.4% for AGIs below $10k, 4.4% for AGIs $10k-25k, 7.1% for AGIs $25k-50k, 9.0% for AGIs $50k-75k, 10.6% for AGIs $75k-100k, 15.9% for AGIs over 100k)
Earned income credit: $1,571 (reported on 12.7% of returns)
Here:
$1,571
State:
$1,763
Percentage of individuals using paid preparers for their 2004 taxes: 63.5%
Here:
63%
State:
66%
(% for various income ranges: 50.3% for AGIs below $10k, 60.2% for AGIs $10k-25k, 67.0% for AGIs $25k-50k, 70.2% for AGIs $50k-75k, 68.0% for AGIs $75k-100k, 76.6% for AGIs over 100k)
Household received Food Stamps/SNAP in the past 12 months: 310 Household did not receive Food Stamps/SNAP in the past 12 months: 1,845
Women who had a birth in the past 12 months: 62 (55 now married, 6 unmarried) Women who did not have a birth in the past 12 months: 1,258 (556 now married, 700 unmarried)
Housing units in zip code 95470 with a mortgage: 901 (44 second mortgage, 40 both second mortgage and home equity loan) Median monthly owner costs for units with a mortgage: $2,034 Median monthly owner costs for units without a mortgage: $628
Residents with income below the poverty level in 2022:
This zip code:
27.3%
Whole state:
12.2%
Residents with income below 50% of the poverty level in 2022:
This zip code:
19.3%
Whole state:
6.2%
Median number of rooms in houses and condos:
Here:
5.6
State:
6.0
Median number of rooms in apartments:
Here:
4.7
State:
3.9
Notable locations in this zip code not listed on our city pages
Notable locations in zip code 95470: Fords Ranch (A), Mariposa Ranch (B), Johnson Ranch (C), Redwood Valley Calpella Fire District (D). Display/hide their locations on the map
Creeks: Cold Creek (A), Corral Creek (B), Fisher Creek (C), Forsythe Creek (D), Jack Smith Creek (E), Mariposa Creek (F), Mill Creek (G), Walker Creek (H), Long Branch Creek (I). Display/hide their locations on the map
In group quarters: 120 (-1 institutionalized population)
Size of family households: 443 2-persons, 374 3-persons, 440 4-persons, 144 5-persons, 13 7-or-more-persons
Size of nonfamily households: 634 1-person, 91 2-persons
701 married couples with children.
454 single-parent households (282 men, 172 women).
83.1% of residents of 95470 zip code speak English at home.
14.8% of residents speak Spanish at home (62% very well, 18% well, 14% not well, 6% not at all).
1.3% of residents speak other Indo-European language at home (17% very well, 28% well, 55% not well).
0.1% of residents speak other language at home (100% very well).
Foreign born population: 467 (7.8%) (47.6% of them are naturalized citizens)
This zip code:
7.8%
Whole state:
26.7%
96%Honduras
3%India
11%English
10%European
5%German
4%Portuguese
3%Norwegian
2%Scottish
2%Italian
Year of entry for the foreign-born population
1182010 or later
2222000 to 2009
631990 to 1999
70Before 1990
Housing units lacking complete plumbing facilities: 1.6% Housing units lacking complete kitchen facilities: 1.5%
31.8%Utility gas
26.8%Electricity
25.1%Wood
14.4%Bottled, tank, or LP gas
1.7%Other fuel
Population in 1990: 5,328. Population change in the 1990s: +647 (+12.1%).
Place of birth for U.S.-born residents:
This state: 4,449
Northeast: 112
Midwest: 284
South: 274
West: 410
65% of the 95470 zip code residents lived in the same house 5 years ago. Out of people who lived in different houses, 59% lived in this county. Out of people who lived in different counties, 50% lived in California.
99% of the 95470 zip code residents lived in the same house 1 year ago. Out of people who lived in different houses, 122% moved from this county. Out of people who lived in different houses, 5% moved from different county within same state.
Private vs. public school enrollment:
Students in private schools in grades 1 to 8 (elementary and middle school):
Here:
0.0%
California:
10.5%
Students in private schools in grades 9 to 12 (high school): 3
Here:
1.2%
California:
8.5%
Students in private undergraduate colleges: 2
Here:
0.9%
California:
15.9%
Occupation by median earnings in the past 12 months ($)
222,907Business and financial operations occupations
100,955Management occupations
75,835Healthcare support occupations
59,450Transportation occupations
53,709Community and social service occupations
45,652Health diagnosing and treating practitioners and other technical occupations
Companies with federal contracts located in this zip code:
BRANSON, DAVID E (601 LAUGHLIN WAY in REDWOOD VALLEY, CA; small business) : $31,364 in 6 contractsin 2004
Contracts for Facilities Operations Support Services by Army, U.S. Army Corps of Engineers - civil program financing only Signed by year:2000: $0; 2001: $0; 2002: $0; 2003: $0; 2004: $31,364; 2005: $0; 2006: $0.
Biggest contracts:
$20,400 with Army for Facilities Operations Support Services. Signed on 2004-05-12. Completion date: 2004-09-30.
$20,400 with U.S. Army Corps of Engineers - civil program financing only for Facilities Operations Support Services. Signed on 2004-05-12. Completion date: 2004-09-30.
$0 with Army for Facilities Operations Support Services. Signed on 2004-05-12. Completion date: 2004-09-30.
$0 with U.S. Army Corps of Engineers - civil program financing only for Facilities Operations Support Services. Signed on 2004-05-12. Completion date: 2004-09-30.
Top industries in this zip code by the number of employees in 2005:
Health Care and Social Assistance: Offices of Physicians (except Mental Health Specialists) (100-249 employees: 1 establishment, 1-4 employees: 1 establishment)
Arts, Entertainment, and Recreation: Casinos (except Casino Hotels) (100-249: 1)
Construction: Poured Concrete Foundation and Structure Contractors (50-99: 1, 10-19: 1)
Accommodation and Food Services: Full-Service Restaurants (20-49: 1, 5-9: 1)
Construction: New Single-Family Housing Construction (except Operative Builders) (10-19: 1, 5-9: 2, 1-4: 5)
Educational Services: Elementary and Secondary Schools (20-49: 1)
People in group quarters in 2010:
32 people in other noninstitutional facilities
16 people in workers' group living quarters and job corps centers
11 people in group homes intended for adults
9 people in residential treatment centers for adults
People in group quarters in 2000:
24 people in religious group quarters
19 people in other noninstitutional group quarters
17 people in homes for the mentally retarded
17 people in agriculture workers' dormitories on farms
6 people in other group homes
4 people in unknown juvenile institutions
3 people in homes or halfway houses for drug/alcohol abuse
Fatal accident statistics in 2014:
Fatal accident count: 2
Vehicles involved in fatal accidents: 2
Fatal accidents caused by drunken drivers: 1
Fatalities: 2
Persons involved in fatal accidents: 4
Pedestrians involved in fatal accidents: 0
Fatal accident statistics in 2013:
Fatal accident count: 1
Vehicles involved in fatal accidents: 1
Fatal accidents caused by drunken drivers: 0
Fatalities: 1
Persons involved in fatal accidents: 1
Pedestrians involved in fatal accidents: 0
2007 - 2018 National Fire Incident Reporting System (NFIRS) incidents
According to the data from the years 2007 - 2018 the average number of fires per year is 31. The highest number of reported fire incidents - 53 took place in 2009, and the least - 7 in 2016. The data has an increasing trend.
When looking into fire subcategories, the most incidents belonged to: Outside Fires (68.4%), and Structure Fires (17.6%).
Fire incident types reported to NFIRS in Zip Code 95470


 Nearest zip codes: 95482, 95490, 95469, 95493, 95427, 95415.


 : $31,364 in 6 contracts in 2004


 According to the data from the years 2007 - 2018 the average number of fires per year is 31. The highest number of reported fire incidents - 53 took place in 2009, and the least - 7 in 2016. The data has an increasing trend.
 When looking into fire subcategories, the most incidents belonged to: Outside Fires (68.4%), and Structure Fires (17.6%).