Estimated zip code population in 2022: 32,677 Zip code population in 2010: 26,823 Zip code population in 2000: 25,217
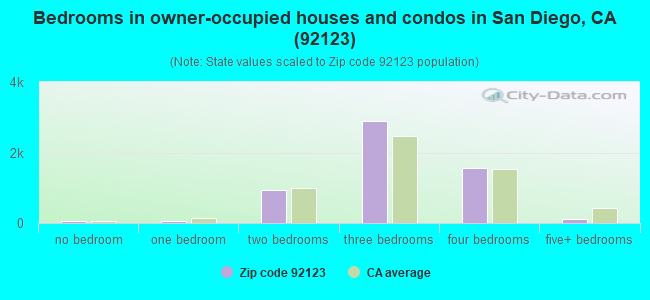
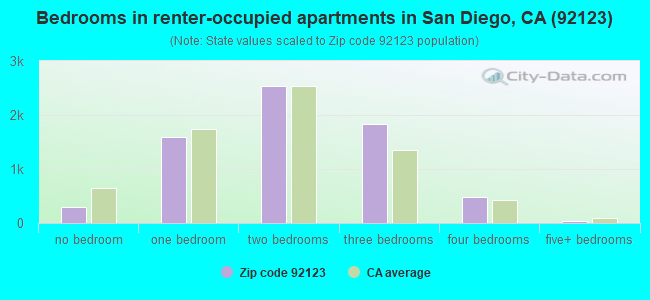
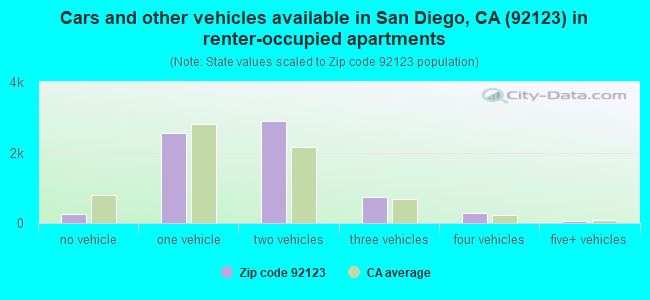
Houses and condos: 13,243 Renter-occupied apartments: 6,814
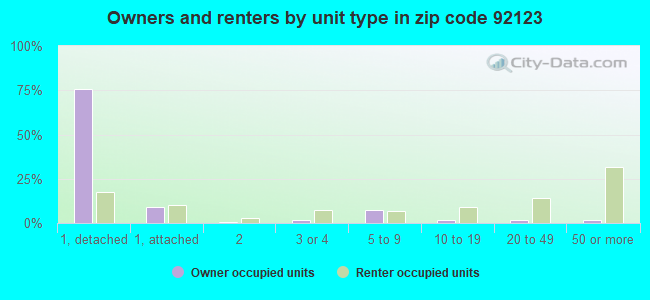
% of renters here:
55%
State:
44%
March 2022 cost of living index in zip code 92123: 123.1 (high, U.S. average is 100)
Land area: 8.2 sq. mi. Water area: 0.0 sq. mi.
Population density: 3,995 people per square mile
(average).
OSM Map
General Map
Google Map
MSN Map
OSM Map
General Map
Google Map
MSN Map
OSM Map
General Map
Google Map
MSN Map
OSM Map
General Map
Google Map
MSN Map
Please wait while loading the map...
Real estate property taxes paid for housing units in 2022:
This zip code:
0.6% ($5,002)
California:
0.7% ($4,831)
Median real estate property taxes paid for housing units with mortgages in 2022: $6,000 (0.7%) Median real estate property taxes paid for housing units with no mortgage in 2022: $2,072 (0.3%)
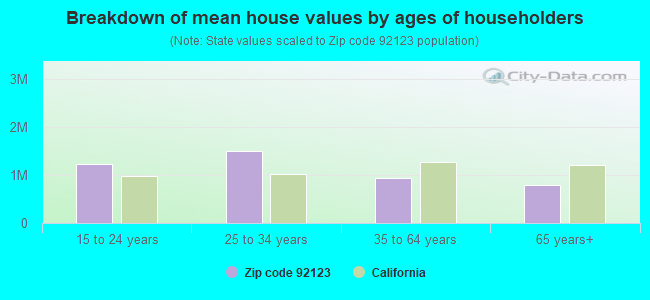
Estimated median house/condo value in 2022: $800,270
92123:
$800,270
California:
$715,900
According to our research of California and other state lists, there were 20 registered sex offenders living in 92123 zip code as of June 02, 2024. The ratio of all residents to sex offenders in zip code 92123 is 1,532 to 1. The ratio of registered sex offenders to all residents in this zip code is lower than the state average.
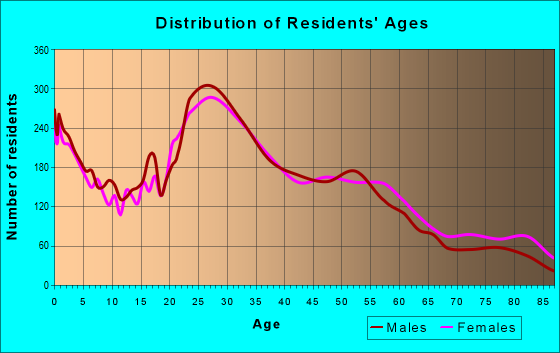
Median resident age:
This zip code:
36.1 years
California median age:
37.9 years
Average household size:
This zip code:
2.6 people
California:
2.8 people
Averages for the 2020 tax year for zip code 92123, filed in 2021:
Average Adjusted Gross Income (AGI) in 2020: $76,481 (Individual Income Tax Returns)
Here:
$76,481
State:
$95,910
Salary/wage: $69,921 (reported on 84.0% of returns)
Here:
$69,921
State:
$77,331
(% of AGI for various income ranges: 1160.4% for AGIs below $25k, 3830.5% for AGIs $25k-50k, 7052.3% for AGIs $50k-75k, 10530.7% for AGIs $75k-100k, 19778.1% for AGIs $100k-200k, 70538.6% for AGIs over 200k)
Taxable interest for individuals: $1,065 (reported on 35.0% of returns)
This zip code:
$1,065
California:
$2,294
(% of AGI for various income ranges: 15.3% for AGIs below $25k, 18.8% for AGIs $25k-50k, 31.0% for AGIs $50k-75k, 52.0% for AGIs $75k-100k, 115.8% for AGIs $100k-200k, 642.1% for AGIs over 200k)
Ordinary dividends: $3,879 (reported on 21.4% of returns)
Here:
$3,879
State:
$10,949
(% of AGI for various income ranges: 28.5% for AGIs below $25k, 32.7% for AGIs $25k-50k, 64.3% for AGIs $50k-75k, 124.3% for AGIs $75k-100k, 234.8% for AGIs $100k-200k, 1713.2% for AGIs over 200k)
Net capital gain/loss in AGI: +$10,837 (reported on 21.0% of returns)
Here:
+$10,837
State:
+$49,306
(% of AGI for various income ranges: 10.5% for AGIs below $25k, 35.1% for AGIs $25k-50k, 77.1% for AGIs $50k-75k, 165.5% for AGIs $75k-100k, 523.1% for AGIs $100k-200k, 7957.9% for AGIs over 200k)
Profit/loss from business: +$12,773 (reported on 15.5% of returns)
Here:
+$12,773
State:
+$15,671
(% of AGI for various income ranges: 121.3% for AGIs below $25k, 125.7% for AGIs $25k-50k, 188.4% for AGIs $50k-75k, 286.4% for AGIs $75k-100k, 511.4% for AGIs $100k-200k, 3209.6% for AGIs over 200k)
Taxable individual retirement arrangement distribution: $16,761 (reported on 6.3% of returns)
92123:
$16,761
California:
$23,505
(% of AGI for various income ranges: 39.7% for AGIs below $25k, 62.8% for AGIs $25k-50k, 128.0% for AGIs $50k-75k, 234.1% for AGIs $75k-100k, 394.5% for AGIs $100k-200k, 787.1% for AGIs over 200k)
Self-employed (Keogh) retirement plans: $19,311 (reported on 0.6% of returns)
92123:
$19,311
California:
$30,163
(% of AGI for various income ranges: 10.2% for AGIs below $25k, 33.9% for AGIs $100k-200k, 327.5% for AGIs over 200k)
Total itemized deductions: $29,009 (reported on 14.3% of returns)
Here:
$29,009
State:
$39,517
(% of AGI for various income ranges: 62.0% for AGIs below $25k, 126.1% for AGIs $25k-50k, 365.4% for AGIs $50k-75k, 781.4% for AGIs $75k-100k, 1698.3% for AGIs $100k-200k, 5594.3% for AGIs over 200k)
Charity contributions: $4,889 (reported on 11.0% of returns)
Here:
$4,889
State:
$12,598
(% of AGI for various income ranges: 2.3% for AGIs below $25k, 11.6% for AGIs $25k-50k, 38.1% for AGIs $50k-75k, 94.0% for AGIs $75k-100k, 229.8% for AGIs $100k-200k, 851.8% for AGIs over 200k)
Taxes paid: $8,553 (reported on 14.3% of returns)
92123:
$8,553
State:
$8,807
(% of AGI for various income ranges: 12.9% for AGIs below $25k, 28.9% for AGIs $25k-50k, 102.4% for AGIs $50k-75k, 243.7% for AGIs $75k-100k, 546.0% for AGIs $100k-200k, 1497.1% for AGIs over 200k)
Earned income credit: $1,833 (reported on 10.8% of returns)
Here:
$1,833
State:
$2,074
(% of AGI for various income ranges: 62.4% for AGIs below $25k, 52.5% for AGIs $25k-50k, 0.9% for AGIs $50k-75k)
Percentage of individuals using paid preparers for their 2020 taxes: 94.0%
Here:
94%
State:
92%
(% for various income ranges: 92.3% for AGIs below $25k, 94.4% for AGIs $25k-50k, 95.1% for AGIs $50k-75k, 94.2% for AGIs $75k-100k, 94.2% for AGIs $100k-200k, 95.4% for AGIs over 200k)
Averages for the 2012 tax year for zip code 92123, filed in 2013:
Average Adjusted Gross Income (AGI) in 2012: $63,931 (Individual Income Tax Returns)
Here:
$63,931
State:
$72,726
Salary/wage: $55,189 (reported on 84.6% of returns)
Here:
$55,189
State:
$59,079
(% of AGI for various income ranges: 76.8% for AGIs below $25k, 83.4% for AGIs $25k-50k, 79.5% for AGIs $50k-75k, 80.4% for AGIs $75k-100k, 82.7% for AGIs $100k-200k, 41.6% for AGIs over 200k)
Taxable interest for individuals: $1,173 (reported on 37.6% of returns)
This zip code:
$1,173
California:
$2,146
(% of AGI for various income ranges: 0.8% for AGIs below $25k, 0.5% for AGIs $25k-50k, 0.7% for AGIs $50k-75k, 0.4% for AGIs $75k-100k, 0.5% for AGIs $100k-200k, 1.3% for AGIs over 200k)
Ordinary dividends: $3,314 (reported on 19.2% of returns)
Here:
$3,314
State:
$9,308
(% of AGI for various income ranges: 1.3% for AGIs below $25k, 0.7% for AGIs $25k-50k, 1.2% for AGIs $50k-75k, 0.8% for AGIs $75k-100k, 1.0% for AGIs $100k-200k, 1.1% for AGIs over 200k)
Net capital gain/loss in AGI: +$8,579 (reported on 15.4% of returns)
Here:
+$8,579
State:
+$30,460
(% of AGI for various income ranges: 0.2% for AGIs $25k-50k, 0.2% for AGIs $50k-75k, 0.4% for AGIs $75k-100k, 0.7% for AGIs $100k-200k, 8.4% for AGIs over 200k)
Profit/loss from business: +$12,698 (reported on 13.9% of returns)
Here:
+$12,698
State:
+$17,064
(% of AGI for various income ranges: 8.0% for AGIs below $25k, 3.4% for AGIs $25k-50k, 2.6% for AGIs $50k-75k, 2.4% for AGIs $75k-100k, 2.2% for AGIs $100k-200k, 1.7% for AGIs over 200k)
Taxable individual retirement arrangement distribution: $13,107 (reported on 8.3% of returns)
92123:
$13,107
California:
$19,557
(% of AGI for various income ranges: 2.5% for AGIs below $25k, 1.6% for AGIs $25k-50k, 1.8% for AGIs $50k-75k, 1.9% for AGIs $75k-100k, 2.0% for AGIs $100k-200k, 1.0% for AGIs over 200k)
Self-employment retirement plans: $15,238 (reported on 0.6% of returns)
92123:
$15,238
California:
$24,530
(% of AGI for various income ranges: 0.2% for AGIs $50k-75k, 0.2% for AGIs $100k-200k, 0.3% for AGIs over 200k)
Total itemized deductions: $26,827 (23% of AGI, reported on 34.4% of returns)
Here:
$26,827
State:
$34,004
Here:
23.0% of AGI
State:
22.7% of AGI
(% of AGI for various income ranges: 11.4% for AGIs below $25k, 9.6% for AGIs $25k-50k, 12.8% for AGIs $50k-75k, 16.6% for AGIs $75k-100k, 16.8% for AGIs $100k-200k, 15.4% for AGIs over 200k)
Charity contributions: $2,961 (reported on 27.6% of returns)
Here:
$2,961
State:
$4,659
(% of AGI for various income ranges: 0.5% for AGIs below $25k, 0.8% for AGIs $25k-50k, 1.2% for AGIs $50k-75k, 1.6% for AGIs $75k-100k, 1.7% for AGIs $100k-200k, 1.1% for AGIs over 200k)
Taxes paid: $10,057 (reported on 34.1% of returns)
92123:
$10,057
State:
$14,448
(% of AGI for various income ranges: 2.3% for AGIs below $25k, 1.9% for AGIs $25k-50k, 3.5% for AGIs $50k-75k, 5.3% for AGIs $75k-100k, 6.6% for AGIs $100k-200k, 8.6% for AGIs over 200k)
Earned income credit: $1,956 (reported on 15.6% of returns)
Here:
$1,956
State:
$2,286
(% of AGI for various income ranges: 5.1% for AGIs below $25k, 1.0% for AGIs $25k-50k)
Percentage of individuals using paid preparers for their 2012 taxes: 51.0%
Here:
51%
State:
64%
(% for various income ranges: 46.1% for AGIs below $25k, 47.7% for AGIs $25k-50k, 52.9% for AGIs $50k-75k, 55.6% for AGIs $75k-100k, 59.1% for AGIs $100k-200k, 75.8% for AGIs over 200k)
Averages for the 2004 tax year for zip code 92123, filed in 2005:
Average Adjusted Gross Income (AGI) in 2004: $54,542 (Individual Income Tax Returns)
Here:
$54,542
State:
$58,600
Salary/wage: $45,786 (reported on 82.8% of returns)
Here:
$45,786
State:
$49,455
(% of AGI for various income ranges: 149.4% for AGIs below $10k, 76.1% for AGIs $10k-25k, 83.3% for AGIs $25k-50k, 79.0% for AGIs $50k-75k, 83.0% for AGIs $75k-100k, 51.6% for AGIs over 100k)
Taxable interest for individuals: $1,711 (reported on 49.7% of returns)
This zip code:
$1,711
California:
$2,365
(% of AGI for various income ranges: 10.4% for AGIs below $10k, 1.9% for AGIs $10k-25k, 1.0% for AGIs $25k-50k, 1.1% for AGIs $50k-75k, 1.0% for AGIs $75k-100k, 2.0% for AGIs over 100k)
Taxable dividends: $3,000 (reported on 23.3% of returns)
Here:
$3,000
State:
$4,746
(% of AGI for various income ranges: 5.4% for AGIs below $10k, 1.2% for AGIs $10k-25k, 0.7% for AGIs $25k-50k, 1.1% for AGIs $50k-75k, 0.6% for AGIs $75k-100k, 1.8% for AGIs over 100k)
Net capital gain/loss: +$11,169 (reported on 19.6% of returns)
Here:
+$11,169
State:
+$23,418
(% of AGI for various income ranges: -3.0% for AGIs below $10k, -0.4% for AGIs $10k-25k, 0.1% for AGIs $25k-50k, 0.6% for AGIs $50k-75k, 0.9% for AGIs $75k-100k, 9.4% for AGIs over 100k)
Profit/loss from business: +$11,768 (reported on 13.6% of returns)
Here:
+$11,768
State:
+$16,826
(% of AGI for various income ranges: 1.8% for AGIs below $10k, 5.6% for AGIs $10k-25k, 2.8% for AGIs $25k-50k, 3.2% for AGIs $50k-75k, 2.7% for AGIs $75k-100k, 2.5% for AGIs over 100k)
IRA payment deduction: $2,787 (reported on 2.8% of returns)
92123:
$2,787
California:
$3,192
(% of AGI for various income ranges: 0.6% for AGIs below $10k, 0.2% for AGIs $10k-25k, 0.2% for AGIs $25k-50k, 0.2% for AGIs $50k-75k, 0.1% for AGIs $75k-100k, 0.1% for AGIs over 100k)
Self-employed pension: $9,320 (reported on 1.1% of returns)
Here:
$9,320
California:
$17,688
(% of AGI for various income ranges: 0.1% for AGIs $10k-25k, 0.1% for AGIs $25k-50k, 0.2% for AGIs $50k-75k, 0.2% for AGIs $75k-100k, 0.2% for AGIs over 100k)
Total itemized deductions: $26,425 (27% of AGI, reported on 36.3% of returns)
Here:
$26,425
State:
$28,113
Here:
26.5% of AGI
State:
25.3% of AGI
(% of AGI for various income ranges: 48.7% for AGIs below $10k, 11.6% for AGIs $10k-25k, 12.1% for AGIs $25k-50k, 16.6% for AGIs $50k-75k, 20.1% for AGIs $75k-100k, 20.4% for AGIs over 100k)
Charity contributions deductions: $4,116 (4% of AGI, reported on 31.0% of returns)
Here:
$4,116
State:
$3,923
Here:
3.8% of AGI
State:
3.3% of AGI
(% of AGI for various income ranges: 1.1% for AGIs below $10k, 0.8% for AGIs $10k-25k, 1.3% for AGIs $25k-50k, 1.6% for AGIs $50k-75k, 2.0% for AGIs $75k-100k, 3.6% for AGIs over 100k)
Total tax: $8,609 (reported on 80.7% of returns)
92123:
$8,609
State:
$10,761
(% of AGI for various income ranges: 5.2% for AGIs below $10k, 4.6% for AGIs $10k-25k, 7.6% for AGIs $25k-50k, 10.1% for AGIs $50k-75k, 10.9% for AGIs $75k-100k, 18.6% for AGIs over 100k)
Earned income credit: $1,514 (reported on 11.3% of returns)
Here:
$1,514
State:
$1,763
Percentage of individuals using paid preparers for their 2004 taxes: 56.5%
Here:
57%
State:
66%
(% for various income ranges: 45.8% for AGIs below $10k, 55.6% for AGIs $10k-25k, 56.0% for AGIs $25k-50k, 58.4% for AGIs $50k-75k, 62.0% for AGIs $75k-100k, 68.2% for AGIs over 100k)
Likely homosexual households (counted as self-reported same-sex unmarried-partner households)
Lesbian couples: 0.3% of all households
Gay men: 0.8% of all households
Household received Food Stamps/SNAP in the past 12 months: 1,166 Household did not receive Food Stamps/SNAP in the past 12 months: 11,182
Women who had a birth in the past 12 months: 463 (369 now married, 93 unmarried) Women who did not have a birth in the past 12 months: 8,053 (3,538 now married, 4,499 unmarried)
Housing units in zip code 92123 with a mortgage: 3,861 (183 second mortgage, 184 both second mortgage and home equity loan) Houses without a mortgage: 65
Median monthly owner costs for units with a mortgage: $2,723 Median monthly owner costs for units without a mortgage: $569
Residents with income below the poverty level in 2022:
This zip code:
10.3%
Whole state:
12.2%
Residents with income below 50% of the poverty level in 2022:
This zip code:
3.9%
Whole state:
6.2%
Median number of rooms in houses and condos:
Here:
5.8
State:
6.0
Median number of rooms in apartments:
Here:
4.1
State:
3.9
Notable locations in this zip code not listed on our city pages
Notable locations in zip code 92123: Serra Mesa Branch San Diego Public Library (A), Rural / Metro Ambulance (B), Pacific Ambulance (C), San Diego Fire - Rescue Department Helibase (D), Serra Cooperative Library System Administration Building (E), San Diego Fire - Rescue Department Station 28 (F). Display/hide their locations on the map
Shopping Centers: Serra Mesa Shopping Center (1), Mission Village Shopping Center (2), Kearny Villa Square Shopping Center (3). Display/hide their locations on the map
Churches in zip code 92123 include: Holy Angels Byzantine Catholic Church (A), Korean Full Gospel Church (B), Mission Village Southern Church (C), Saint Columba Catholic Church (D), Gethsemane Lutheran Church (E), Trinity Korean Presbyterian Church (F), Serra Mesa Christian Fellowship (G), Seedtime and Harvest Church (H), San Diego First Assembly Church (I). Display/hide their locations on the map
Parks in zip code 92123 include: Cabrillo Heights Park (1), Serra Mesa Park (2), Serra Mesa Recreation Center (3), Celestine Park (4), Missile Park (5). Display/hide their locations on the map
Tourist attraction (not listed on the city page) : Catalina Airlines Island Hopper (3760 Glen Curtiss Road).
3,564 married couples with children.
1,728 single-parent households (457 men, 1,271 women).
69.4% of residents of 92123 zip code speak English at home.
11.3% of residents speak Spanish at home (80% very well, 9% well, 5% not well, 5% not at all).
4.1% of residents speak other Indo-European language at home (86% very well, 13% well).
12.7% of residents speak Asian or Pacific Island language at home (65% very well, 26% well, 7% not well, 1% not at all).
2.1% of residents speak other language at home (70% very well, 16% well, 13% not well).
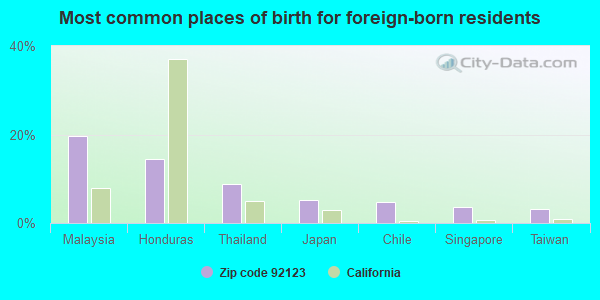
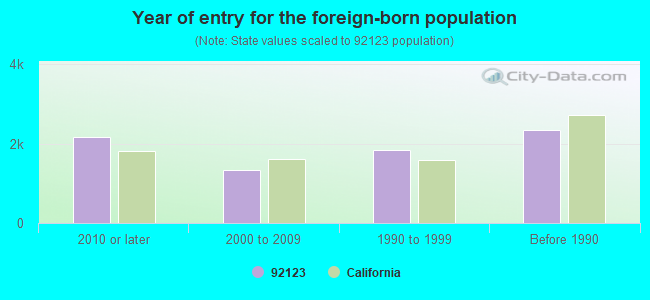
Foreign born population: 6,907 (21.1%) (70.5% of them are naturalized citizens)
Major facilities with environmental interests located in this zip code:
KYOCERA AMERICA (8611 BALBOA AVE in SAN DIEGO, CA)
AIR MAJOR (AIRS/AFS) STATE MASTER (California - Hazardous Waste Tracking) - HAZARDOU WASTE PROGRAM (Integrated Compliance Information System) - ICIS-09-2000-0251, FORMAL ENFORCEMENT ACTION, ICIS-09-1993-0030, COMPLIANCE ACTIVITY (Tracking inspections of insecticide, fungicide, and rodenticide, and toxic substances) CRITERIA AND HAZARDOUS AIR POLLUTANT INVENTORY (Inventory of air pollution sources) National Pollutant Discharge Elimination System NON-MAJOR (Tracking pollutant discharge elimination systems) - permit HAZARDOUS WASTE BIENNIAL REPORTER (Resource Conservation and Recovery Act (tracking hazardous waste)) Large Quantity Generators, more that 1000 kg of hazardous waste/month (Resource Conservation and Recovery Act (tracking hazardous waste)) TRI REPORTER (Tracking of toxic chemicals releasing facilities) Business SIC classification: METAL STAMPINGS; ELECTROPLATING, PLATING, POLISHING, ANODIZING, AND COLORING; SEMICONDUCTORS AND RELATED DEVICES; ELECTRIC SERVICES; ELECTRIC AND OTHER SERVICES COMBINED Business NAICS classification: SEMICONDUCTOR AND RELATED DEVICE MANUFACTURING.; SEMICONDUCTOR AND RELATED DEVICE MANUFACTURING. Organizations: KYOCERA AMERICA, INC. (CONTACT/OPERATOR)
Alternative names: BONNEVILLE PACIFIC CORP, KYOCERA INTERNATIONAL INC
GENERAL DYNAMICS CORPORATION CONVAIR DIVISION (5001 KEARNY VILLA ROAD in SAN DIEGO, CA)
STATE MASTER (California - Hazardous Waste Tracking) - HAZARDOU WASTE PROGRAM Small Quantity Generators, between 100 kg and 1000 kg of hazardous waste/month (Resource Conservation and Recovery Act (tracking hazardous waste)) HAZARDOUS WASTE BIENNIAL REPORTER (Resource Conservation and Recovery Act (tracking hazardous waste)) Large Quantity Generators, more that 1000 kg of hazardous waste/month (Resource Conservation and Recovery Act (tracking hazardous waste)) TRI REPORTER (Tracking of toxic chemicals releasing facilities) Business SIC classification: AIRCRAFT PARTS AND AUXILIARY EQUIPMENT; GUIDED MISSILES AND SPACE VEHICLES Organizations: LENNAR PARTNERS, INC. (CONTACT/OPERATOR)
Alternative names: GENERAL DYNAMICS CORP KM SITE, GENERAL DYNAMICS CORP REAL ESTATE, GENERAL DYNAMICS CONVAIR DIVISION, LOCKHEED MARTIN ASTRONAUTICS
CASPIAN INCORPORATED (4951 RUFFIN RD. in SAN DIEGO, CA)
SUPERFUND (Superfund database) STATE MASTER (California - Hazardous Waste Tracking) - HAZARDOU WASTE PROGRAM CRITERIA AND HAZARDOUS AIR POLLUTANT INVENTORY (Inventory of air pollution sources) HAZARDOUS WASTE BIENNIAL REPORTER (Resource Conservation and Recovery Act (tracking hazardous waste)) Large Quantity Generators, more that 1000 kg of hazardous waste/month (Resource Conservation and Recovery Act (tracking hazardous waste)) - notification TRI REPORTER (Tracking of toxic chemicals releasing facilities) Business SIC classification: COATING, ENGRAVING, AND ALLIED SERVICES; AIRCRAFT PARTS AND AUXILIARY EQUIPMENT Business NAICS classification: ALL OTHER MISCELLANEOUS FABRICATED METAL PRODUCT MANUFACTURING. Organizations: CYRUS A. JAFFARI (CONTACT/OPERATOR)
, ELKHORN RANCH INC. (CONTACT/OWNER)
MAXWELL LABORATORIES INCORPORATED (9244 BALBOA AVENUE in SAN DIEGO, CA)
STATE MASTER (California - Hazardous Waste Tracking) - HAZARDOU WASTE PROGRAM CRITERIA AND HAZARDOUS AIR POLLUTANT INVENTORY (Inventory of air pollution sources) Large Quantity Generators, more that 1000 kg of hazardous waste/month (Resource Conservation and Recovery Act (tracking hazardous waste)) (Resource Conservation and Recovery Act (tracking hazardous waste)) Business SIC classification: RADIO AND TELEVISION BROADCASTING AND COMMUNICATIONS EQUIPMENT Business NAICS classification: ELECTRONIC CAPACITOR MANUFACTURING. Organizations: MAXWELL TECHNOLOGIES, INC. (CONTACT/OPERATOR)
, BALBOA BOULEVARD BUILDING, LLC (CONTACT/OWNER)
Alternative names: MAXWELL ELECTRONIC COMPONENT G, MAXWELL ELECTRONIC COMPONENTS GROUP INC, MAXWELL LABS LASER LAB
MOORE PRINTED CIRCUITS INCORPORATED (8575 AERO DRIVE in SAN DIEGO, CA)
(Integrated Compliance Information System) - ICIS-09-1998-0093, FORMAL ENFORCEMENT ACTION COMPLIANCE ACTIVITY (Tracking inspections of insecticide, fungicide, and rodenticide, and toxic substances) HAZARDOUS WASTE BIENNIAL REPORTER (Resource Conservation and Recovery Act (tracking hazardous waste)) Large Quantity Generators, more that 1000 kg of hazardous waste/month (Resource Conservation and Recovery Act (tracking hazardous waste)) TRI REPORTER (Tracking of toxic chemicals releasing facilities) Business SIC classification: PRINTED CIRCUIT BOARDS Organizations: JOE H MOORE (CONTACT/OWNER)
Alternative names: 8575 AERO DR, MOORE ELECTRO ASSEMBLY, INC
EQUILON ENTERPRISES (2777 HEALTH CENTER in SAN DIEGO, CA) . Federal Facility
STATE MASTER (California - Hazardous Waste Tracking) - HAZARDOU WASTE PROGRAM CRITERIA AND HAZARDOUS AIR POLLUTANT INVENTORY (Inventory of air pollution sources) Large Quantity Generators, more that 1000 kg of hazardous waste/month (Resource Conservation and Recovery Act (tracking hazardous waste)) Business SIC classification: GASOLINE SERVICE STATIONS Organizations: SHELL OIL PRODUCTS US (CONTACT/OPERATOR)
, EQUILON ENTERPRISES LLC DBA SHELL OIL PR (CONTACT/OWNER)
Alternative names: TEXACO / HEALTH CENTER DR, TEXACO SERVICE STATION
L3 COMMUNICATIONS TELEMETRY WEST (9020 BALBOA AVE in SAN DIEGO, CA)
STATE MASTER (California - Hazardous Waste Tracking) - HAZARDOU WASTE PROGRAM CRITERIA AND HAZARDOUS AIR POLLUTANT INVENTORY (Inventory of air pollution sources) Small Quantity Generators, between 100 kg and 1000 kg of hazardous waste/month (Resource Conservation and Recovery Act (tracking hazardous waste)) - notification TRI REPORTER (Tracking of toxic chemicals releasing facilities) Business SIC classification: COATING, ENGRAVING, AND ALLIED SERVICES; RADIO AND TELEVISION BROADCASTING AND COMMUNICATIONS EQUIPMENT Organizations: BURT SMITH DIV PRES (CONTACT/OPERATOR)
, L 3 COMMUNICATIONS (CONTACT/OWNER)
Alternative names: L 3 COMMUNICATIONS CONIC DIV, L 3 COMMUNICATIONS TELEMETRY WEST
EL DORADO SANBLASTING CO (2694 COMMERCIAL ST in SAN DIEGO, CA)
STATE MASTER (California - Hazardous Waste Tracking) - HAZARDOU WASTE PROGRAM CRITERIA AND HAZARDOUS AIR POLLUTANT INVENTORY (Inventory of air pollution sources) Small Quantity Generators, between 100 kg and 1000 kg of hazardous waste/month (Resource Conservation and Recovery Act (tracking hazardous waste)) - notification Business SIC classification: PAINTING AND PAPER HANGING Organizations: YVONNE & KEVIN REESE (CONTACT/OWNER)
Alternative names: EL DORADO COATINGS INC DBA EL DORADO SAN
JET PRODUCTS CORPORATION (9106 BALBOA AVE in SAN DIEGO, CA)
STATE MASTER (California - Hazardous Waste Tracking) - HAZARDOU WASTE PROGRAM Large Quantity Generators, more that 1000 kg of hazardous waste/month (Resource Conservation and Recovery Act (tracking hazardous waste)) Business NAICS classification: OTHER COMMERCIAL AND SERVICE INDUSTRY MACHINERY MANUFACTURING.; AIRCRAFT ENGINE AND ENGINE PARTS MANUFACTURING. Alternative names: SENIOR AEROSPACE-JET PRODUCT DIVISION
FAST RADIATOR WAREHOUSE (9520 CHESAPEAKE DR NO 606 in SAN DIEGO, CA)
STATE MASTER (California - Hazardous Waste Tracking) - HAZARDOU WASTE PROGRAM Small Quantity Generators, between 100 kg and 1000 kg of hazardous waste/month (Resource Conservation and Recovery Act (tracking hazardous waste)) - notification Business NAICS classification: PRINTING MACHINERY AND EQUIPMENT MANUFACTURING.
MAACO AUTO PAINTING (5670 KEARNEY VILLA RD in SAN DIEGO, CA)
STATE MASTER (California - Hazardous Waste Tracking) - HAZARDOU WASTE PROGRAM Small Quantity Generators, between 100 kg and 1000 kg of hazardous waste/month (Resource Conservation and Recovery Act (tracking hazardous waste)) - notification Alternative names: MAACO AUTO PAINTING BODYWORKS
CHEVRON STATION NO 95442 (3222 MISSION VILLAGE DR in SAN DIEGO, CA)
STATE MASTER (California - Hazardous Waste Tracking) - HAZARDOU WASTE PROGRAM CRITERIA AND HAZARDOUS AIR POLLUTANT INVENTORY (Inventory of air pollution sources) Small Quantity Generators, between 100 kg and 1000 kg of hazardous waste/month (Resource Conservation and Recovery Act (tracking hazardous waste)) - notification Business SIC classification: GASOLINE SERVICE STATIONS Organizations: CHEVRON PRODUCTS CO (CONTACT/OWNER)
NATIONAL AIR COLLEGE (3760 GLEN L CURTIS RD in SAN DIEGO, CA)
STATE MASTER (California - Hazardous Waste Tracking) - HAZARDOU WASTE PROGRAM Small Quantity Generators, between 100 kg and 1000 kg of hazardous waste/month (Resource Conservation and Recovery Act (tracking hazardous waste)) - notification Business NAICS classification: OTHER TECHNICAL AND TRADE SCHOOLS.
Housing units lacking complete plumbing facilities: 0.3% Housing units lacking complete kitchen facilities: 0.4%
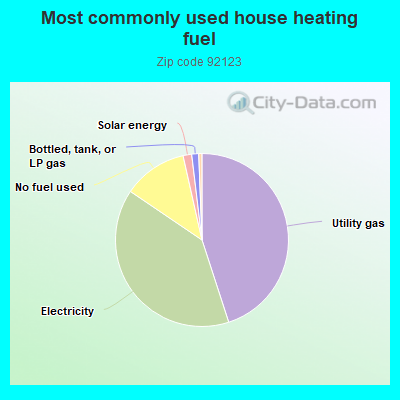
45.0%Utility gas
39.5%Electricity
12.0%No fuel used
1.6%Solar energy
1.3%Bottled, tank, or LP gas
Population in 1990: 23,541. Population change in the 1990s: +1,676 (+7.1%).
Place of birth for U.S.-born residents:
This state: 15,797
Northeast: 2,067
Midwest: 2,638
South: 2,404
West: 1,931
42% of the 92123 zip code residents lived in the same house 5 years ago. Out of people who lived in different houses, 63% lived in this county. Out of people who lived in different counties, 50% lived in California.
85% of the 92123 zip code residents lived in the same house 1 year ago. Out of people who lived in different houses, 57% moved from this county. Out of people who lived in different houses, 8% moved from different county within same state. Out of people who lived in different houses, 27% moved from different state. Out of people who lived in different houses, 7% moved from abroad.
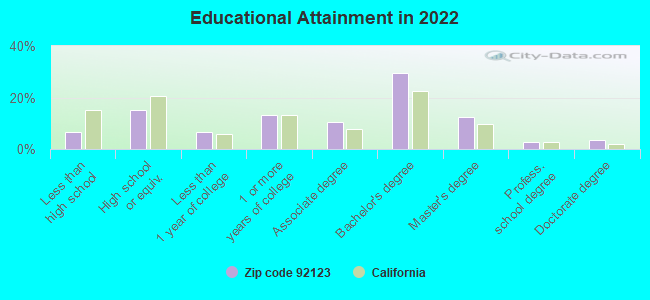
Private vs. public school enrollment:
Students in private schools in grades 1 to 8 (elementary and middle school): 366
Here:
16.2%
California:
10.5%
Students in private schools in grades 9 to 12 (high school): 121
Here:
9.6%
California:
8.5%
Students in private undergraduate colleges: 553
Here:
24.5%
California:
15.9%
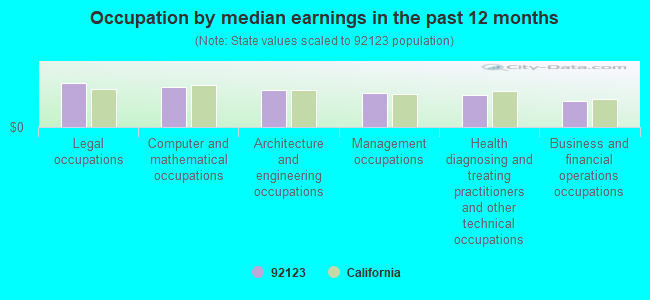
Occupation by median earnings in the past 12 months ($)
119,862Legal occupations
107,661Computer and mathematical occupations
101,450Architecture and engineering occupations
93,156Management occupations
86,334Health diagnosing and treating practitioners and other technical occupations
71,011Business and financial operations occupations
Companies with biggest federal contracts located in this zip code (SAN DIEGO, CA):
RAYTHEON COMPANY (8680 BALBOA AVE) : $484,950,305 in 218 contractsfrom 1999 to 2006
Contracts for Other Defense -- Operational Systems Development (R&D), Electronic Countermeasures, Counter-Countermeasures and Quick Reaction Capability Equipment, Fire Control Designating and Indicating Equipment, Defense Electronics and Communication Equipment -- Operational Systems Development (R&D), and moreby Navy Signed by year:2000: $82,244,561; 2001: $38,173,211; 2002: $105,474,246; 2003: $93,937,672; 2004: $76,788,699; 2005: $55,928,002; 2006: $19,573,560.
Biggest contracts:
$37,625,753 with Navy for Other Defense -- Operational Systems Development (R&D). Signed on 2002-12-17. Completion date: 2003-10-31.
$34,193,000 with Navy for Electronic Countermeasures, Counter-Countermeasures and Quick Reaction Capability Equipment. Signed on 2000-05-26. Completion date: 2002-03-25.
$26,636,550 with Navy for Other Defense -- Operational Systems Development (R&D). Signed on 2003-11-24. Completion date: 2004-10-31.
$18,180,138, same as above.Signed on 2003-10-09. Completion date: 2004-10-31.
CUBIC DEFENSE APPLICATIONS, IN (9333 BALBOA AVE) : $408,929,080 in 574 contractsfrom 1999 to 2006
Contracts for Communications Security Equipment and Components, Defense Electronics and Communication Equipment -- Engineering Development (R&D), Operation Training Devices, Services -- Management and Support (R&D), and moreby Navy, Army, Air Force, Department of Defense, and others Signed by year:2000: $43,746,030; 2001: $50,925,164; 2002: $57,039,271; 2003: $74,694,057; 2004: $86,400,358; 2005: $58,238,847; 2006: $35,474,326.
Biggest contracts:
$26,241,984 with Navy for Communications Security Equipment and Components. Signed on 2003-03-13. Completion date: 2005-02-13.
$20,650,790, same as above.Signed on 2004-03-18. Completion date: 2004-03-18.
$10,289,920 with Army for Defense Electronics and Communication Equipment -- Engineering Development (R&D). Signed on 2000-03-21. Completion date: 2003-06-30.
$9,751,240, same as above.Signed on 2001-01-08. Completion date: 2002-08-30.
HAMILTON SUNDSTRAND CORPORATIO (4400 RUFFIN RD) : $244,483,898 in 520 contractsfrom 1999 to 2006
Contracts for Aircraft Ground Servicing Equipment, Gas Turbines and Jet Engines, Non-Aircraft; and Components, Miscellaneous Engine Accessories, Aircraft, Engine Fuel System Components, Aircraft and Missile Prime Movers, and moreby Navy, Army, Defense Logistics Agency, Air Force, and others Signed by year:2000: $2,671,797; 2001: $10,352,472; 2002: $25,740,909; 2003: $76,267,409; 2004: $57,141,095; 2005: $52,479,963; 2006: $20,126,541.
Biggest contracts:
$28,573,066 with Navy for Aircraft Ground Servicing Equipment. Signed on 2004-11-22. Completion date: 2004-09-30.
$27,111,866, same as above.Signed on 2003-12-16. Completion date: 2004-09-30.
$13,531,050, same as above.Signed on 2003-05-19. Completion date: 2004-09-30.
$6,644,100 with Army for Gas Turbines and Jet Engines, Non-Aircraft; and Components. Signed on 2004-03-11. Completion date: 2006-09-30.
CORROSION ENGINEERING SERVICES (3635 RUFFIN ROAD SUITE 100; small business) : $219,566,968 in 477 contractsfrom 1999 to 2006
Contracts for Engineering and Technical Services, Non-nuclear Ship Repair (West) Ship repair (including overhauls and conversions) performed on. non-nuclear propelled and nonpropelled ships west of the 108th meridian, Vocational/Technical, Non-nuclear Ship Repair (East) Ship repair (including overhauls and conversions) performed on non-nuclear propelled and nonpropelled ships east of the 108th meridian, and moreby Navy, Federal Supply Service, Federal Technology Service, Department of Veterans Affairs, and others Signed by year:2000: $23,918,766; 2001: $19,384,883; 2002: $93,994,734; 2003: $29,998,015; 2004: $25,227,808; 2005: $20,435,284; 2006: $6,547,485.
Biggest contracts:
$62,651,606 with Navy for Engineering and Technical Services. Signed on 2002-10-01. Completion date: 2006-09-29.
$19,627,052 with Navy for Non-nuclear Ship Repair (West) Ship repair (including overhauls and conversions) performed on. non-nuclear propelled and nonpropelled ships west of the 108th meridian. Signed on 2000-10-27. Completion date: 2005-10-31.
$6,982,885, same as above.Signed on 2002-11-26. Completion date: 2005-11-13.
$5,775,591, same as above.Signed on 2004-11-17. Completion date: 2005-11-13.
ORI SERVICES CORPORATION (3914 MURPHY CANYON RD; small business) : $132,298,499 in 652 contractsfrom 1999 to 2006
Contracts for Maintenance, Repair and Rebuilding of Equipment -- Electrical and Electronic Equipment Components, Miscellaneous Communication Equipment, Other Management Support Services, Facilities Operations Support Services, and moreby Navy, Army, Department of Defense, Defense Threat Reduction Agency, and others Signed by year:2000: $12,586,844; 2001: $17,335,508; 2002: $22,999,180; 2003: $19,763,532; 2004: $16,077,247; 2005: $22,404,060; 2006: $18,343,539.
Biggest contracts:
$7,758,678 with Navy for Maintenance, Repair and Rebuilding of Equipment -- Electrical and Electronic Equipment Components. Signed on 2001-05-09. Completion date: 2002-05-08.
$7,577,987, same as above.Signed on 2002-03-20. Completion date: 2003-03-31.
$6,650,759 with Navy for Miscellaneous Communication Equipment. Signed on 2006-05-11. Completion date: 2007-05-10.
$6,153,013, same as above.Signed on 2006-05-10. Completion date: 2007-05-09.
C E WYLIE CONSTRUCTIONCO (3777 RUFFIN ROAD) : $91,143,853 in 210 contractsfrom 1999 to 2005
Contracts for Construction of Structures and Facilities -- Other Airfield Structures, Construction of Structures and Facilities -- Laboratories and Clinics, Construction of Structures and Facilities -- Miscellaneous Buildings, Maintenance, Repair or Alteration of Real Property -- Sewage and Waste Facilities, and moreby Navy, Army Signed by year:2000: $41,631,661; 2001: $2,450,704; 2002: $876,994; 2003: $922,758; 2004: $26,971,066; 2005: $18,160,981; 2006: $0.
Biggest contracts:
$27,000,000 with Navy for Construction of Structures and Facilities -- Other Airfield Structures. Signed on 2004-12-28. Completion date: 2006-07-14.
$16,000,000, same as above.Signed on 2005-12-23. Completion date: 2007-08-20.
$10,875,000 with Navy for Construction of Structures and Facilities -- Laboratories and Clinics. Signed on 2000-07-13. Completion date: 2002-04-10.
$9,935,380 with Navy for Construction of Structures and Facilities -- Miscellaneous Buildings. Signed on 2000-09-22. Completion date: 2002-04-10.
CUBIC WORLDWIDE TECHNICAL SERV (4285 PONDEROSA AVE) : $78,160,229 in 199 contractsfrom 1999 to 2006
Contracts for Maintenance, Repair and Rebuilding of Equipment -- Training Aids and Devices, Vocational/Technical, Engineering and Technical Services, Technical Representation Services -- Training Aids and Devices, and moreby Navy, Air Force, Defense Logistics Agency Signed by year:2000: $5,149,452; 2001: $7,079,568; 2002: $20,523,833; 2003: $24,267,077; 2004: $12,042,977; 2005: $5,761,637; 2006: $3,303,273.
Biggest contracts:
$4,055,835 with Navy for Maintenance, Repair and Rebuilding of Equipment -- Training Aids and Devices. Taking place in NC. Signed on 2005-10-31. Completion date: 2006-09-30.
$3,165,035 with Air Force for Vocational/Technical. Taking place in FL. Signed on 2000-10-26. Completion date: 2001-09-30.
$3,115,675, same as above.Signed on 2001-10-01. Completion date: 2002-09-30.
$2,764,315 with Navy for Maintenance, Repair and Rebuilding of Equipment -- Training Aids and Devices. Taking place in FL. Signed on 2003-10-07. Completion date: 2004-09-30.
CUBIC WORLDWIDE TECHNICAL SERV (9233 BALBOA AVE) : $42,509,404 in 128 contractsfrom 1999 to 2006
Contracts for Maintenance, Repair and Rebuilding of Equipment -- Training Aids and Devices, Engineering and Technical Services, Expert Witness, Program Management/Support Services, and moreby Navy, Air Force Signed by year:2000: $672,985; 2001: $4,264,369; 2002: $279,964; 2003: $0; 2004: $10,746,358; 2005: $15,976,485; 2006: $9,436,569.
Biggest contracts:
$5,053,539 with Navy for Maintenance, Repair and Rebuilding of Equipment -- Training Aids and Devices. Signed on 2006-01-09. Completion date: 2002-09-27.
$2,857,335 with Navy for Maintenance, Repair and Rebuilding of Equipment -- Training Aids and Devices. Taking place in FL. Signed on 2004-10-27. Completion date: 2004-09-30.
$2,713,326, same as above.Signed on 2005-10-16. Completion date: 2004-09-30.
$2,054,431 with Navy for Maintenance, Repair and Rebuilding of Equipment -- Training Aids and Devices. Signed on 2005-10-18. Completion date: 2002-09-27.
MAXWELL TECHNOLOGIES, INC (9275 SKY PARK CT) : $39,294,018 in 213 contractsfrom 1999 to 2006
Contracts for Other Defense -- Applied Research and Exploratory Development (R&D), Other Defense -- Management and Support (R&D), Ammunition -- Basic Research (R&D), Weapons -- Operational Systems Development (R&D), and moreby Department of Defense, Defense Threat Reduction Agency, Air Force, NASA, and others Signed by year:2000: $15,065,216; 2001: $6,816,564; 2002: $1,438,538; 2003: $0; 2004: $3,812,867; 2005: $6,023,703; 2006: $306,733.
Biggest contracts:
$1,756,800 with Department of Defense for Other Defense -- Applied Research and Exploratory Development (R&D). Signed on 2000-03-13. Completion date: 2000-09-09.
$1,645,195 with Department of Defense for Other Defense -- Management and Support (R&D). Signed on 1999-11-17. Completion date: 2000-09-29.
$1,540,000 with Defense Threat Reduction Agency for Ammunition -- Basic Research (R&D). Signed on 2004-05-21. Completion date: 2006-05-31.
$1,443,040 with Air Force for Weapons -- Operational Systems Development (R&D). Taking place in NM. Signed on 2000-03-02. Completion date: 2002-05-30.
CUBIC CORPORATION (9333 BALBOA AVE) : $38,644,253 in 61 contractsfrom 1999 to 2002
Contracts for Armament Training Devices, Operation Training Devices, Maintenance, Repair and Rebuilding of Equipment -- Aircraft Components and Accessories, Communication Training Devices, and moreby Navy, Air Force Signed by year:2000: $36,396,819; 2001: -$1,620,006; 2002: $2,618,727; 2003: $0; 2004: $0; 2005: $0; 2006: $0.
Biggest contracts:
$23,996,924 with Navy for Armament Training Devices. Signed on 2000-02-16. Completion date: 2001-05-16.
$4,062,020, same as above.Signed on 2000-01-31. Completion date: 2002-06-30.
$1,867,752 with Navy for Operation Training Devices. Signed on 2002-09-12. Completion date: 2004-03-30.
$1,781,367 with Air Force for Maintenance, Repair and Rebuilding of Equipment -- Aircraft Components and Accessories. Signed on 2000-01-25. Completion date: 2004-06-30.
Top industries in this zip code by the number of employees in 2005:
Administrative and Support and Waste Management and Remediation Services: Temporary Help Services (over 1000 employees: 1 establishment, 500-999 employees: 1 establishment, 250-499 employees: 1 establishment, 100-249 employees: 3 establishments, 50-99 employees: 3 establishments, 20-49 employees: 1 establishment, 10-19 employees: 1 establishment, 5-9 employees: 2 establishments, 1-4 employees: 4 establishments)
Health Care and Social Assistance: General Medical and Surgical Hospitals (over 1000: 2)
Management of Companies and Enterprises: Corporate, Subsidiary, and Regional Managing Offices (500-999: 2, 100-249: 3, 50-99: 7, 20-49: 4, 10-19: 3, 5-9: 6, 1-4: 6)
Educational Services: Colleges, Universities, and Professional Schools (over 1000: 1, 250-499: 1, 100-249: 2, 50-99: 2, 5-9: 1, 1-4: 3)
Utilities: Electric Power Distribution (over 1000: 1, 100-249: 1, 10-19: 1, 1-4: 1)
Other Services (except Public Administration): Business Associations (over 1000: 1, 50-99: 1, 20-49: 1, 5-9: 3, 1-4: 2)
Other Services (except Public Administration): Other Electronic and Precision Equipment Repair and Maintenance (over 1000: 1, 5-9: 1)
Health Care and Social Assistance: Offices of Physicians (except Mental Health Specialists) (100-249: 3, 50-99: 1, 20-49: 8, 10-19: 17, 5-9: 22, 1-4: 57)
People in group quarters in 2010:
411 people in nursing facilities/skilled-nursing facilities
322 people in correctional facilities intended for juveniles
91 people in hospitals with patients who have no usual home elsewhere
85 people in group homes intended for adults
51 people in group homes for juveniles (non-correctional)
13 people in residential treatment centers for juveniles (non-correctional)
13 people in other noninstitutional facilities
12 people in residential treatment centers for adults
People in group quarters in 2000:
465 people in short-term care, detention or diagnostic centers for delinquent children
339 people in nursing homes
213 people in other group homes
117 people in mental (psychiatric) hospitals or wards
105 people in other noninstitutional group quarters
33 people in training schools for juvenile delinquents
Fatal accident statistics in 2014:
Fatal accident count: 1
Vehicles involved in fatal accidents: 1
Fatal accidents caused by drunken drivers: 0
Fatalities: 1
Persons involved in fatal accidents: 1
Pedestrians involved in fatal accidents: 0
Fatal accident statistics in 2013:
Fatal accident count: 2
Vehicles involved in fatal accidents: 6
Fatal accidents caused by drunken drivers: 1
Fatalities: 2
Persons involved in fatal accidents: 7
Pedestrians involved in fatal accidents: 0
Home Mortgage Disclosure Act Aggregated Statistics For Year 2009 (Based on 5 full and 6 partial tracts)
A) FHA, FSA/RHS & VA Home Purchase Loans
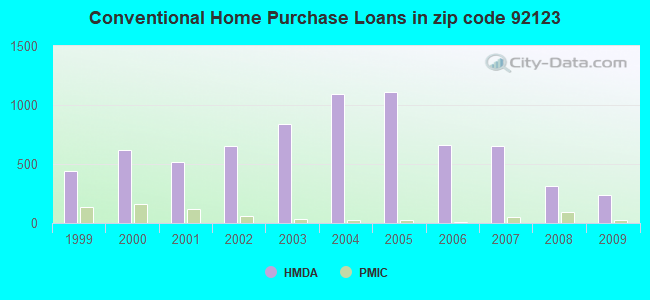
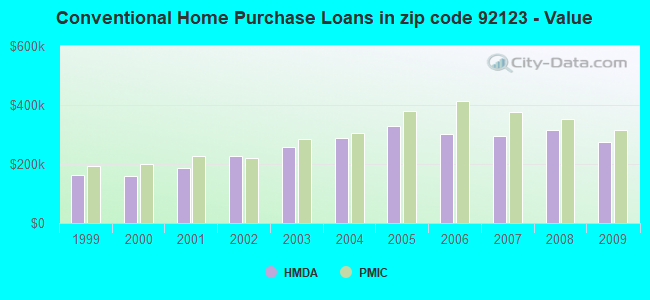
B) Conventional Home Purchase Loans
C) Refinancings
D) Home Improvement Loans
F) Non-occupant Loans on < 5 Family Dwellings (A B C & D)
G) Loans On Manufactured Home Dwelling (A B C & D)
Number
Average Value
Number
Average Value
Number
Average Value
Number
Average Value
Number
Average Value
Number
Average Value
LOANS ORIGINATED
143
$349,353
238
$275,415
891
$275,300
36
$151,848
102
$235,637
1
$61,300
APPLICATIONS APPROVED, NOT ACCEPTED
15
$337,943
35
$236,857
104
$321,892
3
$18,850
12
$165,272
5
$63,752
APPLICATIONS DENIED
19
$438,941
50
$277,669
316
$322,036
18
$70,716
42
$291,844
6
$60,278
APPLICATIONS WITHDRAWN
14
$321,789
39
$283,700
208
$289,730
2
$286,870
26
$266,985
0
$0
FILES CLOSED FOR INCOMPLETENESS
8
$374,455
10
$241,636
44
$273,201
0
$0
7
$191,661
0
$0
Aggregated Statistics For Year 2008 (Based on 5 full and 6 partial tracts)
A) FHA, FSA/RHS & VA Home Purchase Loans
B) Conventional Home Purchase Loans
C) Refinancings
D) Home Improvement Loans
F) Non-occupant Loans on < 5 Family Dwellings (A B C & D)
G) Loans On Manufactured Home Dwelling (A B C & D)
Number
Average Value
Number
Average Value
Number
Average Value
Number
Average Value
Number
Average Value
Number
Average Value
LOANS ORIGINATED
94
$349,182
317
$314,852
457
$282,437
43
$103,219
89
$284,711
6
$41,488
APPLICATIONS APPROVED, NOT ACCEPTED
10
$364,098
63
$316,353
94
$291,522
6
$54,648
15
$282,399
6
$68,043
APPLICATIONS DENIED
8
$387,219
86
$317,454
258
$326,339
26
$82,912
30
$232,587
9
$85,780
APPLICATIONS WITHDRAWN
11
$306,694
87
$327,550
142
$294,047
13
$94,558
28
$299,521
0
$0
FILES CLOSED FOR INCOMPLETENESS
0
$0
18
$319,079
29
$290,801
2
$57,500
8
$338,139
0
$0
Aggregated Statistics For Year 2007 (Based on 5 full and 6 partial tracts)
A) FHA, FSA/RHS & VA Home Purchase Loans
B) Conventional Home Purchase Loans
C) Refinancings
D) Home Improvement Loans
E) Loans on Dwellings For 5+ Families
F) Non-occupant Loans on < 5 Family Dwellings (A B C & D)
G) Loans On Manufactured Home Dwelling (A B C & D)
Number
Average Value
Number
Average Value
Number
Average Value
Number
Average Value
Number
Average Value
Number
Average Value
Number
Average Value
LOANS ORIGINATED
8
$378,431
654
$293,542
826
$282,969
81
$191,712
2
$1,039,375
187
$291,949
6
$90,315
APPLICATIONS APPROVED, NOT ACCEPTED
0
$0
100
$281,378
231
$298,547
17
$57,632
0
$0
31
$322,605
9
$60,522
APPLICATIONS DENIED
1
$405,000
166
$272,821
532
$317,731
63
$133,629
0
$0
82
$301,910
8
$122,572
APPLICATIONS WITHDRAWN
0
$0
83
$272,283
261
$321,621
11
$206,048
0
$0
33
$290,374
0
$0
FILES CLOSED FOR INCOMPLETENESS
0
$0
23
$278,704
77
$378,931
3
$164,667
0
$0
6
$331,133
0
$0
Aggregated Statistics For Year 2006 (Based on 5 full and 6 partial tracts)
A) FHA, FSA/RHS & VA Home Purchase Loans
B) Conventional Home Purchase Loans
C) Refinancings
D) Home Improvement Loans
E) Loans on Dwellings For 5+ Families
F) Non-occupant Loans on < 5 Family Dwellings (A B C & D)
G) Loans On Manufactured Home Dwelling (A B C & D)
Number
Average Value
Number
Average Value
Number
Average Value
Number
Average Value
Number
Average Value
Number
Average Value
Number
Average Value
LOANS ORIGINATED
3
$263,080
658
$301,025
1,135
$286,813
117
$203,563
1
$23,000,000
195
$279,098
8
$71,870
APPLICATIONS APPROVED, NOT ACCEPTED
0
$0
134
$300,812
259
$296,509
11
$236,078
0
$0
47
$273,030
7
$85,580
APPLICATIONS DENIED
0
$0
191
$267,769
504
$333,784
70
$146,535
0
$0
45
$321,397
22
$64,589
APPLICATIONS WITHDRAWN
0
$0
118
$323,985
385
$317,516
19
$187,849
0
$0
48
$314,504
0
$0
FILES CLOSED FOR INCOMPLETENESS
0
$0
38
$237,550
87
$319,493
7
$290,320
0
$0
11
$253,551
0
$0
Aggregated Statistics For Year 2005 (Based on 5 full and 6 partial tracts)
A) FHA, FSA/RHS & VA Home Purchase Loans
B) Conventional Home Purchase Loans
C) Refinancings
D) Home Improvement Loans
E) Loans on Dwellings For 5+ Families
F) Non-occupant Loans on < 5 Family Dwellings (A B C & D)
G) Loans On Manufactured Home Dwelling (A B C & D)
Number
Average Value
Number
Average Value
Number
Average Value
Number
Average Value
Number
Average Value
Number
Average Value
Number
Average Value
LOANS ORIGINATED
0
$0
1,107
$329,446
1,496
$307,790
152
$189,035
5
$18,034,478
260
$317,534
20
$150,634
APPLICATIONS APPROVED, NOT ACCEPTED
0
$0
258
$284,487
227
$300,660
19
$255,767
0
$0
46
$307,790
8
$117,195
APPLICATIONS DENIED
0
$0
373
$312,149
497
$313,981
54
$207,160
0
$0
73
$313,548
21
$121,219
APPLICATIONS WITHDRAWN
2
$409,485
385
$320,079
433
$325,272
36
$215,213
0
$0
45
$291,321
11
$124,655
FILES CLOSED FOR INCOMPLETENESS
0
$0
85
$292,524
144
$311,310
7
$311,484
0
$0
9
$279,948
6
$251,850
Aggregated Statistics For Year 2004 (Based on 5 full and 6 partial tracts)
A) FHA, FSA/RHS & VA Home Purchase Loans
B) Conventional Home Purchase Loans
C) Refinancings
D) Home Improvement Loans
E) Loans on Dwellings For 5+ Families
F) Non-occupant Loans on < 5 Family Dwellings (A B C & D)
G) Loans On Manufactured Home Dwelling (A B C & D)
Number
Average Value
Number
Average Value
Number
Average Value
Number
Average Value
Number
Average Value
Number
Average Value
Number
Average Value
LOANS ORIGINATED
2
$202,055
1,097
$288,350
1,576
$256,760
124
$187,731
2
$873,075
212
$268,434
8
$79,969
APPLICATIONS APPROVED, NOT ACCEPTED
0
$0
235
$278,801
213
$257,495
11
$102,390
0
$0
34
$231,584
5
$103,230
APPLICATIONS DENIED
0
$0
264
$266,926
434
$270,220
48
$109,235
0
$0
33
$339,304
22
$75,772
APPLICATIONS WITHDRAWN
0
$0
331
$288,441
421
$266,694
28
$136,835
0
$0
49
$243,569
4
$69,882
FILES CLOSED FOR INCOMPLETENESS
0
$0
71
$281,943
83
$252,758
5
$47,926
1
$1,869,650
6
$182,352
0
$0
Aggregated Statistics For Year 2003 (Based on 5 full and 6 partial tracts)
A) FHA, FSA/RHS & VA Home Purchase Loans
B) Conventional Home Purchase Loans
C) Refinancings
D) Home Improvement Loans
E) Loans on Dwellings For 5+ Families
F) Non-occupant Loans on < 5 Family Dwellings (A B C & D)
Number
Average Value
Number
Average Value
Number
Average Value
Number
Average Value
Number
Average Value
Number
Average Value
LOANS ORIGINATED
8
$234,804
840
$258,239
3,291
$206,143
51
$83,171
1
$1,630,580
305
$204,185
APPLICATIONS APPROVED, NOT ACCEPTED
0
$0
135
$239,914
374
$198,219
13
$28,820
0
$0
36
$241,489
APPLICATIONS DENIED
3
$187,333
162
$230,279
510
$214,323
33
$67,033
0
$0
37
$263,702
APPLICATIONS WITHDRAWN
6
$230,785
169
$261,715
553
$211,498
29
$75,832
0
$0
41
$212,314
FILES CLOSED FOR INCOMPLETENESS
0
$0
23
$336,760
89
$223,731
5
$46,860
0
$0
12
$263,636
Aggregated Statistics For Year 2002 (Based on 5 full and 6 partial tracts)
A) FHA, FSA/RHS & VA Home Purchase Loans
B) Conventional Home Purchase Loans
C) Refinancings
D) Home Improvement Loans
E) Loans on Dwellings For 5+ Families
F) Non-occupant Loans on < 5 Family Dwellings (A B C & D)
Number
Average Value
Number
Average Value
Number
Average Value
Number
Average Value
Number
Average Value
Number
Average Value
LOANS ORIGINATED
30
$209,449
656
$225,752
2,375
$188,080
54
$56,343
1
$3,255,030
199
$187,381
APPLICATIONS APPROVED, NOT ACCEPTED
0
$0
94
$206,190
360
$182,618
27
$51,146
0
$0
22
$155,064
APPLICATIONS DENIED
4
$210,115
88
$203,373
319
$184,735
37
$51,570
0
$0
31
$228,347
APPLICATIONS WITHDRAWN
0
$0
92
$226,317
357
$197,780
19
$70,756
0
$0
30
$192,635
FILES CLOSED FOR INCOMPLETENESS
0
$0
23
$229,725
145
$193,956
0
$0
0
$0
8
$195,071
Aggregated Statistics For Year 2001 (Based on 5 full and 6 partial tracts)
A) FHA, FSA/RHS & VA Home Purchase Loans
B) Conventional Home Purchase Loans
C) Refinancings
D) Home Improvement Loans
E) Loans on Dwellings For 5+ Families
F) Non-occupant Loans on < 5 Family Dwellings (A B C & D)
Number
Average Value
Number
Average Value
Number
Average Value
Number
Average Value
Number
Average Value
Number
Average Value
LOANS ORIGINATED
45
$175,625
517
$187,725
1,809
$173,070
67
$41,851
2
$744,195
142
$163,556
APPLICATIONS APPROVED, NOT ACCEPTED
0
$0
86
$177,965
201
$168,019
41
$46,378
0
$0
12
$129,064
APPLICATIONS DENIED
7
$167,659
81
$173,743
366
$154,456
43
$37,483
0
$0
31
$114,014
APPLICATIONS WITHDRAWN
19
$148,333
70
$192,648
268
$152,160
31
$67,158
0
$0
27
$144,269
FILES CLOSED FOR INCOMPLETENESS
0
$0
21
$243,862
78
$175,478
4
$45,000
0
$0
10
$95,017
Aggregated Statistics For Year 2000 (Based on 5 full and 6 partial tracts)
A) FHA, FSA/RHS & VA Home Purchase Loans
B) Conventional Home Purchase Loans
C) Refinancings
D) Home Improvement Loans
E) Loans on Dwellings For 5+ Families
F) Non-occupant Loans on < 5 Family Dwellings (A B C & D)
Number
Average Value
Number
Average Value
Number
Average Value
Number
Average Value
Number
Average Value
Number
Average Value
LOANS ORIGINATED
81
$157,128
620
$160,581
421
$120,258
116
$32,338
1
$8,704,600
63
$150,438
APPLICATIONS APPROVED, NOT ACCEPTED
9
$137,639
84
$156,569
80
$182,651
40
$38,945
0
$0
8
$140,430
APPLICATIONS DENIED
5
$259,882
105
$158,899
183
$119,059
51
$37,022
1
$6,400,000
12
$107,957
APPLICATIONS WITHDRAWN
29
$164,059
93
$173,403
100
$98,227
17
$24,744
0
$0
14
$138,974
FILES CLOSED FOR INCOMPLETENESS
3
$191,510
18
$176,502
50
$142,182
2
$30,000
0
$0
8
$117,949
Aggregated Statistics For Year 1999 (Based on 3 full and 4 partial tracts)
A) FHA, FSA/RHS & VA Home Purchase Loans
B) Conventional Home Purchase Loans
C) Refinancings
D) Home Improvement Loans
E) Loans on Dwellings For 5+ Families
F) Non-occupant Loans on < 5 Family Dwellings (A B C & D)
2005 - 2018 National Fire Incident Reporting System (NFIRS) incidents
Based on the data from the years 2005 - 2018 the average number of fires per year is 33. The highest number of reported fires - 74 took place in 2017, and the least - 0 in 2009. The data has a rising trend.
When looking into fire subcategories, the most reports belonged to: Structure Fires (35.1%), and Outside Fires (29.8%).
Fire incident types reported to NFIRS in Zip Code 92123
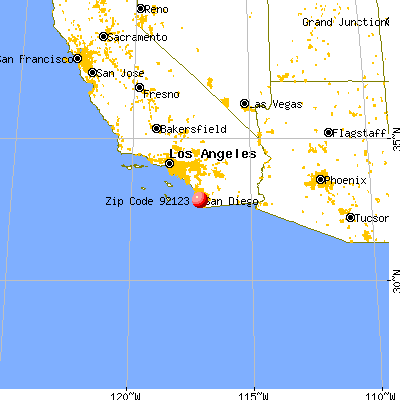


 Nearest zip codes: 92108, 92111, 92116, 92124, 92120, 92104.


 Based on the data from the years 2005 - 2018 the average number of fires per year is 33. The highest number of reported fires - 74 took place in 2017, and the least - 0 in 2009. The data has a rising trend.
 When looking into fire subcategories, the most reports belonged to: Structure Fires (35.1%), and Outside Fires (29.8%).