Estimated zip code population in 2022: 2,136 Zip code population in 2010: 1,783 Zip code population in 2000: 2,034
Houses and condos: 1,078 Renter-occupied apartments: 225
% of renters here:
26%
State:
46%
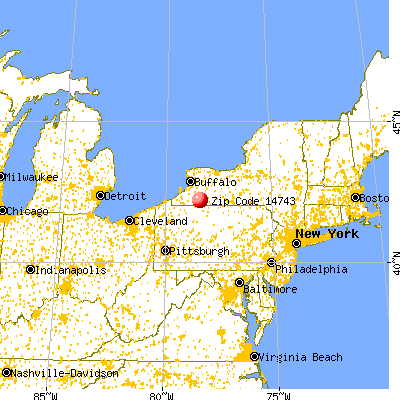
March 2022 cost of living index in zip code 14743: 93.5 (less than average, U.S. average is 100)
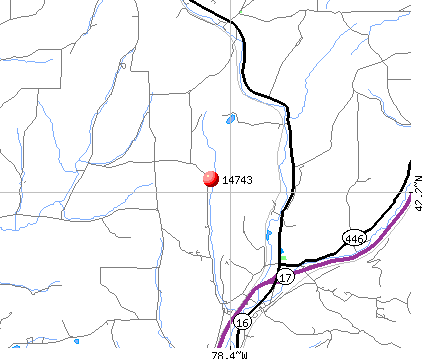
Land area: 43.4 sq. mi. Water area: 0.0 sq. mi.
Population density: 49 people per square mile
(very low).
OSM Map
General Map
Google Map
MSN Map
OSM Map
General Map
Google Map
MSN Map
OSM Map
General Map
Google Map
MSN Map
OSM Map
General Map
Google Map
MSN Map
Please wait while loading the map...
Real estate property taxes paid for housing units in 2022:
This zip code:
2.3% ($2,260)
New York:
1.5% ($6,180)
Median real estate property taxes paid for housing units with mortgages in 2022: $2,937 (2.4%) Median real estate property taxes paid for housing units with no mortgage in 2022: $1,734 (2.0%)
Business Search- 14 Million verified businesses
Males: 1,077
(50.5%)
Females: 1,058
(49.5%)
For population 25 years and over in 14743:
High school or higher: 92.2%
Bachelor's degree or higher: 12.3%
Graduate or professional degree: 4.7%
Unemployed: 3.3%
Mean travel time to work (commute): 21.3 minutes
For population 15 years and over in 14743:
Never married: 33.0%
Now married: 45.1%
Separated: 2.3%
Widowed: 6.5%
Divorced: 13.1%
Zip code 14743 compared to state average:
Median house value significantly below state average.
Black race population percentage significantly below state average.
Hispanic race population percentage significantly below state average.
Median age above state average.
Foreign-born population percentage significantly below state average.
Renting percentage below state average.
Percentage of population with a bachelor's degree or higher significantly below state average.
Averages for the 2020 tax year for zip code 14743, filed in 2021:
Average Adjusted Gross Income (AGI) in 2020: $49,990 (Individual Income Tax Returns)
Here:
$49,990
State:
$90,930
Salary/wage: $45,305 (reported on 79.5% of returns)
Here:
$45,305
State:
$72,104
(% of AGI for various income ranges: 996.3% for AGIs below $25k, 3412.9% for AGIs $25k-50k, 5368.0% for AGIs $50k-75k, 8830.0% for AGIs $75k-100k, 13263.7% for AGIs $100k-200k)
Taxable interest for individuals: $330 (reported on 29.5% of returns)
This zip code:
$330
New York:
$3,075
(% of AGI for various income ranges: 6.3% for AGIs below $25k, 5.3% for AGIs $25k-50k, 20.0% for AGIs $50k-75k, 16.0% for AGIs $75k-100k, 33.8% for AGIs $100k-200k)
Ordinary dividends: $1,586 (reported on 17.9% of returns)
Here:
$1,586
State:
$11,095
(% of AGI for various income ranges: 17.9% for AGIs below $25k, 40.6% for AGIs $25k-50k, 42.0% for AGIs $75k-100k, 122.5% for AGIs $100k-200k)
Net capital gain/loss in AGI: +$2,444 (reported on 11.5% of returns)
Here:
+$2,444
State:
+$44,925
(% of AGI for various income ranges: 26.3% for AGIs below $25k, 52.0% for AGIs $50k-75k, 147.5% for AGIs $100k-200k)
Profit/loss from business: +$11,075 (reported on 10.3% of returns)
Here:
+$11,075
State:
+$14,940
(% of AGI for various income ranges: 81.1% for AGIs below $25k, 80.6% for AGIs $25k-50k, 1190.0% for AGIs $75k-100k)
Taxable individual retirement arrangement distribution: $13,800 (reported on 12.8% of returns)
14743:
$13,800
New York:
$19,609
(% of AGI for various income ranges: 186.8% for AGIs below $25k, 530.0% for AGIs $50k-75k, 618.8% for AGIs $100k-200k)
Earned income credit: $1,942 (reported on 15.4% of returns)
Here:
$1,942
State:
$2,138
(% of AGI for various income ranges: 64.7% for AGIs below $25k, 64.7% for AGIs $25k-50k)
Percentage of individuals using paid preparers for their 2020 taxes: 97.4%
Here:
97%
State:
95%
(% for various income ranges: 96.3% for AGIs below $25k, 95.2% for AGIs $25k-50k, 100.0% for AGIs $50k-75k, 100.0% for AGIs $75k-100k, 100.0% for AGIs $100k-200k)
Averages for the 2012 tax year for zip code 14743, filed in 2013:
Average Adjusted Gross Income (AGI) in 2012: $42,926 (Individual Income Tax Returns)
Here:
$42,926
State:
$77,088
Salary/wage: $37,574 (reported on 85.2% of returns)
Here:
$37,574
State:
$60,593
(% of AGI for various income ranges: 71.7% for AGIs below $25k, 76.9% for AGIs $25k-50k, 74.3% for AGIs $50k-75k, 82.5% for AGIs $75k-100k, 66.7% for AGIs $100k-200k)
Taxable interest for individuals: $328 (reported on 35.8% of returns)
This zip code:
$328
New York:
$3,125
(% of AGI for various income ranges: 0.5% for AGIs below $25k, 0.3% for AGIs $25k-50k, 0.5% for AGIs $50k-75k, 0.1% for AGIs $100k-200k)
Ordinary dividends: $1,600 (reported on 18.5% of returns)
Here:
$1,600
State:
$10,299
(% of AGI for various income ranges: 0.8% for AGIs below $25k, 0.8% for AGIs $25k-50k, 1.4% for AGIs $50k-75k, 0.5% for AGIs $75k-100k)
Net capital gain/loss in AGI: +$2,145 (reported on 13.6% of returns)
Here:
+$2,145
State:
+$42,474
(% of AGI for various income ranges: 0.3% for AGIs $25k-50k, 0.4% for AGIs $50k-75k, 2.6% for AGIs $75k-100k)
Profit/loss from business: +$8,464 (reported on 13.6% of returns)
Here:
+$8,464
State:
+$16,168
(% of AGI for various income ranges: 4.0% for AGIs below $25k, 4.0% for AGIs $25k-50k, 1.7% for AGIs $50k-75k, 4.0% for AGIs $100k-200k)
Taxable individual retirement arrangement distribution: $11,640 (reported on 12.3% of returns)
14743:
$11,640
New York:
$17,621
(% of AGI for various income ranges: 4.2% for AGIs below $25k, 5.5% for AGIs $25k-50k, 7.8% for AGIs $75k-100k)
Total itemized deductions: $17,543 (23% of AGI, reported on 17.3% of returns)
Here:
$17,543
State:
$34,985
Here:
23.1% of AGI
State:
21.3% of AGI
(% of AGI for various income ranges: 6.6% for AGIs $25k-50k, 9.0% for AGIs $50k-75k, 4.9% for AGIs $75k-100k, 11.5% for AGIs $100k-200k)
Charity contributions: $2,144 (reported on 11.1% of returns)
Here:
$2,144
State:
$5,572
Taxes paid: $7,229 (reported on 17.3% of returns)
14743:
$7,229
State:
$18,656
(% of AGI for various income ranges: 2.0% for AGIs $25k-50k, 3.2% for AGIs $50k-75k, 2.4% for AGIs $75k-100k, 5.6% for AGIs $100k-200k)
Earned income credit: $2,159 (reported on 21.0% of returns)
Here:
$2,159
State:
$2,230
(% of AGI for various income ranges: 6.6% for AGIs below $25k, 1.2% for AGIs $25k-50k)
Percentage of individuals using paid preparers for their 2012 taxes: 61.7%
Here:
62%
State:
66%
(% for various income ranges: 57.6% for AGIs below $25k, 61.9% for AGIs $25k-50k, 69.2% for AGIs $50k-75k, 62.5% for AGIs $75k-100k, 66.7% for AGIs $100k-200k)
Averages for the 2004 tax year for zip code 14743, filed in 2005:
Average Adjusted Gross Income (AGI) in 2004: $33,148 (Individual Income Tax Returns)
Here:
$33,148
State:
$59,519
Salary/wage: $30,425 (reported on 90.3% of returns)
Here:
$30,425
State:
$50,673
(% of AGI for various income ranges: 90.1% for AGIs below $10k, 81.7% for AGIs $10k-25k, 80.6% for AGIs $25k-50k, 85.1% for AGIs $50k-75k, 85.7% for AGIs $75k-100k, 77.8% for AGIs over 100k)
Taxable interest for individuals: $510 (reported on 41.8% of returns)
This zip code:
$510
New York:
$2,377
(% of AGI for various income ranges: 1.8% for AGIs below $10k, 1.9% for AGIs $10k-25k, 0.5% for AGIs $25k-50k, 0.4% for AGIs $50k-75k, 0.3% for AGIs $75k-100k, 0.2% for AGIs over 100k)
Taxable dividends: $1,000 (reported on 18.2% of returns)
Here:
$1,000
State:
$5,394
(% of AGI for various income ranges: 0.9% for AGIs below $10k, 0.4% for AGIs $10k-25k, 0.5% for AGIs $25k-50k, 1.0% for AGIs $50k-75k, 0.1% for AGIs $75k-100k)
Net capital gain/loss: +$1,485 (reported on 12.7% of returns)
Here:
+$1,485
State:
+$23,581
(% of AGI for various income ranges: 0.0% for AGIs below $10k, 0.1% for AGIs $10k-25k, 0.7% for AGIs $25k-50k, 1.0% for AGIs $50k-75k, 0.2% for AGIs $75k-100k)
Profit/loss from business: +$2,359 (reported on 11.3% of returns)
Here:
+$2,359
State:
+$13,809
(% of AGI for various income ranges: -1.1% for AGIs below $10k, -0.5% for AGIs $10k-25k, 2.1% for AGIs $25k-50k, 0.7% for AGIs $50k-75k)
IRA payment deduction: $2,182 (reported on 2.7% of returns)
14743:
$2,182
New York:
$3,115
Total itemized deductions: $14,152 (22% of AGI, reported on 15.4% of returns)
Here:
$14,152
State:
$25,864
Here:
21.8% of AGI
State:
21.9% of AGI
(% of AGI for various income ranges: 2.9% for AGIs $10k-25k, 4.5% for AGIs $25k-50k, 6.6% for AGIs $50k-75k, 9.7% for AGIs $75k-100k, 18.3% for AGIs over 100k)
Charity contributions deductions: $1,778 (3% of AGI, reported on 12.2% of returns)
Here:
$1,778
State:
$4,439
Here:
2.7% of AGI
State:
3.6% of AGI
(% of AGI for various income ranges: 0.5% for AGIs $25k-50k, 0.7% for AGIs $50k-75k, 0.7% for AGIs $75k-100k, 2.4% for AGIs over 100k)
Total tax: $3,496 (reported on 71.1% of returns)
14743:
$3,496
State:
$11,730
(% of AGI for various income ranges: 1.6% for AGIs below $10k, 3.6% for AGIs $10k-25k, 6.2% for AGIs $25k-50k, 7.9% for AGIs $50k-75k, 11.0% for AGIs $75k-100k, 14.1% for AGIs over 100k)
Earned income credit: $1,647 (reported on 16.4% of returns)
Here:
$1,647
State:
$1,757
Percentage of individuals using paid preparers for their 2004 taxes: 58.2%
Here:
58%
State:
67%
(% for various income ranges: 48.6% for AGIs below $10k, 61.2% for AGIs $10k-25k, 60.8% for AGIs $25k-50k, 64.9% for AGIs $50k-75k, 48.8% for AGIs $75k-100k, 58.8% for AGIs over 100k)
Household received Food Stamps/SNAP in the past 12 months: 279 Household did not receive Food Stamps/SNAP in the past 12 months: 598
Women who had a birth in the past 12 months: 7 (7 now married, 0 unmarried) Women who did not have a birth in the past 12 months: 437 (146 now married, 291 unmarried)
Housing units in zip code 14743 with a mortgage: 216 (12 second mortgage, 3 home equity loan, 8 both second mortgage and home equity loan) Houses without a mortgage: 4
Median monthly owner costs for units with a mortgage: $1,128 Median monthly owner costs for units without a mortgage: $547
Residents with income below the poverty level in 2022:
This zip code:
18.5%
Whole state:
14.3%
Residents with income below 50% of the poverty level in 2022:
This zip code:
10.2%
Whole state:
6.8%
Median number of rooms in houses and condos:
Here:
5.8
State:
6.3
Median number of rooms in apartments:
Here:
4.4
State:
3.8
Notable locations in this zip code not listed on our city pages
Churches in zip code 14743 include: Hinsdale United Methodist Church (A), Ischua Union Church (B), Maplehurst Baptist Church (C), Saint Helen Roman Catholic Church (D). Display/hide their locations on the map
In group quarters: 13 (-1 institutionalized population)
Size of family households: 338 2-persons, 121 3-persons, 86 4-persons, 48 5-persons, 8 6-persons, 24 7-or-more-persons
Size of nonfamily households: 190 1-person, 43 2-persons
221 married couples with children.
119 single-parent households (40 men, 79 women).
99.3% of residents of 14743 zip code speak English at home.
0.1% of residents speak Spanish at home (100% very well).
0.2% of residents speak other Indo-European language at home (100% very well).
0.2% of residents speak Asian or Pacific Island language at home (100% well).
Foreign born population: 18 (0.9%) (100.0% of them are naturalized citizens)
This zip code:
0.9%
Whole state:
22.7%
35%Cambodia
28%German
15%English
12%Swedish
10%Italian
9%American
9%Irish
8%European
Year of entry for the foreign-born population
02010 or later
42000 to 2009
01990 to 1999
12Before 1990
Facilities with environmental interests located in this zip code:
HINSDALE CENTRAL SCHOOL (3701 MAIN ST in HINSDALE, NY)
STATE MASTER (New York facility tracking) - National Pollutant Discharge Elimination System Permit, (Resource Conservation and Recovery Act (tracking hazardous waste)) Organizations: HINSDALE CTL SCH DIST (LEGALLY RESPONSIBLE PARTY)
HINSDALE CENTRAL SCHOOL ( in HINSDALE, NY)
(National Center for Education Statistics) - STATE ID-041401040001 Organizations: HINSDALE CSD (SCHOOL DISTRICT)
HINSDALE WATER DISTRICT TANK (FLANIGAN HILL ROAD AND CONGRESS STREET in HINSDALE, NY)
Small Quantity Generators, between 100 kg and 1000 kg of hazardous waste/month (Resource Conservation and Recovery Act (tracking hazardous waste)) - notification Organizations: TOWN OF HINSDALE WATER DISTRICT (CONTACT/OWNER)
Housing units lacking complete plumbing facilities: 5.7% Housing units lacking complete kitchen facilities: 5.8%
45.3%Bottled, tank, or LP gas
23.1%Fuel oil, kerosene, etc.
10.9%Wood
6.2%Electricity
5.4%Utility gas
4.8%Coal or coke
4.6%Other fuel
Population in 1990: 2,635.
Place of birth for U.S.-born residents:
This state: 1,791
Northeast: 173
Midwest: 52
South: 89
West: 2
70% of the 14743 zip code residents lived in the same house 5 years ago. Out of people who lived in different houses, 73% lived in this county. Out of people who lived in different counties, 50% lived in New York.
91% of the 14743 zip code residents lived in the same house 1 year ago. Out of people who lived in different houses, 91% moved from this county. Out of people who lived in different houses, 4% moved from different state.
Private vs. public school enrollment:
Students in private schools in grades 1 to 8 (elementary and middle school): 6
Here:
4.5%
New York:
15.6%
Students in private schools in grades 9 to 12 (high school):
Here:
0.0%
New York:
15.0%
Students in private undergraduate colleges: 29
Here:
40.3%
New York:
39.2%
Occupation by median earnings in the past 12 months ($)
73,936Transportation occupations
71,647Business and financial operations occupations
59,640Management occupations
59,242Health technologists and technicians
51,076Production occupations
45,742Education, training, and library occupations
Top industries in this zip code by the number of employees in 2005:
Health Care and Social Assistance: Homes for the Elderly (10-19 employees: 1 establishment)
Wholesale Trade: Wholesale Trade Agents and Brokers (10-19: 1)
Accommodation and Food Services: Recreational and Vacation Camps (except Campgrounds) (5-9: 1)
Other Services (except Public Administration): Religious Organizations (1-4: 2)
Other Services (except Public Administration): General Automotive Repair (1-4: 1)
Other Services (except Public Administration): Cemeteries and Crematories (1-4: 1)
Construction: Site Preparation Contractors (1-4: 1)
Finance and Insurance: Commodity Contracts Brokerage (1-4: 1)
People in group quarters in 2010:
9 people in group homes intended for adults
People in group quarters in 2000:
7 people in homes for the mentally retarded
Fatal accident statistics in 2011:
Fatal accident count: 1
Vehicles involved in fatal accidents: 1
Fatal accidents caused by drunken drivers: 1
Fatalities: 1
Persons involved in fatal accidents: 1
Pedestrians involved in fatal accidents: 0
2002 - 2018 National Fire Incident Reporting System (NFIRS) incidents
Based on the data from the years 2002 - 2018 the average number of fire incidents per year is 14. The highest number of fires - 23 took place in 2008, and the least - 6 in 2003. The data has a rising trend.
When looking into fire subcategories, the most incidents belonged to: Structure Fires (48.5%), and Outside Fires (28.9%).
Fire incident types reported to NFIRS in Zip Code 14743


 Nearest zip codes: 14727, 14737, 14760, 14788, 14778, 14706.


 Based on the data from the years 2002 - 2018 the average number of fire incidents per year is 14. The highest number of fires - 23 took place in 2008, and the least - 6 in 2003. The data has a rising trend.
 When looking into fire subcategories, the most incidents belonged to: Structure Fires (48.5%), and Outside Fires (28.9%).