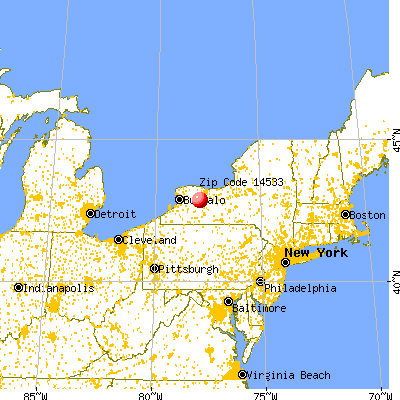
Estimated zip code population in 2022: 1,793 Zip code population in 2010: 2,000 Zip code population in 2000: 2,320
Houses and condos: 833 Renter-occupied apartments: 201
% of renters here:
25%
State:
46%
March 2022 cost of living index in zip code 14533: 94.9 (less than average, U.S. average is 100)
Land area: 32.1 sq. mi. Water area: 0.0 sq. mi.
Population density: 56 people per square mile
(very low).
OSM Map
General Map
Google Map
MSN Map
OSM Map
General Map
Google Map
MSN Map
OSM Map
General Map
Google Map
MSN Map
OSM Map
General Map
Google Map
MSN Map
Please wait while loading the map...
Real estate property taxes paid for housing units in 2022:
This zip code:
2.0% ($3,906)
New York:
1.5% ($6,180)
Median real estate property taxes paid for housing units with mortgages in 2022: $5,120 (2.5%) Median real estate property taxes paid for housing units with no mortgage in 2022: $3,632 (2.0%)
Business Search- 14 Million verified businesses
Males: 975
(54.4%)
Females: 817
(45.6%)
For population 25 years and over in 14533:
High school or higher: 85.3%
Bachelor's degree or higher: 24.1%
Graduate or professional degree: 15.3%
Unemployed: 2.7%
Mean travel time to work (commute): 19.1 minutes
For population 15 years and over in 14533:
Never married: 34.5%
Now married: 45.2%
Separated: 0.7%
Widowed: 9.8%
Divorced: 9.8%
Zip code 14533 compared to state average:
Median house value below state average.
Unemployed percentage below state average.
Black race population percentage significantly below state average.
Hispanic race population percentage below state average.
Foreign-born population percentage significantly below state average.
Renting percentage below state average.
Length of stay since moving in above state average.
Number of rooms per house above state average.
Number of college students below state average.
Percentage of population with a bachelor's degree or higher below state average.
Averages for the 2020 tax year for zip code 14533, filed in 2021:
Average Adjusted Gross Income (AGI) in 2020: $57,146 (Individual Income Tax Returns)
Here:
$57,146
State:
$90,930
Salary/wage: $50,522 (reported on 82.3% of returns)
Here:
$50,522
State:
$72,104
(% of AGI for various income ranges: 1033.8% for AGIs below $25k, 3182.9% for AGIs $25k-50k, 6573.6% for AGIs $50k-75k, 7646.7% for AGIs $75k-100k, 19935.7% for AGIs $100k-200k)
Taxable interest for individuals: $925 (reported on 40.5% of returns)
This zip code:
$925
New York:
$3,075
(% of AGI for various income ranges: 5.0% for AGIs below $25k, 17.1% for AGIs $25k-50k, 28.2% for AGIs $50k-75k, 35.0% for AGIs $75k-100k, 295.7% for AGIs $100k-200k)
Ordinary dividends: $1,683 (reported on 15.2% of returns)
Here:
$1,683
State:
$11,095
(% of AGI for various income ranges: 13.1% for AGIs below $25k, 16.5% for AGIs $25k-50k, 24.5% for AGIs $50k-75k, 180.0% for AGIs $100k-200k)
Net capital gain/loss in AGI: +$4,242 (reported on 15.2% of returns)
Here:
+$4,242
State:
+$44,925
(% of AGI for various income ranges: 36.5% for AGIs $25k-50k, 14.5% for AGIs $50k-75k, 615.7% for AGIs $100k-200k)
Profit/loss from business: +$8,433 (reported on 11.4% of returns)
Here:
+$8,433
State:
+$14,940
(% of AGI for various income ranges: 58.8% for AGIs below $25k, 127.1% for AGIs $25k-50k, 38.2% for AGIs $50k-75k, 678.3% for AGIs $75k-100k)
Taxable individual retirement arrangement distribution: $13,650 (reported on 10.1% of returns)
14533:
$13,650
New York:
$19,609
(% of AGI for various income ranges: 58.8% for AGIs below $25k, 239.4% for AGIs $25k-50k, 985.0% for AGIs $75k-100k)
Earned income credit: $1,925 (reported on 10.1% of returns)
Here:
$1,925
State:
$2,138
(% of AGI for various income ranges: 45.0% for AGIs below $25k, 48.2% for AGIs $25k-50k)
Percentage of individuals using paid preparers for their 2020 taxes: 94.9%
Here:
95%
State:
95%
(% for various income ranges: 95.5% for AGIs below $25k, 95.2% for AGIs $25k-50k, 93.3% for AGIs $50k-75k, 87.5% for AGIs $75k-100k, 100.0% for AGIs $100k-200k)
Averages for the 2012 tax year for zip code 14533, filed in 2013:
Average Adjusted Gross Income (AGI) in 2012: $47,489 (Individual Income Tax Returns)
Here:
$47,489
State:
$77,088
Salary/wage: $39,748 (reported on 87.8% of returns)
Here:
$39,748
State:
$60,593
(% of AGI for various income ranges: 73.8% for AGIs below $25k, 80.3% for AGIs $25k-50k, 74.7% for AGIs $50k-75k, 75.4% for AGIs $75k-100k, 66.3% for AGIs $100k-200k)
Taxable interest for individuals: $1,013 (reported on 41.9% of returns)
This zip code:
$1,013
New York:
$3,125
(% of AGI for various income ranges: 1.1% for AGIs below $25k, 0.2% for AGIs $25k-50k, 0.5% for AGIs $50k-75k, 2.2% for AGIs $100k-200k)
Ordinary dividends: $1,692 (reported on 17.6% of returns)
Here:
$1,692
State:
$10,299
(% of AGI for various income ranges: 1.1% for AGIs below $25k, 0.6% for AGIs $50k-75k, 0.5% for AGIs $75k-100k, 1.0% for AGIs $100k-200k)
Net capital gain/loss in AGI: +$6,411 (reported on 12.2% of returns)
Here:
+$6,411
State:
+$42,474
(% of AGI for various income ranges: 0.9% for AGIs below $25k, 1.1% for AGIs $50k-75k, 4.6% for AGIs $100k-200k)
Profit/loss from business: +$6,012 (reported on 10.8% of returns)
Here:
+$6,012
State:
+$16,168
(% of AGI for various income ranges: 5.5% for AGIs below $25k, 1.2% for AGIs $50k-75k, 2.8% for AGIs $75k-100k)
Taxable individual retirement arrangement distribution: $10,200 (reported on 10.8% of returns)
14533:
$10,200
New York:
$17,621
Total itemized deductions: $16,624 (20% of AGI, reported on 28.4% of returns)
Here:
$16,624
State:
$34,985
Here:
20.2% of AGI
State:
21.3% of AGI
(% of AGI for various income ranges: 9.6% for AGIs $25k-50k, 10.5% for AGIs $50k-75k, 10.1% for AGIs $75k-100k, 13.1% for AGIs $100k-200k)
Charity contributions: $2,094 (reported on 21.6% of returns)
Here:
$2,094
State:
$5,572
(% of AGI for various income ranges: 0.6% for AGIs $25k-50k, 0.8% for AGIs $50k-75k, 1.0% for AGIs $75k-100k, 1.6% for AGIs $100k-200k)
Taxes paid: $8,290 (reported on 28.4% of returns)
14533:
$8,290
State:
$18,656
(% of AGI for various income ranges: 3.6% for AGIs $25k-50k, 5.1% for AGIs $50k-75k, 5.4% for AGIs $75k-100k, 7.4% for AGIs $100k-200k)
Earned income credit: $2,073 (reported on 14.9% of returns)
Here:
$2,073
State:
$2,230
(% of AGI for various income ranges: 4.5% for AGIs below $25k, 1.0% for AGIs $25k-50k)
Percentage of individuals using paid preparers for their 2012 taxes: 59.5%
Here:
59%
State:
66%
(% for various income ranges: 51.9% for AGIs below $25k, 60.0% for AGIs $25k-50k, 58.3% for AGIs $50k-75k, 62.5% for AGIs $75k-100k, 85.7% for AGIs $100k-200k)
Averages for the 2004 tax year for zip code 14533, filed in 2005:
Average Adjusted Gross Income (AGI) in 2004: $38,525 (Individual Income Tax Returns)
Here:
$38,525
State:
$59,519
Salary/wage: $35,584 (reported on 86.6% of returns)
Here:
$35,584
State:
$50,673
(% of AGI for various income ranges: 101.6% for AGIs below $10k, 70.5% for AGIs $10k-25k, 85.6% for AGIs $25k-50k, 82.7% for AGIs $50k-75k, 77.9% for AGIs $75k-100k, 69.7% for AGIs over 100k)
Taxable interest for individuals: $557 (reported on 52.8% of returns)
This zip code:
$557
New York:
$2,377
(% of AGI for various income ranges: 4.5% for AGIs below $10k, 1.9% for AGIs $10k-25k, 0.6% for AGIs $25k-50k, 0.8% for AGIs $50k-75k, 0.2% for AGIs $75k-100k, 0.1% for AGIs over 100k)
Taxable dividends: $1,019 (reported on 22.9% of returns)
Here:
$1,019
State:
$5,394
(% of AGI for various income ranges: 1.6% for AGIs below $10k, 0.7% for AGIs $10k-25k, 0.9% for AGIs $25k-50k, 0.4% for AGIs $50k-75k, 0.7% for AGIs $75k-100k)
Net capital gain/loss: +$816 (reported on 14.4% of returns)
Here:
+$816
State:
+$23,581
(% of AGI for various income ranges: -0.5% for AGIs $10k-25k, 0.7% for AGIs $25k-50k, 0.3% for AGIs $50k-75k, 0.5% for AGIs $75k-100k)
Profit/loss from business: +$2,256 (reported on 11.5% of returns)
Here:
+$2,256
State:
+$13,809
(% of AGI for various income ranges: 3.7% for AGIs $10k-25k, 1.4% for AGIs $25k-50k, -0.6% for AGIs $50k-75k, 0.3% for AGIs $75k-100k)
Profit/loss from farming: +$1,333 (reported on 1.8% of returns)
Here:
+$1,333
State:
-$2,666
IRA payment deduction: $2,333 (reported on 3.5% of returns)
14533:
$2,333
New York:
$3,115
Total itemized deductions: $13,554 (21% of AGI, reported on 31.3% of returns)
Here:
$13,554
State:
$25,864
Here:
21.0% of AGI
State:
21.9% of AGI
(% of AGI for various income ranges: 3.6% for AGIs $10k-25k, 11.9% for AGIs $25k-50k, 11.9% for AGIs $50k-75k, 12.6% for AGIs $75k-100k, 13.2% for AGIs over 100k)
Charity contributions deductions: $1,863 (3% of AGI, reported on 29.0% of returns)
Here:
$1,863
State:
$4,439
Here:
2.8% of AGI
State:
3.6% of AGI
(% of AGI for various income ranges: 1.7% for AGIs $25k-50k, 1.3% for AGIs $50k-75k, 1.4% for AGIs $75k-100k, 2.5% for AGIs over 100k)
Total tax: $4,264 (reported on 79.1% of returns)
14533:
$4,264
State:
$11,730
(% of AGI for various income ranges: 2.7% for AGIs below $10k, 4.3% for AGIs $10k-25k, 6.4% for AGIs $25k-50k, 8.3% for AGIs $50k-75k, 10.7% for AGIs $75k-100k, 17.6% for AGIs over 100k)
Earned income credit: $1,586 (reported on 12.8% of returns)
Here:
$1,586
State:
$1,757
Percentage of individuals using paid preparers for their 2004 taxes: 67.2%
Here:
67%
State:
67%
(% for various income ranges: 60.2% for AGIs below $10k, 64.7% for AGIs $10k-25k, 66.3% for AGIs $25k-50k, 71.1% for AGIs $50k-75k, 80.6% for AGIs $75k-100k, 71.4% for AGIs over 100k)
Household received Food Stamps/SNAP in the past 12 months: 71 Household did not receive Food Stamps/SNAP in the past 12 months: 722
Women who had a birth in the past 12 months: 23 (6 now married, 17 unmarried) Women who did not have a birth in the past 12 months: 292 (96 now married, 196 unmarried)
Housing units in zip code 14533 with a mortgage: 340 (63 second mortgage, 63 both second mortgage and home equity loan) Median monthly owner costs for units with a mortgage: $1,509 Median monthly owner costs for units without a mortgage: $663
Residents with income below the poverty level in 2022:
This zip code:
7.7%
Whole state:
14.3%
Residents with income below 50% of the poverty level in 2022:
This zip code:
3.3%
Whole state:
6.8%
Median number of rooms in houses and condos:
Here:
6.5
State:
6.3
Median number of rooms in apartments:
Here:
4.8
State:
3.8
Notable locations in this zip code not listed on our city pages
Notable locations in zip code 14533: York Town Wastewater Treatment Facility (A), Greigsville Station (B), McMillans Corners (C), The Forks (D), Walkers Corners (E), Retsofs Corners (F), Rippeys Corners (G), Bows Corners (H), Roots Corners (I), York Town Hall (J). Display/hide their locations on the map
Churches in zip code 14533 include: Holy Ground Ministries (A), York Baptist Church (B), York United Presbyterian Church (C). Display/hide their locations on the map
Cemeteries: Mount Pleasant Cemetery (1), Job Cemetery (2), York Cemetery (3), Greigsville Cemetery (4), Pleasant Valley Cemetery (5). Display/hide their locations on the map
In group quarters: 45 (-1 institutionalized population)
Size of family households: 216 2-persons, 96 3-persons, 131 4-persons, 36 5-persons, 13 7-or-more-persons
Size of nonfamily households: 275 1-person, 29 2-persons
188 married couples with children.
123 single-parent households (47 men, 76 women).
91.2% of residents of 14533 zip code speak English at home.
9.4% of residents speak Spanish at home (3% very well, 14% well, 33% not well, 50% not at all).
Foreign born population: 127 (7.1%) (0.0% of them are naturalized citizens)
:
7.1%
Whole state:
22.7%
103%Honduras
24%Irish
12%English
11%German
9%Scotch-Irish
8%Italian
7%American
3%Austrian
Year of entry for the foreign-born population
1522010 or later
02000 to 2009
01990 to 1999
0Before 1990
Facilities with environmental interests located in this zip code:
HAMLET FARM (3498 MAIN STREET in PIFFARD, NY)
STATE MASTER (New York facility tracking) - National Pollutant Discharge Elimination System Permit National Pollutant Discharge Elimination System NON-MAJOR (Tracking pollutant discharge elimination systems) - permit Business SIC classification: GENERAL FARMS, PRIMARILY LIVESTOCK AND ANIMAL SPECIALTIES Organizations: RICHARD/DAVID BARIE (CONTACT/OWNER)
Alternative names: HAMLET FARM LLC, RICHARD/DAVID/MARK BARIE & HOW
53.0%Utility gas
17.7%Bottled, tank, or LP gas
15.1%Fuel oil, kerosene, etc.
8.5%Electricity
2.4%Coal or coke
1.3%Wood
1.3%Solar energy
1.0%Other fuel
Population in 1990: 2,094. Population change in the 1990s: +226 (+10.8%).
Place of birth for U.S.-born residents:
This state: 1,475
Northeast: 63
Midwest: 44
South: 61
West: 10
73% of the 14533 zip code residents lived in the same house 5 years ago. Out of people who lived in different houses, 61% lived in this county. Out of people who lived in different counties, 50% lived in New York.
93% of the 14533 zip code residents lived in the same house 1 year ago. Out of people who lived in different houses, 40% moved from this county. Out of people who lived in different houses, 55% moved from different county within same state. Out of people who lived in different houses, 5% moved from abroad.
Private vs. public school enrollment:
Students in private schools in grades 1 to 8 (elementary and middle school):
Here:
0.0%
New York:
15.6%
Students in private schools in grades 9 to 12 (high school): 14
Here:
23.0%
New York:
15.0%
Students in private undergraduate colleges:
Here:
0.0%
New York:
39.2%
Occupation by median earnings in the past 12 months ($)
144,502Transportation occupations
107,015Management occupations
70,403Computer and mathematical occupations
60,163Health diagnosing and treating practitioners and other technical occupations
53,626Construction and extraction occupations
52,725Material moving occupations
Companies with federal contracts located in this zip code:
TABTRONICS INCORPORATED (2854 GENESEE STREET in PIFFARD, NY; small business)
$34,367 with Defense Logistics Agency for Miscellaneous Electric Power and Distribution Equipment. Signed on 2002-05-22. Completion date: 2002-09-11.
Top industries in this zip code by the number of employees in 2005:
Other Services (except Public Administration): Religious Organizations (20-49 employees: 1 establishment)
Accommodation and Food Services: Drinking Places (Alcoholic Beverages) (5-9: 1)
Construction: Site Preparation Contractors (5-9: 1)
Accommodation and Food Services: Full-Service Restaurants (5-9: 1)
Finance and Insurance: Credit Unions (5-9: 1)
People in group quarters in 2010:
27 people in other noninstitutional facilities
People in group quarters in 2000:
46 people in religious group quarters
Fatal accident statistics in 2012:
Fatal accident count: 1
Vehicles involved in fatal accidents: 1
Fatal accidents caused by drunken drivers: 1
Fatalities: 1
Persons involved in fatal accidents: 1
Pedestrians involved in fatal accidents: 0
Home Mortgage Disclosure Act Aggregated Statistics For Year 2009 (Based on 2 partial tracts)
A) FHA, FSA/RHS & VA Home Purchase Loans
B) Conventional Home Purchase Loans
C) Refinancings
D) Home Improvement Loans
F) Non-occupant Loans on < 5 Family Dwellings (A B C & D)
G) Loans On Manufactured Home Dwelling (A B C & D)
Number
Average Value
Number
Average Value
Number
Average Value
Number
Average Value
Number
Average Value
Number
Average Value
LOANS ORIGINATED
10
$85,184
9
$97,046
27
$93,109
8
$30,711
1
$129,390
2
$41,205
APPLICATIONS APPROVED, NOT ACCEPTED
1
$63,160
0
$0
2
$85,105
0
$0
0
$0
0
$0
APPLICATIONS DENIED
1
$80,100
2
$43,515
11
$115,670
4
$15,405
0
$0
2
$50,450
APPLICATIONS WITHDRAWN
0
$0
0
$0
17
$127,672
0
$0
0
$0
0
$0
FILES CLOSED FOR INCOMPLETENESS
0
$0
0
$0
2
$133,630
0
$0
0
$0
0
$0
Aggregated Statistics For Year 2008 (Based on 2 partial tracts)
A) FHA, FSA/RHS & VA Home Purchase Loans
B) Conventional Home Purchase Loans
C) Refinancings
D) Home Improvement Loans
F) Non-occupant Loans on < 5 Family Dwellings (A B C & D)
G) Loans On Manufactured Home Dwelling (A B C & D)
Number
Average Value
Number
Average Value
Number
Average Value
Number
Average Value
Number
Average Value
Number
Average Value
LOANS ORIGINATED
5
$74,864
15
$95,248
28
$109,891
8
$27,150
7
$95,614
3
$51,347
APPLICATIONS APPROVED, NOT ACCEPTED
1
$34,660
0
$0
4
$74,902
0
$0
0
$0
1
$34,660
APPLICATIONS DENIED
1
$78,560
4
$96,852
25
$112,172
10
$22,028
1
$57,770
1
$41,590
APPLICATIONS WITHDRAWN
1
$101,670
2
$48,525
11
$104,887
0
$0
2
$48,910
1
$48,520
FILES CLOSED FOR INCOMPLETENESS
0
$0
0
$0
2
$87,805
0
$0
1
$39,280
0
$0
Aggregated Statistics For Year 2007 (Based on 2 partial tracts)
A) FHA, FSA/RHS & VA Home Purchase Loans
B) Conventional Home Purchase Loans
C) Refinancings
D) Home Improvement Loans
E) Loans on Dwellings For 5+ Families
F) Non-occupant Loans on < 5 Family Dwellings (A B C & D)
G) Loans On Manufactured Home Dwelling (A B C & D)
Number
Average Value
Number
Average Value
Number
Average Value
Number
Average Value
Number
Average Value
Number
Average Value
Number
Average Value
LOANS ORIGINATED
5
$78,098
30
$92,475
29
$100,524
14
$41,701
1
$431,310
5
$80,254
4
$69,702
APPLICATIONS APPROVED, NOT ACCEPTED
1
$111,680
2
$115,915
7
$101,887
2
$68,165
0
$0
1
$90,880
1
$36,970
APPLICATIONS DENIED
0
$0
8
$80,871
25
$92,670
15
$21,514
0
$0
1
$38,510
1
$65,470
APPLICATIONS WITHDRAWN
0
$0
1
$101,670
12
$75,929
1
$7,700
0
$0
0
$0
0
$0
FILES CLOSED FOR INCOMPLETENESS
0
$0
1
$73,940
4
$81,448
1
$15,400
0
$0
0
$0
0
$0
Aggregated Statistics For Year 2006 (Based on 2 partial tracts)
A) FHA, FSA/RHS & VA Home Purchase Loans
B) Conventional Home Purchase Loans
C) Refinancings
D) Home Improvement Loans
E) Loans on Dwellings For 5+ Families
F) Non-occupant Loans on < 5 Family Dwellings (A B C & D)
G) Loans On Manufactured Home Dwelling (A B C & D)
Number
Average Value
Number
Average Value
Number
Average Value
Number
Average Value
Number
Average Value
Number
Average Value
Number
Average Value
LOANS ORIGINATED
11
$88,923
22
$111,084
28
$77,295
18
$19,554
1
$261,870
5
$85,492
7
$58,866
APPLICATIONS APPROVED, NOT ACCEPTED
1
$98,590
5
$100,126
6
$89,343
3
$30,807
0
$0
0
$0
2
$68,550
APPLICATIONS DENIED
1
$40,820
2
$60,460
40
$75,692
12
$36,906
0
$0
2
$59,690
2
$71,630
APPLICATIONS WITHDRAWN
0
$0
5
$44,364
21
$94,478
4
$41,782
0
$0
0
$0
0
$0
FILES CLOSED FOR INCOMPLETENESS
1
$105,520
1
$79,330
2
$158,660
1
$122,460
0
$0
0
$0
0
$0
Aggregated Statistics For Year 2005 (Based on 2 partial tracts)
A) FHA, FSA/RHS & VA Home Purchase Loans
B) Conventional Home Purchase Loans
C) Refinancings
D) Home Improvement Loans
E) Loans on Dwellings For 5+ Families
F) Non-occupant Loans on < 5 Family Dwellings (A B C & D)
G) Loans On Manufactured Home Dwelling (A B C & D)
Number
Average Value
Number
Average Value
Number
Average Value
Number
Average Value
Number
Average Value
Number
Average Value
Number
Average Value
LOANS ORIGINATED
7
$93,854
28
$101,336
38
$99,639
25
$34,659
0
$0
7
$109,919
5
$64,850
APPLICATIONS APPROVED, NOT ACCEPTED
2
$74,325
4
$62,772
9
$79,588
0
$0
0
$0
1
$51,600
3
$66,493
APPLICATIONS DENIED
1
$80,870
4
$48,908
60
$96,224
15
$30,911
0
$0
3
$63,413
4
$42,552
APPLICATIONS WITHDRAWN
1
$64,700
2
$170,985
37
$97,753
7
$49,183
2
$92,040
1
$50,060
3
$62,387
FILES CLOSED FOR INCOMPLETENESS
0
$0
1
$70,090
9
$110,396
0
$0
0
$0
0
$0
0
$0
Aggregated Statistics For Year 2004 (Based on 2 partial tracts)
A) FHA, FSA/RHS & VA Home Purchase Loans
B) Conventional Home Purchase Loans
C) Refinancings
D) Home Improvement Loans
F) Non-occupant Loans on < 5 Family Dwellings (A B C & D)
G) Loans On Manufactured Home Dwelling (A B C & D)
Number
Average Value
Number
Average Value
Number
Average Value
Number
Average Value
Number
Average Value
Number
Average Value
LOANS ORIGINATED
9
$91,054
28
$98,448
47
$80,314
16
$26,668
5
$53,144
2
$53,915
APPLICATIONS APPROVED, NOT ACCEPTED
1
$50,060
2
$60,845
14
$77,240
1
$10,780
0
$0
0
$0
APPLICATIONS DENIED
2
$45,440
2
$77,020
40
$79,022
9
$63,328
2
$125,930
2
$101,280
APPLICATIONS WITHDRAWN
2
$39,280
3
$162,257
34
$93,693
2
$56,995
2
$79,330
1
$9,240
FILES CLOSED FOR INCOMPLETENESS
0
$0
2
$102,820
8
$103,302
1
$13,860
0
$0
0
$0
Aggregated Statistics For Year 2003 (Based on 2 partial tracts)
A) FHA, FSA/RHS & VA Home Purchase Loans
B) Conventional Home Purchase Loans
C) Refinancings
D) Home Improvement Loans
E) Loans on Dwellings For 5+ Families
F) Non-occupant Loans on < 5 Family Dwellings (A B C & D)
Number
Average Value
Number
Average Value
Number
Average Value
Number
Average Value
Number
Average Value
Number
Average Value
LOANS ORIGINATED
6
$97,173
25
$104,562
86
$78,999
9
$18,313
1
$89,340
9
$77,704
APPLICATIONS APPROVED, NOT ACCEPTED
2
$117,455
5
$101,050
17
$82,230
0
$0
0
$0
0
$0
APPLICATIONS DENIED
2
$74,710
8
$62,001
42
$79,771
10
$18,947
0
$0
1
$24,650
APPLICATIONS WITHDRAWN
0
$0
4
$84,338
27
$80,643
1
$42,360
0
$0
2
$64,695
FILES CLOSED FOR INCOMPLETENESS
1
$68,550
1
$111,680
5
$105,056
1
$26,960
0
$0
0
$0
Aggregated Statistics For Year 1999 (Based on 1 partial tract)
A) FHA, FSA/RHS & VA Home Purchase Loans
B) Conventional Home Purchase Loans
C) Refinancings
D) Home Improvement Loans
F) Non-occupant Loans on < 5 Family Dwellings (A B C & D)


+$1,333
-$2,666
 Nearest zip codes: 14539, 14592, 14486, 14481, 14423, 14454.


