Estimated zip code population in 2022: 2,495 Zip code population in 2010: 2,865 Zip code population in 2000: 2,971
Houses and condos: 1,098 Renter-occupied apartments: 147
% of renters here:
14%
State:
46%
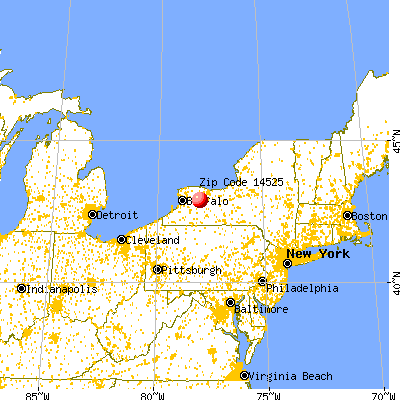
March 2022 cost of living index in zip code 14525: 93.8 (less than average, U.S. average is 100)
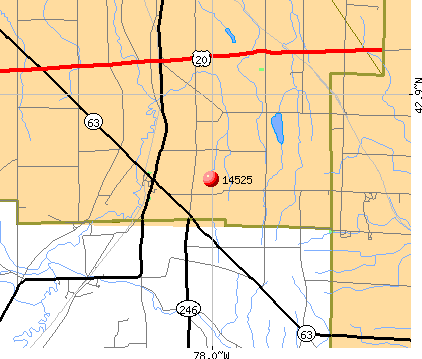
Land area: 45.6 sq. mi. Water area: 0.1 sq. mi.
Population density: 55 people per square mile
(very low).
OSM Map
General Map
Google Map
MSN Map
OSM Map
General Map
Google Map
MSN Map
OSM Map
General Map
Google Map
MSN Map
OSM Map
General Map
Google Map
MSN Map
Please wait while loading the map...
Real estate property taxes paid for housing units in 2022:
This zip code:
2.1% ($3,290)
New York:
1.5% ($6,180)
Median real estate property taxes paid for housing units with mortgages in 2022: $3,548 (2.1%) Median real estate property taxes paid for housing units with no mortgage in 2022: $3,193 (2.2%)
Business Search- 14 Million verified businesses
Males: 1,194
(47.8%)
Females: 1,301
(52.2%)
For population 25 years and over in 14525:
High school or higher: 96.0%
Bachelor's degree or higher: 27.9%
Graduate or professional degree: 12.4%
Unemployed: 4.7%
Mean travel time to work (commute): 21.4 minutes
For population 15 years and over in 14525:
Never married: 23.6%
Now married: 56.5%
Separated: 2.3%
Widowed: 4.1%
Divorced: 13.5%
Zip code 14525 compared to state average:
Median house value significantly below state average.
Black race population percentage significantly below state average.
Hispanic race population percentage significantly below state average.
Median age above state average.
Foreign-born population percentage significantly below state average.
Renting percentage significantly below state average.
Length of stay since moving in significantly above state average.
Estimated median house/condo value in 2022: $155,532
14525:
$155,532
New York:
$400,400
According to our research of New York and other state lists, there were 3 registered sex offenders living in 14525 zip code as of June 01, 2024. The ratio of all residents to sex offenders in zip code 14525 is 930 to 1. The ratio of registered sex offenders to all residents in this zip code is near the state average.
Median resident age:
This zip code:
44.3 years
New York median age:
40.0 years
Average household size:
This zip code:
2.4 people
New York:
2.5 people
Averages for the 2020 tax year for zip code 14525, filed in 2021:
Average Adjusted Gross Income (AGI) in 2020: $57,927 (Individual Income Tax Returns)
Here:
$57,927
State:
$90,930
Salary/wage: $50,191 (reported on 86.3% of returns)
Here:
$50,191
State:
$72,104
(% of AGI for various income ranges: 1167.0% for AGIs below $25k, 3290.0% for AGIs $25k-50k, 6203.7% for AGIs $50k-75k, 9515.8% for AGIs $75k-100k, 13170.8% for AGIs $100k-200k)
Taxable interest for individuals: $570 (reported on 41.2% of returns)
This zip code:
$570
New York:
$3,075
(% of AGI for various income ranges: 20.4% for AGIs below $25k, 21.0% for AGIs $25k-50k, 33.2% for AGIs $50k-75k, 41.7% for AGIs $75k-100k, 40.0% for AGIs $100k-200k)
Ordinary dividends: $1,560 (reported on 19.1% of returns)
Here:
$1,560
State:
$11,095
(% of AGI for various income ranges: 24.3% for AGIs below $25k, 44.5% for AGIs $25k-50k, 16.8% for AGIs $50k-75k, 52.5% for AGIs $75k-100k, 84.6% for AGIs $100k-200k)
Net capital gain/loss in AGI: +$7,145 (reported on 15.3% of returns)
Here:
+$7,145
State:
+$44,925
(% of AGI for various income ranges: 17.0% for AGIs below $25k, 30.3% for AGIs $25k-50k, 21.1% for AGIs $50k-75k, 323.3% for AGIs $75k-100k, 672.3% for AGIs $100k-200k)
Profit/loss from business: +$5,853 (reported on 13.0% of returns)
Here:
+$5,853
State:
+$14,940
(% of AGI for various income ranges: 65.7% for AGIs below $25k, 62.8% for AGIs $25k-50k, 88.4% for AGIs $50k-75k, 48.3% for AGIs $75k-100k, 335.4% for AGIs $100k-200k)
Taxable individual retirement arrangement distribution: $14,217 (reported on 9.2% of returns)
14525:
$14,217
New York:
$19,609
(% of AGI for various income ranges: 94.8% for AGIs below $25k, 128.6% for AGIs $25k-50k, 127.9% for AGIs $50k-75k, 429.2% for AGIs $75k-100k, 274.6% for AGIs $100k-200k)
Total itemized deductions: $21,667 (reported on 2.3% of returns)
Here:
$21,667
State:
$39,326
(% of AGI for various income ranges: 342.1% for AGIs $50k-75k)
Charity contributions: $7,200 (reported on 1.5% of returns)
Here:
$7,200
State:
$15,420
(% of AGI for various income ranges: 75.8% for AGIs $50k-75k)
Taxes paid: $7,467 (reported on 2.3% of returns)
14525:
$7,467
State:
$9,183
(% of AGI for various income ranges: 117.9% for AGIs $50k-75k)
Earned income credit: $2,243 (reported on 10.7% of returns)
Here:
$2,243
State:
$2,138
(% of AGI for various income ranges: 60.0% for AGIs below $25k, 60.7% for AGIs $25k-50k)
Percentage of individuals using paid preparers for their 2020 taxes: 96.2%
Here:
96%
State:
95%
(% for various income ranges: 94.3% for AGIs below $25k, 100.0% for AGIs $25k-50k, 95.8% for AGIs $50k-75k, 94.4% for AGIs $75k-100k, 94.4% for AGIs $100k-200k, 100.0% for AGIs over 200k)
Averages for the 2012 tax year for zip code 14525, filed in 2013:
Average Adjusted Gross Income (AGI) in 2012: $47,566 (Individual Income Tax Returns)
Here:
$47,566
State:
$77,088
Salary/wage: $41,041 (reported on 86.6% of returns)
Here:
$41,041
State:
$60,593
(% of AGI for various income ranges: 75.2% for AGIs below $25k, 85.8% for AGIs $25k-50k, 75.1% for AGIs $50k-75k, 78.4% for AGIs $75k-100k, 62.4% for AGIs $100k-200k)
Taxable interest for individuals: $698 (reported on 42.5% of returns)
This zip code:
$698
New York:
$3,125
(% of AGI for various income ranges: 1.5% for AGIs below $25k, 0.6% for AGIs $25k-50k, 0.5% for AGIs $50k-75k, 0.2% for AGIs $75k-100k, 0.7% for AGIs $100k-200k)
Ordinary dividends: $2,831 (reported on 19.4% of returns)
Here:
$2,831
State:
$10,299
(% of AGI for various income ranges: 0.7% for AGIs below $25k, 0.6% for AGIs $25k-50k, 0.5% for AGIs $50k-75k, 0.3% for AGIs $75k-100k, 3.1% for AGIs $100k-200k)
Net capital gain/loss in AGI: +$5,700 (reported on 14.2% of returns)
Here:
+$5,700
State:
+$42,474
(% of AGI for various income ranges: 0.4% for AGIs below $25k, 1.4% for AGIs $25k-50k, 1.8% for AGIs $50k-75k, 1.1% for AGIs $75k-100k, 2.9% for AGIs $100k-200k)
Profit/loss from business: +$5,938 (reported on 11.9% of returns)
Here:
+$5,938
State:
+$16,168
(% of AGI for various income ranges: 1.7% for AGIs below $25k, 1.8% for AGIs $25k-50k, 0.6% for AGIs $50k-75k, 3.9% for AGIs $75k-100k)
Taxable individual retirement arrangement distribution: $8,218 (reported on 8.2% of returns)
14525:
$8,218
New York:
$17,621
(% of AGI for various income ranges: 2.6% for AGIs below $25k, 1.1% for AGIs $25k-50k, 3.2% for AGIs $50k-75k, 1.0% for AGIs $75k-100k)
Total itemized deductions: $16,831 (19% of AGI, reported on 23.9% of returns)
Here:
$16,831
State:
$34,985
Here:
18.8% of AGI
State:
21.3% of AGI
(% of AGI for various income ranges: 5.7% for AGIs below $25k, 6.2% for AGIs $25k-50k, 7.1% for AGIs $50k-75k, 9.6% for AGIs $75k-100k, 11.5% for AGIs $100k-200k)
Charity contributions: $2,493 (reported on 20.1% of returns)
Here:
$2,493
State:
$5,572
(% of AGI for various income ranges: 0.3% for AGIs below $25k, 0.9% for AGIs $25k-50k, 1.1% for AGIs $50k-75k, 0.9% for AGIs $75k-100k, 1.5% for AGIs $100k-200k)
Taxes paid: $7,916 (reported on 23.9% of returns)
14525:
$7,916
State:
$18,656
(% of AGI for various income ranges: 1.8% for AGIs below $25k, 2.2% for AGIs $25k-50k, 3.2% for AGIs $50k-75k, 4.7% for AGIs $75k-100k, 6.2% for AGIs $100k-200k)
Earned income credit: $2,032 (reported on 14.2% of returns)
Here:
$2,032
State:
$2,230
(% of AGI for various income ranges: 4.2% for AGIs below $25k, 1.0% for AGIs $25k-50k)
Percentage of individuals using paid preparers for their 2012 taxes: 60.4%
Here:
60%
State:
66%
(% for various income ranges: 54.2% for AGIs below $25k, 58.3% for AGIs $25k-50k, 65.2% for AGIs $50k-75k, 68.8% for AGIs $75k-100k, 72.7% for AGIs $100k-200k)
Averages for the 2004 tax year for zip code 14525, filed in 2005:
Average Adjusted Gross Income (AGI) in 2004: $36,312 (Individual Income Tax Returns)
Here:
$36,312
State:
$59,519
Salary/wage: $34,199 (reported on 87.9% of returns)
Here:
$34,199
State:
$50,673
(% of AGI for various income ranges: 140.6% for AGIs below $10k, 73.0% for AGIs $10k-25k, 85.7% for AGIs $25k-50k, 87.2% for AGIs $50k-75k, 82.2% for AGIs $75k-100k, 69.1% for AGIs over 100k)
Taxable interest for individuals: $774 (reported on 50.8% of returns)
This zip code:
$774
New York:
$2,377
(% of AGI for various income ranges: 7.1% for AGIs below $10k, 2.5% for AGIs $10k-25k, 1.2% for AGIs $25k-50k, 0.6% for AGIs $50k-75k, 0.6% for AGIs $75k-100k, 0.5% for AGIs over 100k)
Taxable dividends: $963 (reported on 22.8% of returns)
Here:
$963
State:
$5,394
(% of AGI for various income ranges: 1.9% for AGIs below $10k, 1.2% for AGIs $10k-25k, 0.5% for AGIs $25k-50k, 0.4% for AGIs $50k-75k, 0.8% for AGIs $75k-100k, 0.5% for AGIs over 100k)
Net capital gain/loss: +$6,586 (reported on 16.8% of returns)
Here:
+$6,586
State:
+$23,581
(% of AGI for various income ranges: 14.8% for AGIs below $10k, 0.9% for AGIs $10k-25k, 1.4% for AGIs $25k-50k, 1.4% for AGIs $50k-75k, 2.9% for AGIs $75k-100k, 10.6% for AGIs over 100k)
Profit/loss from business: +$5,653 (reported on 13.0% of returns)
Here:
+$5,653
State:
+$13,809
(% of AGI for various income ranges: 3.7% for AGIs below $10k, 4.0% for AGIs $10k-25k, 1.9% for AGIs $25k-50k, 0.9% for AGIs $50k-75k, 3.9% for AGIs $75k-100k)
IRA payment deduction: $2,605 (reported on 3.3% of returns)
14525:
$2,605
New York:
$3,115
Total itemized deductions: $14,855 (22% of AGI, reported on 26.3% of returns)
Here:
$14,855
State:
$25,864
Here:
22.4% of AGI
State:
21.9% of AGI
(% of AGI for various income ranges: 6.4% for AGIs $10k-25k, 8.0% for AGIs $25k-50k, 11.6% for AGIs $50k-75k, 14.0% for AGIs $75k-100k, 14.9% for AGIs over 100k)
Charity contributions deductions: $2,069 (3% of AGI, reported on 23.2% of returns)
Here:
$2,069
State:
$4,439
Here:
3.1% of AGI
State:
3.6% of AGI
(% of AGI for various income ranges: 0.6% for AGIs $10k-25k, 1.0% for AGIs $25k-50k, 1.5% for AGIs $50k-75k, 1.7% for AGIs $75k-100k, 1.8% for AGIs over 100k)
Total tax: $4,059 (reported on 74.9% of returns)
14525:
$4,059
State:
$11,730
(% of AGI for various income ranges: 4.7% for AGIs below $10k, 4.5% for AGIs $10k-25k, 6.3% for AGIs $25k-50k, 7.8% for AGIs $50k-75k, 10.6% for AGIs $75k-100k, 14.6% for AGIs over 100k)
Earned income credit: $1,402 (reported on 14.4% of returns)
Here:
$1,402
State:
$1,757
Percentage of individuals using paid preparers for their 2004 taxes: 62.6%
Here:
63%
State:
67%
(% for various income ranges: 55.9% for AGIs below $10k, 57.7% for AGIs $10k-25k, 64.9% for AGIs $25k-50k, 67.1% for AGIs $50k-75k, 73.5% for AGIs $75k-100k, 71.7% for AGIs over 100k)
Likely homosexual households (counted as self-reported same-sex unmarried-partner households)
Lesbian couples: 0.0% of all households
Gay men: 0.5% of all households
Household received Food Stamps/SNAP in the past 12 months: 122 Household did not receive Food Stamps/SNAP in the past 12 months: 896
Women who had a birth in the past 12 months: 12 (4 now married, 8 unmarried) Women who did not have a birth in the past 12 months: 497 (251 now married, 243 unmarried)
Housing units in zip code 14525 with a mortgage: 513 (31 second mortgage, 26 both second mortgage and home equity loan) Houses without a mortgage: 76
Median monthly owner costs for units with a mortgage: $1,365 Median monthly owner costs for units without a mortgage: $658
Residents with income below the poverty level in 2022:
This zip code:
9.0%
Whole state:
14.3%
Residents with income below 50% of the poverty level in 2022:
This zip code:
5.6%
Whole state:
6.8%
Median number of rooms in houses and condos:
Here:
6.4
State:
6.3
Median number of rooms in apartments:
Here:
5.6
State:
3.8
Notable locations in this zip code not listed on our city pages
Notable locations in zip code 14525: Ayers Tree Farm (A), Allens Corners (B), Top Of World Gardens And Greenhouse (C), Bennetts Corners (D), Orrs Corners (E), Phelps Corners (F), Armson Farms (G), Quinlan Corners (H), Boyds Corners (I), Pavilion Fire Department (J). Display/hide their locations on the map
Churches in zip code 14525 include: Covington United Presbyterian Church (A), Saint Mary Church (B), Pavilion United Methodist Church (C). Display/hide their locations on the map
Cemeteries: Pavilion Center Cemetery (1), Oakta Valley Cemetery (2), Olivet Cemetery (3), Saint Marys Cemetery (4), Mount Nash Cemetery (5), Covington Center Pioneer Cemetery (6), Transit Cemetery (7). Display/hide their locations on the map
Size of family households: 347 2-persons, 130 3-persons, 128 4-persons, 38 5-persons, 35 6-persons, 19 7-or-more-persons
Size of nonfamily households: 217 1-person, 110 2-persons
373 married couples with children.
80 single-parent households (51 men, 29 women).
99.6% of residents of 14525 zip code speak English at home.
0.1% of residents speak other Indo-European language at home (100% very well).
Foreign born population: 79 (3.2%) (24.1% of them are naturalized citizens)
This zip code:
3.2%
Whole state:
22.7%
83%France
12%Belize
2%Sweden
22%German
16%Irish
12%English
11%Italian
8%American
8%Eastern European
3%Dutch
Year of entry for the foreign-born population
02010 or later
02000 to 2009
101990 to 1999
68Before 1990
Facilities with environmental interests located in this zip code:
HILDENE FARM (10972 ROANOKE ROAD in PAVILION, NY)
STATE MASTER (New York facility tracking) - National Pollutant Discharge Elimination System Permit National Pollutant Discharge Elimination System NON-MAJOR (Tracking pollutant discharge elimination systems) - permit Business SIC classification: GENERAL FARMS, PRIMARILY LIVESTOCK AND ANIMAL SPECIALTIES Organizations: DAVID/NOREEN TILLOTSON (CONTACT/OWNER)
, HILDENE FARMS INC (LEGALLY RESPONSIBLE PARTY)
Alternative names: DAVID/NOREEN TILLOTSON, HILDENE FARMS INC
COTTONWOOD FARMS (10771 COOK ROAD in PAVILION, NY)
STATE MASTER (New York facility tracking) - National Pollutant Discharge Elimination System Permit National Pollutant Discharge Elimination System NON-MAJOR (Tracking pollutant discharge elimination systems) - permit Business SIC classification: GENERAL FARMS, PRIMARILY LIVESTOCK AND ANIMAL SPECIALTIES Organizations: PAUL TILLOTSON (CONTACT/OWNER)
Alternative names: PAUL TILLOTSON
HANSON AGGREGATED BRD INC (6895 ELLICOTT ST in PAVILION, NY)
HAZARDOUS WASTE BIENNIAL REPORTER (Resource Conservation and Recovery Act (tracking hazardous waste)) Large Quantity Generators, more that 1000 kg of hazardous waste/month (Resource Conservation and Recovery Act (tracking hazardous waste)) Business NAICS classification: AUTOMOTIVE BODY, PAINT, AND INTERIOR REPAIR AND MAINTENANCE. Alternative names: B R DEWITT INC
GEORGE & SWEDE (ELLICOT ST in PAVILION, NY)
(Resource Conservation and Recovery Act (tracking hazardous waste))
GEORGE & SWEDE - SALES & SERVICE INC (7155 BIG TREE RD in PAVILION, NY)
(Resource Conservation and Recovery Act (tracking hazardous waste))
COVINGTON TOWN OF HIGHWAY DEPT (7083 COURT RD in PAVILION, NY)
Conditionally Exempt Small Quantity Generators, less than 100 kg/month of hazardous waste (Resource Conservation and Recovery Act (tracking hazardous waste)) - notification Organizations: TOWN OF COVINGTON (CONTACT/OWNER)
J D BUCKLEY & SON INCORPORATED (6905 ELLICOTT ST. RD. in PAVILION, NY)
TRI REPORTER (Tracking of toxic chemicals releasing facilities) Business SIC classification: FERTILIZERS, MIXING ONLY
Housing units lacking complete plumbing facilities: 0.5% Housing units lacking complete kitchen facilities: 1.5%
57.5%Utility gas
22.4%Bottled, tank, or LP gas
8.6%Fuel oil, kerosene, etc.
5.1%Other fuel
3.1%Wood
2.4%Coal or coke
1.2%Electricity
Population in 1990: 2,628. Population change in the 1990s: +343 (+13.1%).
Place of birth for U.S.-born residents:
This state: 2,241
Northeast: 48
Midwest: 77
South: 19
West: 19
69% of the 14525 zip code residents lived in the same house 5 years ago. Out of people who lived in different houses, 45% lived in this county. Out of people who lived in different counties, 50% lived in New York.
96% of the 14525 zip code residents lived in the same house 1 year ago. Out of people who lived in different houses, 59% moved from this county. Out of people who lived in different houses, 18% moved from different county within same state. Out of people who lived in different houses, 20% moved from different state.
Private vs. public school enrollment:
Students in private schools in grades 1 to 8 (elementary and middle school): 10
Here:
3.8%
New York:
15.6%
Students in private schools in grades 9 to 12 (high school): 5
Here:
4.6%
New York:
15.0%
Students in private undergraduate colleges: 33
Here:
45.5%
New York:
39.2%
Occupation by median earnings in the past 12 months ($)
136,825Law enforcement workers including supervisors
69,072Health diagnosing and treating practitioners and other technical occupations
62,313Education, training, and library occupations
61,189Business and financial operations occupations
54,697Material moving occupations
54,303Installation, maintenance, and repair occupations
Top industries in this zip code by the number of employees in 2005:
Construction: Poured Concrete Foundation and Structure Contractors (20-49 employees: 1 establishment)
Construction: Highway, Street, and Bridge Construction (10-19: 1)
Wholesale Trade: Wholesale Trade Agents and Brokers (10-19: 1)
Wholesale Trade: Construction and Mining (except Oil Well) Machinery and Equipment Merchant Wholesalers (10-19: 1)
Other Services (except Public Administration): Religious Organizations (1-4: 5)
Other Services (except Public Administration): General Automotive Repair (5-9: 1, 1-4: 1)
Fatal accident statistics in 2010:
Fatal accident count: 1
Vehicles involved in fatal accidents: 1
Fatal accidents caused by drunken drivers: 0
Fatalities: 1
Persons involved in fatal accidents: 1
Pedestrians involved in fatal accidents: 1
Home Mortgage Disclosure Act Aggregated Statistics For Year 2003 (Based on 2 partial tracts)
A) FHA, FSA/RHS & VA Home Purchase Loans
B) Conventional Home Purchase Loans
C) Refinancings
D) Home Improvement Loans
F) Non-occupant Loans on < 5 Family Dwellings (A B C & D)
Number
Average Value
Number
Average Value
Number
Average Value
Number
Average Value
Number
Average Value
LOANS ORIGINATED
5
$84,016
29
$94,999
80
$77,233
18
$14,207
1
$42,500
APPLICATIONS APPROVED, NOT ACCEPTED
2
$124,325
1
$100,590
11
$76,443
3
$24,793
0
$0
APPLICATIONS DENIED
2
$72,255
6
$55,963
44
$83,205
9
$16,687
2
$64,110
APPLICATIONS WITHDRAWN
1
$139,550
0
$0
28
$83,414
2
$31,880
1
$41,800
FILES CLOSED FOR INCOMPLETENESS
0
$0
1
$38,250
4
$66,945
1
$2,830
0
$0
Aggregated Statistics For Year 2002 (Based on 2 partial tracts)
A) FHA, FSA/RHS & VA Home Purchase Loans
B) Conventional Home Purchase Loans
C) Refinancings
D) Home Improvement Loans
F) Non-occupant Loans on < 5 Family Dwellings (A B C & D)
Number
Average Value
Number
Average Value
Number
Average Value
Number
Average Value
Number
Average Value
LOANS ORIGINATED
6
$89,730
19
$85,605
55
$76,443
9
$23,220
1
$26,920
APPLICATIONS APPROVED, NOT ACCEPTED
0
$0
1
$35,420
10
$86,000
2
$20,900
1
$51,000
APPLICATIONS DENIED
1
$48,170
6
$46,400
23
$69,854
6
$14,522
0
$0
APPLICATIONS WITHDRAWN
0
$0
1
$94,220
18
$77,294
4
$14,878
0
$0
FILES CLOSED FOR INCOMPLETENESS
0
$0
0
$0
3
$78,160
0
$0
0
$0
Aggregated Statistics For Year 2001 (Based on 2 partial tracts)
A) FHA, FSA/RHS & VA Home Purchase Loans
B) Conventional Home Purchase Loans
C) Refinancings
D) Home Improvement Loans
F) Non-occupant Loans on < 5 Family Dwellings (A B C & D)
Number
Average Value
Number
Average Value
Number
Average Value
Number
Average Value
Number
Average Value
LOANS ORIGINATED
6
$81,230
18
$75,641
53
$73,994
17
$9,626
1
$45,340
APPLICATIONS APPROVED, NOT ACCEPTED
0
$0
1
$113,340
9
$53,130
4
$34,002
0
$0
APPLICATIONS DENIED
1
$67,300
5
$66,732
30
$61,607
4
$13,815
1
$33,290
APPLICATIONS WITHDRAWN
0
$0
3
$67,063
43
$65,717
3
$11,570
0
$0
FILES CLOSED FOR INCOMPLETENESS
0
$0
1
$192,680
2
$75,800
1
$11,330
0
$0
Aggregated Statistics For Year 2000 (Based on 2 partial tracts)
A) FHA, FSA/RHS & VA Home Purchase Loans
B) Conventional Home Purchase Loans
C) Refinancings
D) Home Improvement Loans
F) Non-occupant Loans on < 5 Family Dwellings (A B C & D)
Number
Average Value
Number
Average Value
Number
Average Value
Number
Average Value
Number
Average Value
LOANS ORIGINATED
9
$68,951
21
$82,748
26
$43,240
21
$16,023
0
$0
APPLICATIONS APPROVED, NOT ACCEPTED
1
$46,050
5
$63,472
4
$57,735
5
$45,480
0
$0
APPLICATIONS DENIED
0
$0
14
$42,099
21
$57,853
9
$26,132
1
$58,090
APPLICATIONS WITHDRAWN
0
$0
1
$4,960
16
$48,569
0
$0
0
$0
FILES CLOSED FOR INCOMPLETENESS
0
$0
0
$0
2
$66,590
0
$0
0
$0
Aggregated Statistics For Year 1999 (Based on 1 partial tract)
A) FHA, FSA/RHS & VA Home Purchase Loans
B) Conventional Home Purchase Loans
C) Refinancings
D) Home Improvement Loans
F) Non-occupant Loans on < 5 Family Dwellings (A B C & D)
Detailed PMIC statistics for the following Tracts:9513.00
2002 - 2018 National Fire Incident Reporting System (NFIRS) incidents
Based on the data from the years 2002 - 2018 the average number of fires per year is 22. The highest number of fires - 39 took place in 2008, and the least - 5 in 2011. The data has a rising trend.
When looking into fire subcategories, the most incidents belonged to: Structure Fires (51.9%), and Outside Fires (26.0%).
Fire incident types reported to NFIRS in Zip Code 14525


 Nearest zip codes: 14486, 14591, 14143, 14482, 14592, 14054.


 Based on the data from the years 2002 - 2018 the average number of fires per year is 22. The highest number of fires - 39 took place in 2008, and the least - 5 in 2011. The data has a rising trend.
 When looking into fire subcategories, the most incidents belonged to: Structure Fires (51.9%), and Outside Fires (26.0%).