Estimated zip code population in 2022: 790 Zip code population in 2010: 655 Zip code population in 2000: 632
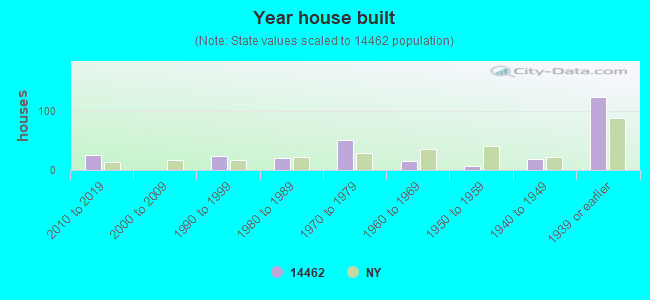
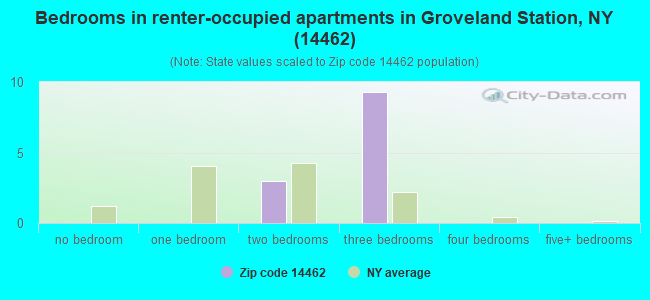
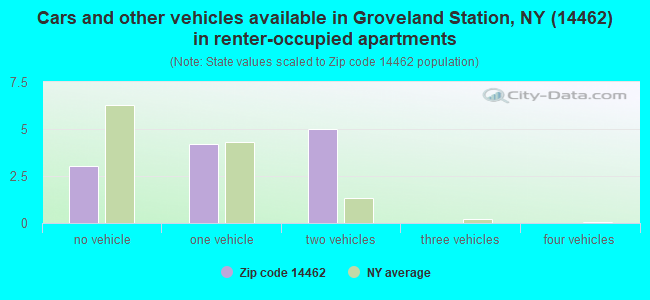
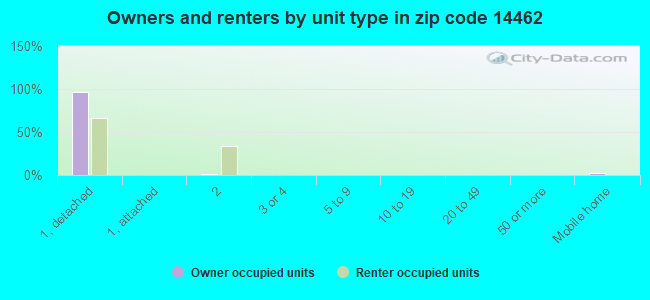
Houses and condos: 284 Renter-occupied apartments: 12
% of renters here:
4%
State:
46%
March 2022 cost of living index in zip code 14462: 94.0 (less than average, U.S. average is 100)
Land area: 12.0 sq. mi. Water area: 0.0 sq. mi.
Population density: 66 people per square mile
(very low).
OSM Map
General Map
Google Map
MSN Map
OSM Map
General Map
Google Map
MSN Map
OSM Map
General Map
Google Map
MSN Map
OSM Map
General Map
Google Map
MSN Map
Please wait while loading the map...
Real estate property taxes paid for housing units in 2022:
This zip code:
2.5% ($4,666)
New York:
1.5% ($6,180)
Median real estate property taxes paid for housing units with mortgages in 2022: $5,339 (2.9%) Median real estate property taxes paid for housing units with no mortgage in 2022: $3,365 (1.7%)
Business Search- 14 Million verified businesses
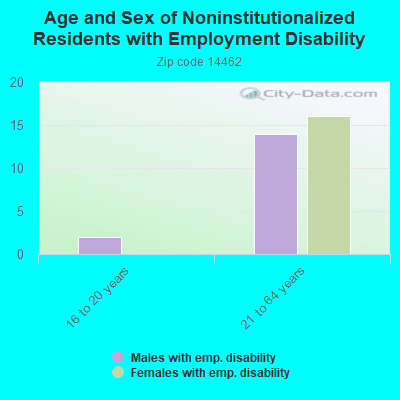
Males: 356
(45.1%)
Females: 433
(54.9%)
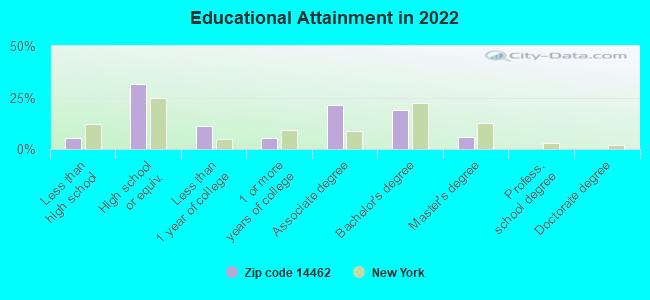
For population 25 years and over in 14462:
High school or higher: 93.9%
Bachelor's degree or higher: 24.9%
Graduate or professional degree: 6.0%
Unemployed: 3.3%
Mean travel time to work (commute): 26.6 minutes
For population 15 years and over in 14462:
Never married: 19.0%
Now married: 67.0%
Separated: 0.8%
Widowed: 2.8%
Divorced: 10.4%
Zip code 14462 compared to state average:
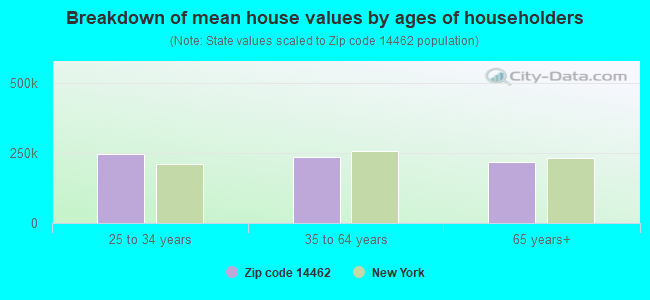
Median house value below state average.
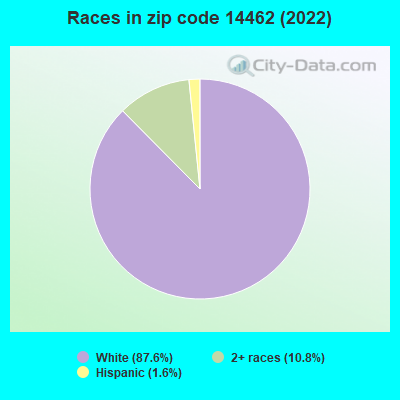
Black race population percentage significantly below state average.
Hispanic race population percentage significantly below state average.
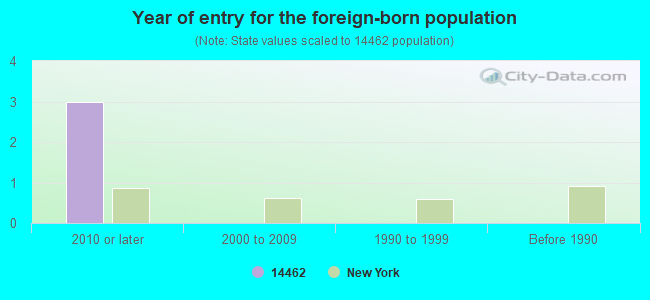
Foreign-born population percentage significantly below state average.
Renting percentage significantly below state average.
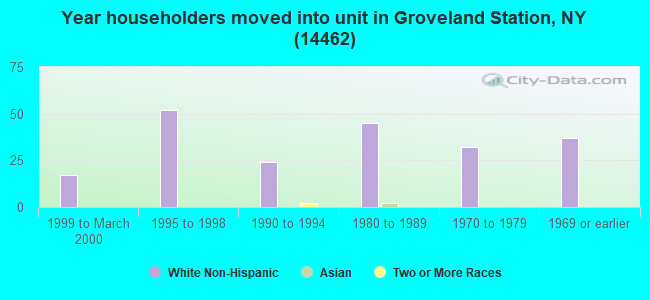
Length of stay since moving in significantly below state average.
Number of rooms per house above state average.
Percentage of population with a bachelor's degree or higher below state average.
Estimated median house/condo value in 2022: $189,619
14462:
$189,619
New York:
$400,400
According to our research of New York and other state lists, there was 1 registered sex offender living in 14462 zip code as of June 01, 2024. The ratio of all residents to sex offenders in zip code 14462 is 537 to 1.
Median resident age:
This zip code:
37.3 years
New York median age:
40.0 years
Average household size:
This zip code:
2.8 people
New York:
2.5 people
Averages for the 2020 tax year for zip code 14462, filed in 2021:
Average Adjusted Gross Income (AGI) in 2020: $53,410 (Individual Income Tax Returns)
Here:
$53,410
State:
$90,930
Salary/wage: $46,684 (reported on 80.6% of returns)
Here:
$46,684
State:
$72,104
(% of AGI for various income ranges: 1061.7% for AGIs below $25k, 2964.3% for AGIs $25k-50k, 3746.0% for AGIs $50k-75k, 14335.0% for AGIs $100k-200k)
Taxable interest for individuals: $175 (reported on 38.7% of returns)
This zip code:
$175
New York:
$3,075
(% of AGI for various income ranges: 15.0% for AGIs below $25k, 8.0% for AGIs $50k-75k, 12.5% for AGIs $100k-200k)
Ordinary dividends: $1,300 (reported on 16.1% of returns)
Here:
$1,300
State:
$11,095
(% of AGI for various income ranges: 58.3% for AGIs below $25k)
Net capital gain/loss in AGI: +$2,900 (reported on 12.9% of returns)
Here:
+$2,900
State:
+$44,925
(% of AGI for various income ranges: 165.7% for AGIs $25k-50k)
Profit/loss from business: +$9,950 (reported on 12.9% of returns)
Here:
+$9,950
State:
+$14,940
(% of AGI for various income ranges: 796.0% for AGIs $50k-75k)
Taxable individual retirement arrangement distribution: $11,667 (reported on 9.7% of returns)
14462:
$11,667
New York:
$19,609
(% of AGI for various income ranges: 583.3% for AGIs below $25k)
Earned income credit: $1,825 (reported on 12.9% of returns)
Here:
$1,825
State:
$2,138
(% of AGI for various income ranges: 121.7% for AGIs below $25k)
Percentage of individuals using paid preparers for their 2020 taxes: 90.3%
Here:
90%
State:
95%
(% for various income ranges: 88.9% for AGIs below $25k, 100.0% for AGIs $25k-50k, 80.0% for AGIs $50k-75k, 66.7% for AGIs $75k-100k, 100.0% for AGIs $100k-200k)
Averages for the 2012 tax year for zip code 14462, filed in 2013:
Average Adjusted Gross Income (AGI) in 2012: $49,367 (Individual Income Tax Returns)
Here:
$49,367
State:
$77,088
Salary/wage: $43,642 (reported on 86.7% of returns)
Here:
$43,642
State:
$60,593
(% of AGI for various income ranges: 71.2% for AGIs below $25k, 75.1% for AGIs $25k-50k, 76.6% for AGIs $50k-75k, 70.3% for AGIs $75k-100k, 84.4% for AGIs $100k-200k)
Taxable interest for individuals: $342 (reported on 40.0% of returns)
This zip code:
$342
New York:
$3,125
(% of AGI for various income ranges: 0.2% for AGIs below $25k, 0.3% for AGIs $25k-50k, 0.5% for AGIs $50k-75k, 0.3% for AGIs $100k-200k)
Ordinary dividends: $800 (reported on 20.0% of returns)
Here:
$800
State:
$10,299
Net capital gain/loss in AGI: +$133 (reported on 10.0% of returns)
Here:
+$133
State:
+$42,474
Profit/loss from business: +$5,225 (reported on 13.3% of returns)
Here:
+$5,225
State:
+$16,168
Taxable individual retirement arrangement distribution: $4,767 (reported on 10.0% of returns)
14462:
$4,767
New York:
$17,621
Total itemized deductions: $16,211 (20% of AGI, reported on 30.0% of returns)
Here:
$16,211
State:
$34,985
Here:
20.2% of AGI
State:
21.3% of AGI
(% of AGI for various income ranges: 16.1% for AGIs below $25k, 19.5% for AGIs $50k-75k, 12.7% for AGIs $100k-200k)
Charity contributions: $1,686 (reported on 23.3% of returns)
Here:
$1,686
State:
$5,572
Taxes paid: $7,200 (reported on 30.0% of returns)
14462:
$7,200
State:
$18,656
(% of AGI for various income ranges: 6.4% for AGIs below $25k, 7.3% for AGIs $50k-75k, 7.3% for AGIs $100k-200k)
Earned income credit: $2,100 (reported on 16.7% of returns)
Here:
$2,100
State:
$2,230
(% of AGI for various income ranges: 8.1% for AGIs below $25k)
Percentage of individuals using paid preparers for their 2012 taxes: 63.3%
Here:
63%
State:
66%
(% for various income ranges: 60.0% for AGIs below $25k, 57.1% for AGIs $25k-50k, 66.7% for AGIs $50k-75k, 75.0% for AGIs $75k-100k, 66.7% for AGIs $100k-200k)
Averages for the 2004 tax year for zip code 14462, filed in 2005:
Average Adjusted Gross Income (AGI) in 2004: $37,243 (Individual Income Tax Returns)
Here:
$37,243
State:
$59,519
Salary/wage: $33,057 (reported on 89.3% of returns)
Here:
$33,057
State:
$50,673
(% of AGI for various income ranges: 95.5% for AGIs below $10k, 74.1% for AGIs $10k-25k, 86.2% for AGIs $25k-50k, 81.1% for AGIs $50k-75k, 78.2% for AGIs $75k-100k, 58.7% for AGIs over 100k)
Taxable interest for individuals: $424 (reported on 52.1% of returns)
This zip code:
$424
New York:
$2,377
(% of AGI for various income ranges: 0.0% for AGIs below $10k, 1.0% for AGIs $10k-25k, 0.4% for AGIs $25k-50k, 0.2% for AGIs $50k-75k, 1.7% for AGIs $75k-100k)
Taxable dividends: $756 (reported on 24.6% of returns)
Here:
$756
State:
$5,394
(% of AGI for various income ranges: 1.0% for AGIs $10k-25k, 0.6% for AGIs $25k-50k, 0.3% for AGIs $50k-75k, 0.7% for AGIs $75k-100k)
Net capital gain/loss: +$83 (reported on 15.1% of returns)
Here:
+$83
State:
+$23,581
(% of AGI for various income ranges: -4.5% for AGIs below $10k, 0.0% for AGIs $25k-50k, 0.1% for AGIs $50k-75k, 0.5% for AGIs $75k-100k)
Profit/loss from business: +$2,229 (reported on 11.0% of returns)
Here:
+$2,229
State:
+$13,809
IRA payment deduction: $2,231 (reported on 4.1% of returns)
14462:
$2,231
New York:
$3,115
Total itemized deductions: $13,902 (22% of AGI, reported on 29.0% of returns)
Here:
$13,902
State:
$25,864
Here:
22.0% of AGI
State:
21.9% of AGI
Charity contributions deductions: $2,167 (3% of AGI, reported on 26.5% of returns)
Here:
$2,167
State:
$4,439
Here:
3.3% of AGI
State:
3.6% of AGI
Total tax: $3,897 (reported on 76.3% of returns)
14462:
$3,897
State:
$11,730
(% of AGI for various income ranges: 2.0% for AGIs below $10k, 3.8% for AGIs $10k-25k, 6.1% for AGIs $25k-50k, 7.9% for AGIs $50k-75k, 10.2% for AGIs $75k-100k, 15.0% for AGIs over 100k)
Earned income credit: $1,791 (reported on 13.6% of returns)
Here:
$1,791
State:
$1,757
Percentage of individuals using paid preparers for their 2004 taxes: 63.4%
Here:
63%
State:
67%
(% for various income ranges: 36.1% for AGIs below $10k, 72.2% for AGIs $10k-25k, 69.1% for AGIs $25k-50k, 60.0% for AGIs $50k-75k, 116.0% for AGIs $75k-100k)
Household received Food Stamps/SNAP in the past 12 months: 35 Household did not receive Food Stamps/SNAP in the past 12 months: 241
Women who had a birth in the past 12 months: 8 (8 now married, 0 unmarried) Women who did not have a birth in the past 12 months: 156 (86 now married, 69 unmarried)
Housing units in zip code 14462 with a mortgage: 171 (21 second mortgage, 21 both second mortgage and home equity loan) Houses without a mortgage: 10
Median monthly owner costs for units with a mortgage: $1,517 Median monthly owner costs for units without a mortgage: $594
Residents with income below the poverty level in 2022:
This zip code:
18.3%
Whole state:
14.3%
Residents with income below 50% of the poverty level in 2022:
This zip code:
15.6%
Whole state:
6.8%
Median number of rooms in houses and condos:
Here:
6.9
State:
6.3
Median number of rooms in apartments:
Here:
5.3
State:
3.8
Notable locations in this zip code not listed on our city pages
Churches in zip code 14462 include: Berean Bible Church (A), Groveland Federated Parish Church (B), Sparta First Presbyterian Church (C). Display/hide their locations on the map
Size of family households: 110 2-persons, 46 3-persons, 32 4-persons, 9 5-persons, 8 6-persons, 8 7-or-more-persons
Size of nonfamily households: 39 1-person, 19 2-persons, 1 3-persons
202 married couples with children.
3 single-parent households (3 men).
85.3% of residents of 14462 zip code speak English at home.
0.9% of residents speak Spanish at home (43% well, 57% not well).
13.6% of residents speak other Indo-European language at home (70% very well, 14% well, 16% not at all).
Foreign born population: 2 (0.4%) (0.0% of them are naturalized citizens)
:
0.4%
Whole state:
22.7%
150%Guyana
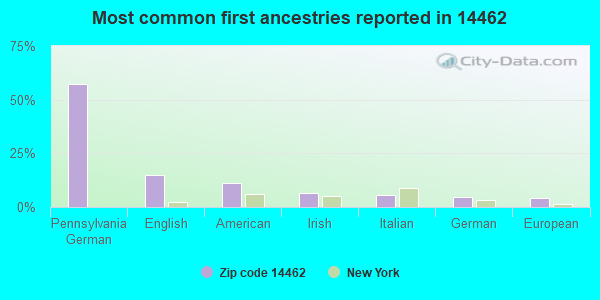
57%Pennsylvania German
15%English
11%American
6%Irish
5%Italian
5%German
4%European
Year of entry for the foreign-born population
32010 or later
02000 to 2009
01990 to 1999
0Before 1990
Facilities with environmental interests located in this zip code:
HAMPTON CORNERS MINE (ROUTE 63 in GROVELAND, NY)
STATE MASTER (New York facility tracking) - MINE OPERATING PERMIT, National Pollutant Discharge Elimination System Permit, SECTION 404 PERMITTING, National Pollutant Discharge Elimination System Permit National Pollutant Discharge Elimination System NON-MAJOR (Tracking pollutant discharge elimination systems) - permit Business SIC classification: CHEMICAL AND FERTILIZER MINERAL MINING Organizations: AMERICAN ROCK SALT CO, INC (CONTACT/OWNER)
, AKZO NOBEL SALT INC (LEGALLY RESPONSIBLE PARTY)
, AMERICAN ROCK SALT CO LLC (LEGALLY RESPONSIBLE PARTY)
Alternative names: AMERICAN ROCK SALT CO, INC
GROVELAND STATION WWTF (NYS ROUTE 63 in GROVELAND, NY)
National Pollutant Discharge Elimination System NON-MAJOR (Tracking pollutant discharge elimination systems) - permit Business SIC classification: SEWERAGE SYSTEMS Organizations: LIVINGSTON (C) WATER & SEWER (CONTACT/OWNER)
Alternative names: LIVINGSTON (C) WATER & SEWER
Housing units lacking complete plumbing facilities: 2.6% Housing units lacking complete kitchen facilities: 2.6%
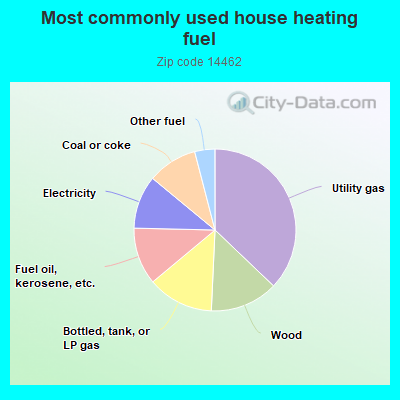
37.7%Utility gas
13.8%Wood
13.4%Bottled, tank, or LP gas
11.6%Fuel oil, kerosene, etc.
10.8%Electricity
10.1%Coal or coke
4.1%Other fuel
Population in 1990: 483. Population change in the 1990s: +149 (+30.8%).
Place of birth for U.S.-born residents:
This state: 723
Northeast: 6
Midwest: 16
South: 23
West: 14
71% of the 14462 zip code residents lived in the same house 5 years ago. Out of people who lived in different houses, 69% lived in this county. Out of people who lived in different counties, 50% lived in New York.
82% of the 14462 zip code residents lived in the same house 1 year ago. Out of people who lived in different houses, 38% moved from this county. Out of people who lived in different houses, 52% moved from different county within same state. Out of people who lived in different houses, 9% moved from different state.
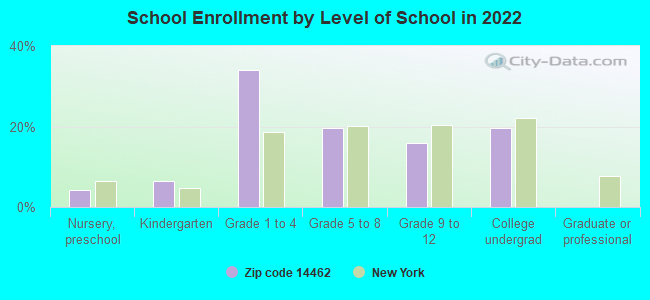
Private vs. public school enrollment:
Students in private schools in grades 1 to 8 (elementary and middle school): 59
Here:
57.4%
New York:
15.6%
Students in private schools in grades 9 to 12 (high school):
Here:
0.0%
New York:
15.0%
Students in private undergraduate colleges: 3
Here:
10.5%
New York:
39.2%
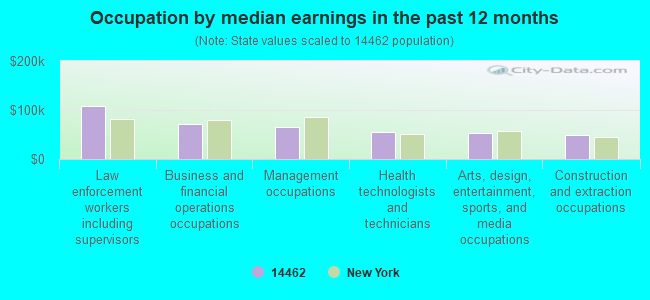
Occupation by median earnings in the past 12 months ($)
108,341Law enforcement workers including supervisors
71,251Business and financial operations occupations
64,288Management occupations
55,293Health technologists and technicians
52,622Arts, design, entertainment, sports, and media occupations
49,220Construction and extraction occupations
Top industries in this zip code by the number of employees in 2005:
Administrative and Support and Waste Management and Remediation Services: Landscaping Services (1-4 employees: 1 establishment)
Utilities: Water Supply and Irrigation Systems (1-4: 1)
Construction: Electrical Contractors (1-4: 1)
Educational Services: Sports and Recreation Instruction (1-4: 1)
Construction: Residential Remodelers (1-4: 1)
Construction: Site Preparation Contractors (1-4: 1)
Home Mortgage Disclosure Act Aggregated Statistics For Year 2009 (Based on 2 partial tracts)
A) FHA, FSA/RHS & VA Home Purchase Loans
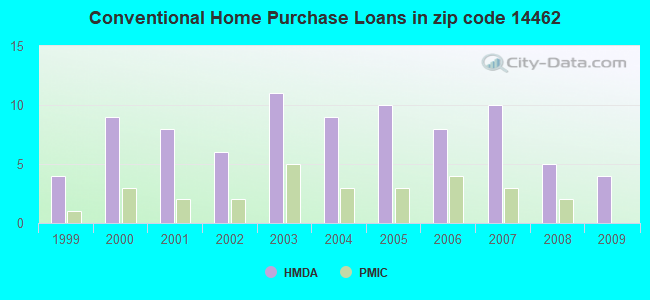
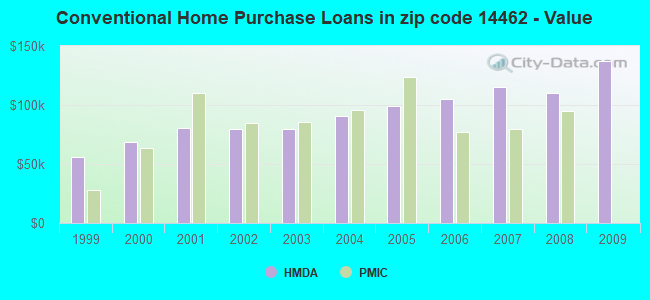
B) Conventional Home Purchase Loans
C) Refinancings
D) Home Improvement Loans
F) Non-occupant Loans on < 5 Family Dwellings (A B C & D)
G) Loans On Manufactured Home Dwelling (A B C & D)
Number
Average Value
Number
Average Value
Number
Average Value
Number
Average Value
Number
Average Value
Number
Average Value
LOANS ORIGINATED
3
$102,077
4
$137,328
10
$124,962
3
$10,053
2
$155,445
1
$104,640
APPLICATIONS APPROVED, NOT ACCEPTED
0
$0
0
$0
1
$103,830
0
$0
0
$0
0
$0
APPLICATIONS DENIED
0
$0
1
$63,150
3
$102,077
1
$15,580
0
$0
1
$3,440
APPLICATIONS WITHDRAWN
0
$0
1
$58,700
3
$130,077
1
$6,680
0
$0
0
$0
FILES CLOSED FOR INCOMPLETENESS
0
$0
0
$0
1
$142,690
0
$0
0
$0
0
$0
Aggregated Statistics For Year 2008 (Based on 2 partial tracts)
A) FHA, FSA/RHS & VA Home Purchase Loans
B) Conventional Home Purchase Loans
C) Refinancings
D) Home Improvement Loans
F) Non-occupant Loans on < 5 Family Dwellings (A B C & D)
G) Loans On Manufactured Home Dwelling (A B C & D)
Number
Average Value
Number
Average Value
Number
Average Value
Number
Average Value
Number
Average Value
Number
Average Value
LOANS ORIGINATED
3
$100,187
5
$109,944
7
$110,106
4
$48,678
1
$101,400
2
$65,580
APPLICATIONS APPROVED, NOT ACCEPTED
0
$0
1
$66,790
1
$152,000
0
$0
0
$0
0
$0
APPLICATIONS DENIED
0
$0
1
$42,100
9
$115,256
4
$67,248
1
$152,200
1
$44,330
APPLICATIONS WITHDRAWN
0
$0
1
$42,100
5
$97,760
0
$0
0
$0
0
$0
FILES CLOSED FOR INCOMPLETENESS
0
$0
0
$0
1
$77,110
0
$0
0
$0
0
$0
Aggregated Statistics For Year 2007 (Based on 2 partial tracts)
A) FHA, FSA/RHS & VA Home Purchase Loans
B) Conventional Home Purchase Loans
C) Refinancings
D) Home Improvement Loans
F) Non-occupant Loans on < 5 Family Dwellings (A B C & D)
G) Loans On Manufactured Home Dwelling (A B C & D)
Number
Average Value
Number
Average Value
Number
Average Value
Number
Average Value
Number
Average Value
Number
Average Value
LOANS ORIGINATED
2
$76,610
10
$115,145
9
$81,567
6
$30,360
3
$157,197
2
$59,405
APPLICATIONS APPROVED, NOT ACCEPTED
0
$0
1
$78,130
2
$91,485
1
$73,670
0
$0
0
$0
APPLICATIONS DENIED
0
$0
3
$102,820
14
$98,829
6
$30,967
1
$124,070
3
$50,397
APPLICATIONS WITHDRAWN
0
$0
0
$0
8
$90,448
0
$0
0
$0
0
$0
FILES CLOSED FOR INCOMPLETENESS
0
$0
0
$0
1
$152,810
0
$0
0
$0
0
$0
Aggregated Statistics For Year 2006 (Based on 2 partial tracts)
A) FHA, FSA/RHS & VA Home Purchase Loans
B) Conventional Home Purchase Loans
C) Refinancings
D) Home Improvement Loans
F) Non-occupant Loans on < 5 Family Dwellings (A B C & D)
G) Loans On Manufactured Home Dwelling (A B C & D)
Number
Average Value
Number
Average Value
Number
Average Value
Number
Average Value
Number
Average Value
Number
Average Value
LOANS ORIGINATED
2
$111,520
8
$105,375
14
$87,943
7
$18,766
3
$122,453
3
$68,883
APPLICATIONS APPROVED, NOT ACCEPTED
0
$0
2
$48,475
3
$80,420
1
$23,280
0
$0
1
$56,870
APPLICATIONS DENIED
0
$0
3
$79,273
19
$77,327
8
$31,954
1
$104,840
4
$57,835
APPLICATIONS WITHDRAWN
0
$0
2
$105,045
7
$75,697
2
$39,770
1
$59,300
1
$22,670
FILES CLOSED FOR INCOMPLETENESS
0
$0
0
$0
3
$124,947
0
$0
0
$0
0
$0
Aggregated Statistics For Year 2005 (Based on 2 partial tracts)
A) FHA, FSA/RHS & VA Home Purchase Loans
B) Conventional Home Purchase Loans
C) Refinancings
D) Home Improvement Loans
F) Non-occupant Loans on < 5 Family Dwellings (A B C & D)
G) Loans On Manufactured Home Dwelling (A B C & D)
Number
Average Value
Number
Average Value
Number
Average Value
Number
Average Value
Number
Average Value
Number
Average Value
LOANS ORIGINATED
2
$96,850
10
$99,095
13
$88,542
9
$23,816
2
$117,390
1
$106,460
APPLICATIONS APPROVED, NOT ACCEPTED
0
$0
1
$77,720
3
$74,010
1
$23,680
1
$53,230
0
$0
APPLICATIONS DENIED
0
$0
2
$74,485
18
$81,983
6
$31,338
2
$57,990
2
$51,510
APPLICATIONS WITHDRAWN
0
$0
1
$107,070
9
$80,442
2
$48,375
0
$0
0
$0
FILES CLOSED FOR INCOMPLETENESS
0
$0
1
$42,500
2
$162,630
0
$0
0
$0
0
$0
Aggregated Statistics For Year 2004 (Based on 2 partial tracts)
A) FHA, FSA/RHS & VA Home Purchase Loans
B) Conventional Home Purchase Loans
C) Refinancings
D) Home Improvement Loans
F) Non-occupant Loans on < 5 Family Dwellings (A B C & D)
G) Loans On Manufactured Home Dwelling (A B C & D)
Number
Average Value
Number
Average Value
Number
Average Value
Number
Average Value
Number
Average Value
Number
Average Value
LOANS ORIGINATED
2
$113,345
9
$90,788
16
$89,752
8
$20,190
2
$144,515
2
$61,730
APPLICATIONS APPROVED, NOT ACCEPTED
0
$0
1
$113,550
2
$99,175
0
$0
0
$0
0
$0
APPLICATIONS DENIED
0
$0
2
$72,865
18
$69,794
4
$40,430
0
$0
3
$55,793
APPLICATIONS WITHDRAWN
0
$0
1
$51,810
8
$84,982
1
$33,600
0
$0
0
$0
FILES CLOSED FOR INCOMPLETENESS
0
$0
0
$0
2
$155,545
1
$34,210
0
$0
0
$0
Aggregated Statistics For Year 2003 (Based on 2 partial tracts)
A) FHA, FSA/RHS & VA Home Purchase Loans
B) Conventional Home Purchase Loans
C) Refinancings
D) Home Improvement Loans
F) Non-occupant Loans on < 5 Family Dwellings (A B C & D)
Number
Average Value
Number
Average Value
Number
Average Value
Number
Average Value
Number
Average Value
LOANS ORIGINATED
2
$90,170
11
$79,616
27
$143,224
7
$18,360
3
$72,863
APPLICATIONS APPROVED, NOT ACCEPTED
0
$0
1
$62,140
4
$74,230
1
$23,680
0
$0
APPLICATIONS DENIED
0
$0
2
$30,765
17
$101,426
5
$14,614
0
$0
APPLICATIONS WITHDRAWN
0
$0
1
$58,290
9
$67,219
1
$28,340
0
$0
FILES CLOSED FOR INCOMPLETENESS
0
$0
0
$0
2
$137,025
0
$0
0
$0
Aggregated Statistics For Year 2002 (Based on 2 partial tracts)
A) FHA, FSA/RHS & VA Home Purchase Loans
B) Conventional Home Purchase Loans
C) Refinancings
D) Home Improvement Loans
F) Non-occupant Loans on < 5 Family Dwellings (A B C & D)
Number
Average Value
Number
Average Value
Number
Average Value
Number
Average Value
Number
Average Value
LOANS ORIGINATED
4
$81,518
6
$79,915
15
$83,672
4
$14,825
1
$104,030
APPLICATIONS APPROVED, NOT ACCEPTED
0
$0
1
$63,960
4
$79,795
1
$7,890
0
$0
APPLICATIONS DENIED
0
$0
2
$45,740
13
$63,195
4
$8,045
0
$0
APPLICATIONS WITHDRAWN
0
$0
1
$89,870
7
$75,380
1
$3,640
0
$0
FILES CLOSED FOR INCOMPLETENESS
0
$0
0
$0
2
$76,910
0
$0
0
$0
Aggregated Statistics For Year 2001 (Based on 2 partial tracts)
A) FHA, FSA/RHS & VA Home Purchase Loans
B) Conventional Home Purchase Loans
C) Refinancings
D) Home Improvement Loans
F) Non-occupant Loans on < 5 Family Dwellings (A B C & D)
Number
Average Value
Number
Average Value
Number
Average Value
Number
Average Value
Number
Average Value
LOANS ORIGINATED
4
$76,305
8
$80,505
10
$76,811
8
$12,549
2
$48,070
APPLICATIONS APPROVED, NOT ACCEPTED
0
$0
2
$62,135
2
$82,480
1
$21,660
0
$0
APPLICATIONS DENIED
1
$74,890
9
$46,530
14
$61,486
5
$11,902
0
$0
APPLICATIONS WITHDRAWN
0
$0
1
$113,950
10
$68,512
2
$10,725
0
$0
FILES CLOSED FOR INCOMPLETENESS
0
$0
0
$0
1
$64,770
0
$0
0
$0
Aggregated Statistics For Year 2000 (Based on 2 partial tracts)
A) FHA, FSA/RHS & VA Home Purchase Loans
B) Conventional Home Purchase Loans
C) Refinancings
D) Home Improvement Loans
F) Non-occupant Loans on < 5 Family Dwellings (A B C & D)
Number
Average Value
Number
Average Value
Number
Average Value
Number
Average Value
Number
Average Value
LOANS ORIGINATED
2
$85,010
9
$68,523
6
$52,320
6
$17,912
1
$46,150
APPLICATIONS APPROVED, NOT ACCEPTED
0
$0
4
$52,370
3
$32,923
2
$35,220
0
$0
APPLICATIONS DENIED
0
$0
14
$39,959
8
$44,401
3
$23,547
0
$0
APPLICATIONS WITHDRAWN
0
$0
1
$114,150
3
$34,880
0
$0
0
$0
FILES CLOSED FOR INCOMPLETENESS
0
$0
0
$0
1
$30,560
0
$0
0
$0
Aggregated Statistics For Year 1999 (Based on 1 partial tract)
A) FHA, FSA/RHS & VA Home Purchase Loans
B) Conventional Home Purchase Loans
C) Refinancings
D) Home Improvement Loans
F) Non-occupant Loans on < 5 Family Dwellings (A B C & D)

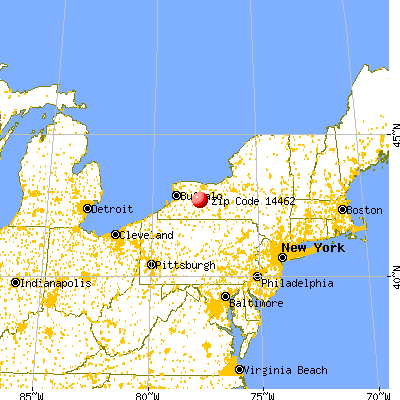


 Nearest zip codes: 14545, 14435, 14437, 14454, 14510, 14480.