Estimated zip code population in 2022: 1,333 Zip code population in 2010: 1,391 Zip code population in 2000: 1,319
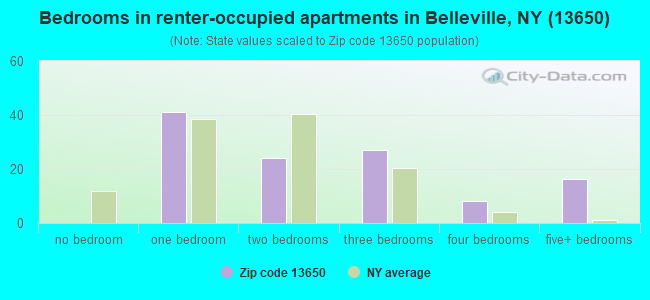
Houses and condos: 1,526 Renter-occupied apartments: 119
% of renters here:
20%
State:
46%
March 2022 cost of living index in zip code 13650: 93.7 (less than average, U.S. average is 100)
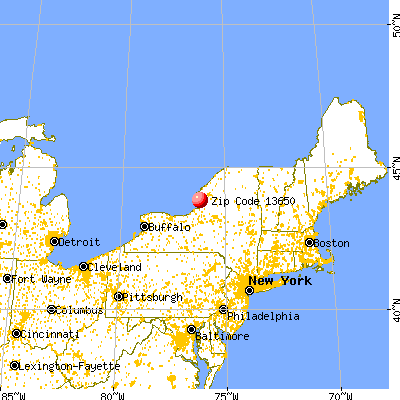
Land area: 41.3 sq. mi. Water area: 2.3 sq. mi.
Population density: 32 people per square mile
(very low).
OSM Map
General Map
Google Map
MSN Map
OSM Map
General Map
Google Map
MSN Map
OSM Map
General Map
Google Map
MSN Map
OSM Map
General Map
Google Map
MSN Map
Please wait while loading the map...
Real estate property taxes paid for housing units in 2022:
This zip code:
1.6% ($2,853)
New York:
1.5% ($6,180)
Median real estate property taxes paid for housing units with mortgages in 2022: $2,276 (1.2%) Median real estate property taxes paid for housing units with no mortgage in 2022: $3,085 (1.7%)
Business Search- 14 Million verified businesses
Males: 675
(50.6%)
Females: 658
(49.4%)
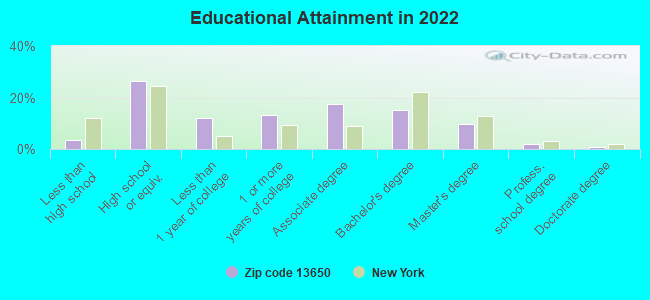
For population 25 years and over in 13650:
High school or higher: 95.7%
Bachelor's degree or higher: 27.4%
Graduate or professional degree: 12.4%
Unemployed: 9.2%
Mean travel time to work (commute): 25.5 minutes
For population 15 years and over in 13650:
Never married: 14.9%
Now married: 71.6%
Separated: 1.9%
Widowed: 4.6%
Divorced: 7.0%
Zip code 13650 compared to state average:
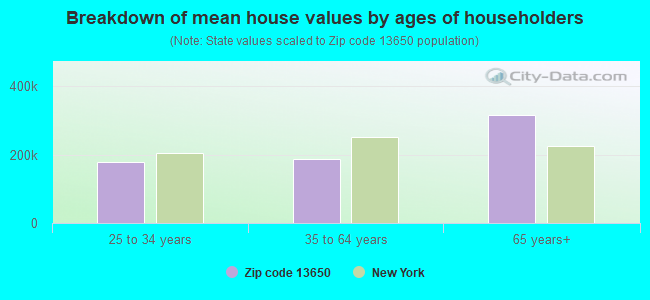
Median house value below state average.
Unemployed percentage above state average.
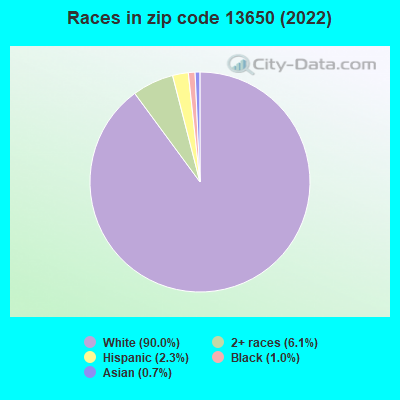
Black race population percentage significantly below state average.
Hispanic race population percentage significantly below state average.
Median age significantly above state average.
Foreign-born population percentage significantly below state average.
Renting percentage significantly below state average.
Length of stay since moving in significantly above state average.
Estimated median house/condo value in 2022: $180,029
13650:
$180,029
New York:
$400,400
According to our research of New York and other state lists, there was 1 registered sex offender living in 13650 zip code as of June 01, 2024. The ratio of all residents to sex offenders in zip code 13650 is 1,635 to 1. The ratio of registered sex offenders to all residents in this zip code is lower than the state average.
Median resident age:
This zip code:
55.6 years
New York median age:
40.0 years
Average household size:
This zip code:
2.2 people
New York:
2.5 people
Averages for the 2020 tax year for zip code 13650, filed in 2021:
Average Adjusted Gross Income (AGI) in 2020: $68,162 (Individual Income Tax Returns)
Here:
$68,162
State:
$90,930
Salary/wage: $53,813 (reported on 74.6% of returns)
Here:
$53,813
State:
$72,104
(% of AGI for various income ranges: 983.3% for AGIs below $25k, 3525.0% for AGIs $25k-50k, 5711.4% for AGIs $50k-75k, 7982.5% for AGIs $75k-100k, 21151.7% for AGIs $100k-200k)
Taxable interest for individuals: $468 (reported on 39.7% of returns)
This zip code:
$468
New York:
$3,075
(% of AGI for various income ranges: 13.3% for AGIs below $25k, 8.3% for AGIs $25k-50k, 35.7% for AGIs $50k-75k, 37.5% for AGIs $75k-100k, 85.0% for AGIs $100k-200k)
Ordinary dividends: $2,518 (reported on 17.5% of returns)
Here:
$2,518
State:
$11,095
(% of AGI for various income ranges: 27.5% for AGIs below $25k, 15.0% for AGIs $25k-50k, 104.3% for AGIs $50k-75k, 255.0% for AGIs $100k-200k)
Net capital gain/loss in AGI: +$6,044 (reported on 14.3% of returns)
Here:
+$6,044
State:
+$44,925
(% of AGI for various income ranges: 37.5% for AGIs below $25k, 208.6% for AGIs $50k-75k, 588.3% for AGIs $100k-200k)
Profit/loss from business: +$3,250 (reported on 12.7% of returns)
Here:
+$3,250
State:
+$14,940
(% of AGI for various income ranges: 265.0% for AGIs below $25k)
Taxable individual retirement arrangement distribution: $23,844 (reported on 14.3% of returns)
13650:
$23,844
New York:
$19,609
(% of AGI for various income ranges: 155.0% for AGIs below $25k, 1028.6% for AGIs $50k-75k, 2066.7% for AGIs $100k-200k)
Total itemized deductions: $28,233 (reported on 4.8% of returns)
Here:
$28,233
State:
$39,326
(% of AGI for various income ranges: 2117.5% for AGIs $75k-100k)
Taxes paid: $8,133 (reported on 4.8% of returns)
13650:
$8,133
State:
$9,183
(% of AGI for various income ranges: 610.0% for AGIs $75k-100k)
Earned income credit: $2,140 (reported on 15.9% of returns)
Here:
$2,140
State:
$2,138
(% of AGI for various income ranges: 106.7% for AGIs below $25k, 71.7% for AGIs $25k-50k)
Percentage of individuals using paid preparers for their 2020 taxes: 96.8%
Here:
97%
State:
95%
(% for various income ranges: 94.7% for AGIs below $25k, 100.0% for AGIs $25k-50k, 100.0% for AGIs $50k-75k, 85.7% for AGIs $75k-100k, 122.2% for AGIs $100k-200k, 0.0% for AGIs over 200k)
Averages for the 2012 tax year for zip code 13650, filed in 2013:
Average Adjusted Gross Income (AGI) in 2012: $49,202 (Individual Income Tax Returns)
Here:
$49,202
State:
$77,088
Salary/wage: $38,715 (reported on 77.0% of returns)
Here:
$38,715
State:
$60,593
(% of AGI for various income ranges: 63.7% for AGIs below $25k, 73.8% for AGIs $25k-50k, 72.1% for AGIs $50k-75k, 65.5% for AGIs $75k-100k, 46.9% for AGIs $100k-200k)
Taxable interest for individuals: $313 (reported on 37.7% of returns)
This zip code:
$313
New York:
$3,125
(% of AGI for various income ranges: 0.3% for AGIs below $25k, 0.2% for AGIs $25k-50k, 0.2% for AGIs $75k-100k, 0.3% for AGIs $100k-200k)
Ordinary dividends: $1,940 (reported on 16.4% of returns)
Here:
$1,940
State:
$10,299
(% of AGI for various income ranges: 1.6% for AGIs below $25k, 0.4% for AGIs $50k-75k, 1.1% for AGIs $100k-200k)
Net capital gain/loss in AGI: +$12,886 (reported on 11.5% of returns)
Here:
+$12,886
State:
+$42,474
(% of AGI for various income ranges: 0.2% for AGIs below $25k, 0.9% for AGIs $50k-75k, 7.2% for AGIs $100k-200k)
Profit/loss from business: +$8,129 (reported on 11.5% of returns)
Here:
+$8,129
State:
+$16,168
(% of AGI for various income ranges: 6.3% for AGIs below $25k, 4.7% for AGIs $25k-50k, 2.5% for AGIs $50k-75k)
Taxable individual retirement arrangement distribution: $9,829 (reported on 11.5% of returns)
13650:
$9,829
New York:
$17,621
Total itemized deductions: $18,736 (19% of AGI, reported on 23.0% of returns)
Here:
$18,736
State:
$34,985
Here:
18.5% of AGI
State:
21.3% of AGI
(% of AGI for various income ranges: 9.2% for AGIs $25k-50k, 15.5% for AGIs $50k-75k, 11.1% for AGIs $100k-200k)
Charity contributions: $2,320 (reported on 16.4% of returns)
Here:
$2,320
State:
$5,572
(% of AGI for various income ranges: 0.9% for AGIs below $25k, 1.5% for AGIs $50k-75k, 1.1% for AGIs $100k-200k)
Taxes paid: $9,250 (reported on 23.0% of returns)
13650:
$9,250
State:
$18,656
(% of AGI for various income ranges: 3.5% for AGIs $25k-50k, 6.4% for AGIs $50k-75k, 6.5% for AGIs $100k-200k)
Earned income credit: $2,440 (reported on 16.4% of returns)
Here:
$2,440
State:
$2,230
(% of AGI for various income ranges: 5.9% for AGIs below $25k, 1.3% for AGIs $25k-50k)
Percentage of individuals using paid preparers for their 2012 taxes: 57.4%
Here:
57%
State:
66%
(% for various income ranges: 44.0% for AGIs below $25k, 60.0% for AGIs $25k-50k, 66.7% for AGIs $50k-75k, 80.0% for AGIs $75k-100k, 71.4% for AGIs $100k-200k)
Averages for the 2004 tax year for zip code 13650, filed in 2005:
Average Adjusted Gross Income (AGI) in 2004: $36,075 (Individual Income Tax Returns)
Here:
$36,075
State:
$59,519
Salary/wage: $33,457 (reported on 78.4% of returns)
Here:
$33,457
State:
$50,673
(% of AGI for various income ranges: 84.6% for AGIs below $10k, 61.7% for AGIs $10k-25k, 70.9% for AGIs $25k-50k, 77.4% for AGIs $50k-75k, 80.7% for AGIs $75k-100k, 67.9% for AGIs over 100k)
Taxable interest for individuals: $946 (reported on 46.9% of returns)
This zip code:
$946
New York:
$2,377
(% of AGI for various income ranges: 4.0% for AGIs below $10k, 2.9% for AGIs $10k-25k, 0.8% for AGIs $25k-50k, 0.4% for AGIs $50k-75k, 0.2% for AGIs $75k-100k, 2.2% for AGIs over 100k)
Taxable dividends: $1,598 (reported on 21.3% of returns)
Here:
$1,598
State:
$5,394
(% of AGI for various income ranges: 2.0% for AGIs below $10k, 1.9% for AGIs $10k-25k, 1.4% for AGIs $25k-50k, 0.1% for AGIs $50k-75k, 0.3% for AGIs $75k-100k, 1.1% for AGIs over 100k)
Net capital gain/loss: +$1,529 (reported on 15.8% of returns)
Here:
+$1,529
State:
+$23,581
(% of AGI for various income ranges: -0.6% for AGIs below $10k, 3.4% for AGIs $10k-25k, 0.3% for AGIs $25k-50k, -0.2% for AGIs $50k-75k, 1.3% for AGIs $75k-100k, -0.1% for AGIs over 100k)
Profit/loss from business: +$3,571 (reported on 12.7% of returns)
Here:
+$3,571
State:
+$13,809
(% of AGI for various income ranges: 5.2% for AGIs below $10k, 4.9% for AGIs $10k-25k, 2.1% for AGIs $25k-50k, -0.2% for AGIs $50k-75k)
Profit/loss from farming: +$4,000 (reported on 3.3% of returns)
Here:
+$4,000
State:
-$2,666
Total itemized deductions: $15,509 (21% of AGI, reported on 21.1% of returns)
Here:
$15,509
State:
$25,864
Here:
21.3% of AGI
State:
21.9% of AGI
(% of AGI for various income ranges: 6.6% for AGIs $10k-25k, 6.4% for AGIs $25k-50k, 8.8% for AGIs $50k-75k, 13.6% for AGIs $75k-100k, 11.8% for AGIs over 100k)
Charity contributions deductions: $1,909 (2% of AGI, reported on 18.0% of returns)
Here:
$1,909
State:
$4,439
Here:
2.5% of AGI
State:
3.6% of AGI
(% of AGI for various income ranges: 1.8% for AGIs below $10k, 1.2% for AGIs $25k-50k, 0.5% for AGIs $50k-75k, 1.5% for AGIs $75k-100k, 1.3% for AGIs over 100k)
Total tax: $4,712 (reported on 72.7% of returns)
13650:
$4,712
State:
$11,730
(% of AGI for various income ranges: 2.4% for AGIs below $10k, 3.8% for AGIs $10k-25k, 6.3% for AGIs $25k-50k, 8.4% for AGIs $50k-75k, 10.4% for AGIs $75k-100k, 19.0% for AGIs over 100k)
Earned income credit: $1,738 (reported on 15.3% of returns)
Here:
$1,738
State:
$1,757
Percentage of individuals using paid preparers for their 2004 taxes: 63.1%
Here:
63%
State:
67%
(% for various income ranges: 56.7% for AGIs below $10k, 67.9% for AGIs $10k-25k, 62.2% for AGIs $25k-50k, 61.8% for AGIs $50k-75k, 62.5% for AGIs $75k-100k, 73.9% for AGIs over 100k)
Household received Food Stamps/SNAP in the past 12 months: 80 Household did not receive Food Stamps/SNAP in the past 12 months: 510
Women who had a birth in the past 12 months: 19 (0 now married, 20 unmarried) Women who did not have a birth in the past 12 months: 162 (117 now married, 42 unmarried)
Housing units in zip code 13650 with a mortgage: 192 (21 second mortgage, 21 both second mortgage and home equity loan) Houses without a mortgage: 34
Median monthly owner costs for units with a mortgage: $1,371 Median monthly owner costs for units without a mortgage: $598
Residents with income below the poverty level in 2022:
This zip code:
18.4%
Whole state:
14.3%
Residents with income below 50% of the poverty level in 2022:
This zip code:
5.3%
Whole state:
6.8%
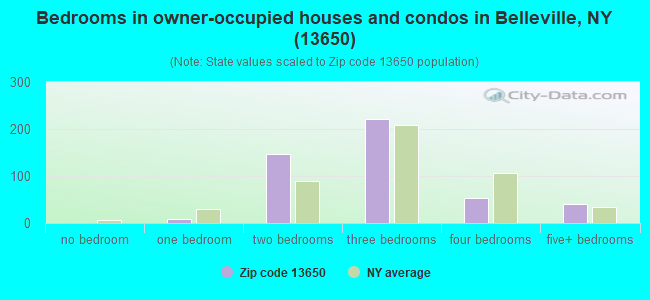
Median number of rooms in houses and condos:
Here:
6.1
State:
6.3
Median number of rooms in apartments:
Here:
4.5
State:
3.8
Notable locations in this zip code not listed on our city pages
Notable locations in zip code 13650: Scotts Corners (A), Aspinwall Corners (B), Stony Point Light (C), Alexander Corners (D), Hammond Corners (E), Stony Point Rifle Range (F), Stony Point Light House (G), Dodge Farms (H), Bonnyland Farms (I), Eastman Farms (J), Henderson Fire District Building (K), Belleville Fire Department (L). Display/hide their locations on the map
Size of family households: 320 2-persons, 98 3-persons, 24 4-persons, 20 5-persons, 10 6-persons, 8 7-or-more-persons
Size of nonfamily households: 100 1-person, 7 2-persons
107 married couples with children.
73 single-parent households (40 men, 33 women).
98.4% of residents of 13650 zip code speak English at home.
2.2% of residents speak Spanish at home (93% very well, 7% well).
0.3% of residents speak other Indo-European language at home (100% very well).
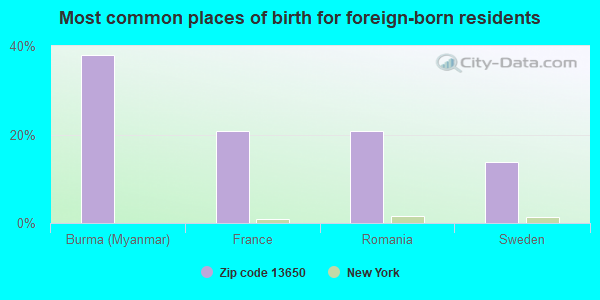
Foreign born population: 29 (2.2%) (61.2% of them are naturalized citizens)
This zip code:
2.2%
Whole state:
22.7%
38%Burma (Myanmar)
21%France
21%Romania
14%Sweden
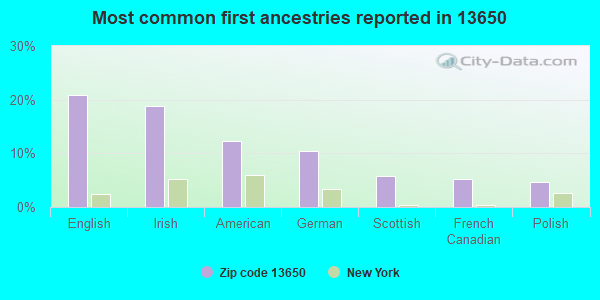
21%English
19%Irish
12%American
10%German
6%Scottish
5%French Canadian
5%Polish
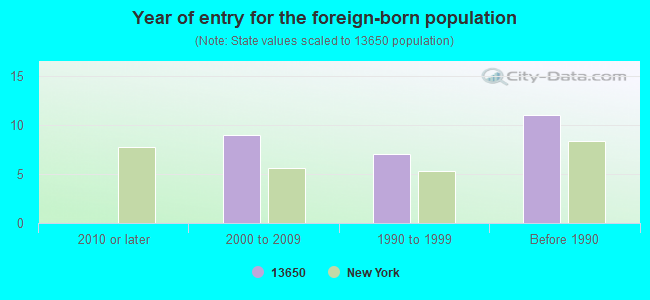
Year of entry for the foreign-born population
02010 or later
92000 to 2009
71990 to 1999
11Before 1990
Facilities with environmental interests located in this zip code:
BELLEVILLE HENDERSON CSD (MAIN ST 2737 NY 178 in HENDERSON, NY)
(Resource Conservation and Recovery Act (tracking hazardous waste))
Housing units lacking complete plumbing facilities: 4.1% Housing units lacking complete kitchen facilities: 3.9%
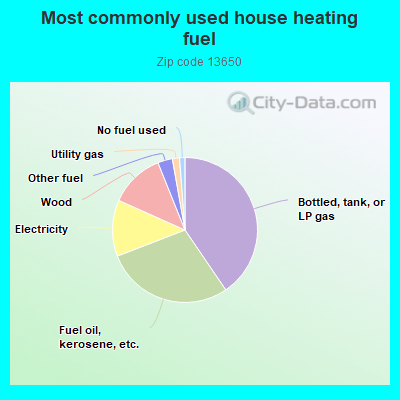
40.7%Bottled, tank, or LP gas
28.8%Fuel oil, kerosene, etc.
12.6%Electricity
12.3%Wood
3.3%Other fuel
1.6%Utility gas
1.2%No fuel used
Population in 1990: 300. Population change in the 1990s: +1,019 (+339.7%).
Place of birth for U.S.-born residents:
This state: 1,056
Northeast: 150
Midwest: 24
South: 39
West: 29
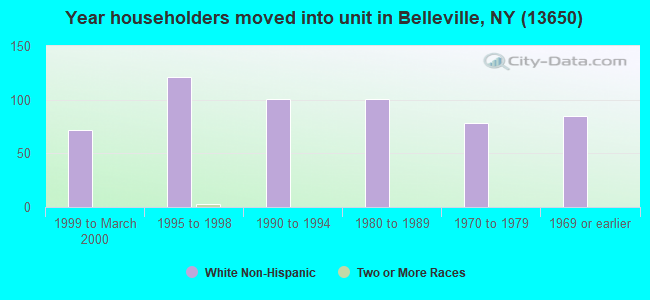
70% of the 13650 zip code residents lived in the same house 5 years ago. Out of people who lived in different houses, 59% lived in this county. Out of people who lived in different counties, 50% lived in New York.
92% of the 13650 zip code residents lived in the same house 1 year ago. Out of people who lived in different houses, 52% moved from this county. Out of people who lived in different houses, 14% moved from different county within same state. Out of people who lived in different houses, 33% moved from different state.
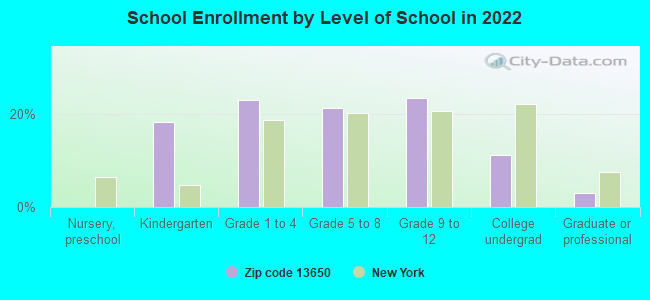
Private vs. public school enrollment:
Students in private schools in grades 1 to 8 (elementary and middle school): 42
Here:
42.0%
New York:
15.6%
Students in private schools in grades 9 to 12 (high school): 18
Here:
34.7%
New York:
15.0%
Students in private undergraduate colleges: 1
Here:
7.7%
New York:
39.2%
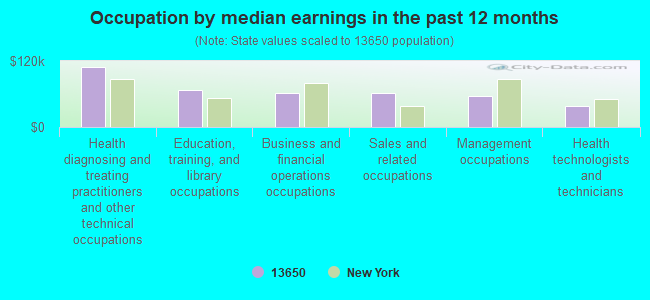
Occupation by median earnings in the past 12 months ($)
109,643Health diagnosing and treating practitioners and other technical occupations
67,901Education, training, and library occupations
62,311Business and financial operations occupations
61,771Sales and related occupations
55,989Management occupations
38,167Health technologists and technicians
Top industries in this zip code by the number of employees in 2005:
Construction: Plumbing, Heating, and Air-Conditioning Contractors (5-9 employees: 1 establishment)
Mining: Crushed and Broken Limestone Mining and Quarrying (5-9: 1)
Accommodation and Food Services: Drinking Places (Alcoholic Beverages) (1-4: 3)
Real Estate and Rental and Leasing: Offices of Real Estate Agents and Brokers (1-4: 1)
Construction: Site Preparation Contractors (1-4: 1)
Construction: New Single-Family Housing Construction (except Operative Builders) (1-4: 1)
Accommodation and Food Services: Full-Service Restaurants (1-4: 1)
Professional, Scientific, and Technical Services: Administrative Management and General Management Consulting Services (1-4: 1)
Construction: Water and Sewer Line and Related Structures Construction (1-4: 1)
Finance and Insurance: Investment Advice (1-4: 1)
Fatal accident statistics in 2013:
Fatal accident count: 1
Vehicles involved in fatal accidents: 2
Fatal accidents caused by drunken drivers: 1
Fatalities: 1
Persons involved in fatal accidents: 6
Pedestrians involved in fatal accidents: 0
Fatal accident statistics in 2012:
Fatal accident count: 1
Vehicles involved in fatal accidents: 1
Fatal accidents caused by drunken drivers: 1
Fatalities: 1
Persons involved in fatal accidents: 2
Pedestrians involved in fatal accidents: 0
2002 - 2018 National Fire Incident Reporting System (NFIRS) incidents
Based on the data from the years 2002 - 2018 the average number of fires per year is 7. The highest number of fires - 16 took place in 2012, and the least - 0 in 2003. The data has a growing trend.
When looking into fire subcategories, the most incidents belonged to: Structure Fires (44.5%), and Outside Fires (40.3%).
Fire incident types reported to NFIRS in Zip Code 13650


+$4,000
-$2,666
 Nearest zip codes: 13651, 13636, 13661, 13605, 13685, 13693.


 Based on the data from the years 2002 - 2018 the average number of fires per year is 7. The highest number of fires - 16 took place in 2012, and the least - 0 in 2003. The data has a growing trend.
 When looking into fire subcategories, the most incidents belonged to: Structure Fires (44.5%), and Outside Fires (40.3%).