Estimated zip code population in 2022: 3,053 Zip code population in 2010: 3,305 Zip code population in 2000: 3,180
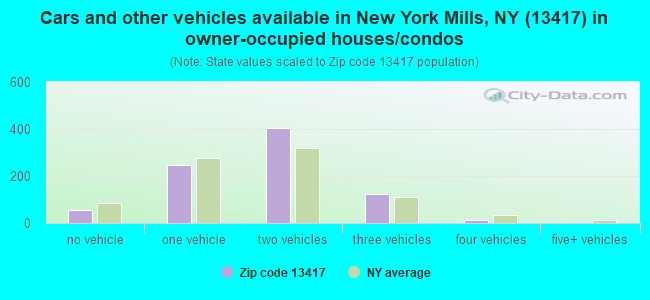
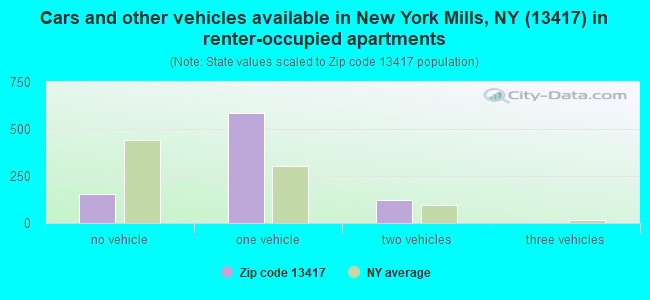
Houses and condos: 1,885 Renter-occupied apartments: 851
% of renters here:
50%
State:
46%
March 2022 cost of living index in zip code 13417: 99.5 (near average, U.S. average is 100)
Land area: 1.3 sq. mi. Water area: 0.0 sq. mi.
Population density: 2,341 people per square mile
(low).
OSM Map
General Map
Google Map
MSN Map
OSM Map
General Map
Google Map
MSN Map
OSM Map
General Map
Google Map
MSN Map
OSM Map
General Map
Google Map
MSN Map
Please wait while loading the map...
Real estate property taxes paid for housing units in 2022:
This zip code:
2.6% ($4,070)
New York:
1.5% ($6,180)
Median real estate property taxes paid for housing units with mortgages in 2022: $4,008 (1.8%) Median real estate property taxes paid for housing units with no mortgage in 2022: $4,070 (3.1%)
Business Search- 14 Million verified businesses
Males: 1,423
(46.6%)
Females: 1,630
(53.4%)
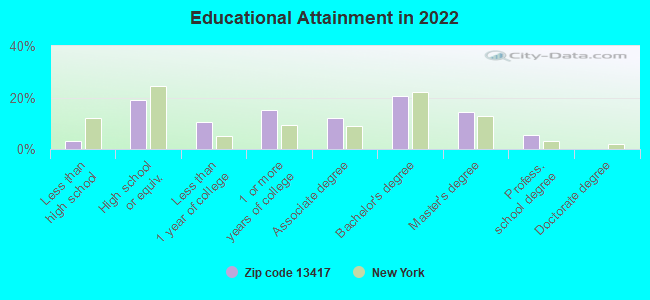
For population 25 years and over in 13417:
High school or higher: 96.8%
Bachelor's degree or higher: 40.0%
Graduate or professional degree: 19.6%
Mean travel time to work (commute): 19.0 minutes
For population 15 years and over in 13417:
Never married: 40.8%
Now married: 41.2%
Separated: 3.0%
Widowed: 5.8%
Divorced: 9.3%
Zip code 13417 compared to state average:
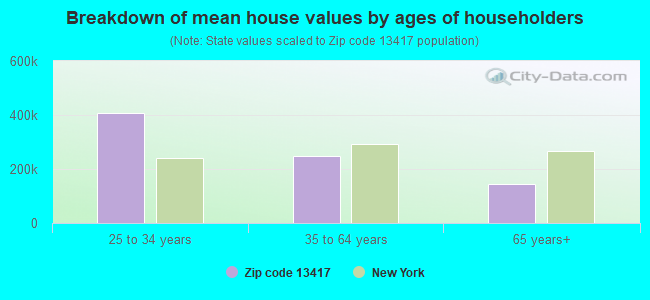
Median house value significantly below state average.
Unemployed percentage significantly below state average.
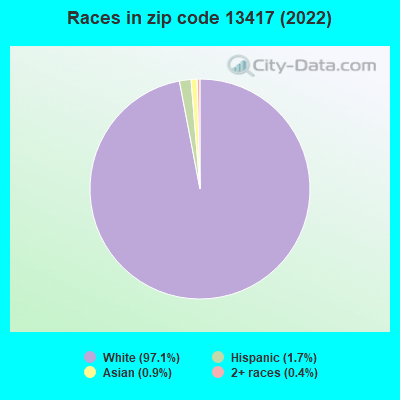
Black race population percentage significantly below state average.
Hispanic race population percentage significantly below state average.
Median age significantly above state average.
Foreign-born population percentage significantly below state average.
Length of stay since moving in significantly above state average.
Estimated median house/condo value in 2022: $155,532
13417:
$155,532
New York:
$400,400
According to our research of New York and other state lists, there were 4 registered sex offenders living in 13417 zip code as of June 01, 2024. The ratio of all residents to sex offenders in zip code 13417 is 847 to 1. The ratio of registered sex offenders to all residents in this zip code is near the state average.
Median resident age:
This zip code:
50.7 years
New York median age:
40.0 years
Average household size:
This zip code:
1.8 people
New York:
2.5 people
Averages for the 2020 tax year for zip code 13417, filed in 2021:
Average Adjusted Gross Income (AGI) in 2020: $49,511 (Individual Income Tax Returns)
Here:
$49,511
State:
$90,930
Salary/wage: $43,524 (reported on 82.4% of returns)
Here:
$43,524
State:
$72,104
(% of AGI for various income ranges: 1177.8% for AGIs below $25k, 3539.8% for AGIs $25k-50k, 6021.5% for AGIs $50k-75k, 8862.0% for AGIs $75k-100k, 20493.3% for AGIs $100k-200k)
Taxable interest for individuals: $937 (reported on 38.2% of returns)
This zip code:
$937
New York:
$3,075
(% of AGI for various income ranges: 17.8% for AGIs below $25k, 24.5% for AGIs $25k-50k, 51.0% for AGIs $50k-75k, 43.0% for AGIs $75k-100k, 191.1% for AGIs $100k-200k)
Ordinary dividends: $3,462 (reported on 17.1% of returns)
Here:
$3,462
State:
$11,095
(% of AGI for various income ranges: 8.9% for AGIs below $25k, 30.4% for AGIs $25k-50k, 57.0% for AGIs $50k-75k, 292.0% for AGIs $75k-100k, 463.3% for AGIs $100k-200k)
Net capital gain/loss in AGI: +$4,223 (reported on 12.9% of returns)
Here:
+$4,223
State:
+$44,925
(% of AGI for various income ranges: 3.3% for AGIs below $25k, 20.6% for AGIs $25k-50k, 74.5% for AGIs $50k-75k, 158.0% for AGIs $75k-100k, 565.6% for AGIs $100k-200k)
Profit/loss from business: +$8,900 (reported on 8.2% of returns)
Here:
+$8,900
State:
+$14,940
(% of AGI for various income ranges: 38.9% for AGIs below $25k, 50.8% for AGIs $25k-50k, 162.0% for AGIs $50k-75k, 592.2% for AGIs $100k-200k)
Taxable individual retirement arrangement distribution: $11,620 (reported on 8.8% of returns)
13417:
$11,620
New York:
$19,609
(% of AGI for various income ranges: 45.3% for AGIs below $25k, 80.4% for AGIs $25k-50k, 231.5% for AGIs $50k-75k, 723.0% for AGIs $75k-100k)
Total itemized deductions: $19,775 (reported on 2.4% of returns)
Here:
$19,775
State:
$39,326
(% of AGI for various income ranges: 878.9% for AGIs $100k-200k)
Charity contributions: $2,800 (reported on 1.8% of returns)
Here:
$2,800
State:
$15,420
(% of AGI for various income ranges: 42.0% for AGIs $50k-75k)
Taxes paid: $7,600 (reported on 2.4% of returns)
13417:
$7,600
State:
$9,183
(% of AGI for various income ranges: 337.8% for AGIs $100k-200k)
Earned income credit: $1,936 (reported on 12.9% of returns)
Here:
$1,936
State:
$2,138
(% of AGI for various income ranges: 60.3% for AGIs below $25k, 42.7% for AGIs $25k-50k)
Percentage of individuals using paid preparers for their 2020 taxes: 95.3%
Here:
95%
State:
95%
(% for various income ranges: 92.0% for AGIs below $25k, 95.2% for AGIs $25k-50k, 96.3% for AGIs $50k-75k, 100.0% for AGIs $75k-100k, 100.0% for AGIs $100k-200k, 100.0% for AGIs over 200k)
Averages for the 2012 tax year for zip code 13417, filed in 2013:
Average Adjusted Gross Income (AGI) in 2012: $42,423 (Individual Income Tax Returns)
Here:
$42,423
State:
$77,088
Salary/wage: $38,301 (reported on 80.8% of returns)
Here:
$38,301
State:
$60,593
(% of AGI for various income ranges: 68.9% for AGIs below $25k, 79.8% for AGIs $25k-50k, 71.7% for AGIs $50k-75k, 75.6% for AGIs $75k-100k, 67.8% for AGIs $100k-200k)
Taxable interest for individuals: $842 (reported on 43.0% of returns)
This zip code:
$842
New York:
$3,125
(% of AGI for various income ranges: 1.5% for AGIs below $25k, 0.9% for AGIs $25k-50k, 1.0% for AGIs $50k-75k, 0.5% for AGIs $75k-100k, 0.6% for AGIs $100k-200k)
Ordinary dividends: $1,949 (reported on 21.5% of returns)
Here:
$1,949
State:
$10,299
(% of AGI for various income ranges: 1.8% for AGIs below $25k, 0.8% for AGIs $25k-50k, 1.5% for AGIs $50k-75k, 1.0% for AGIs $75k-100k, 0.4% for AGIs $100k-200k)
Net capital gain/loss in AGI: +$2,263 (reported on 11.0% of returns)
Here:
+$2,263
State:
+$42,474
(% of AGI for various income ranges: 0.5% for AGIs $50k-75k, 0.3% for AGIs $75k-100k, 1.8% for AGIs $100k-200k)
Profit/loss from business: +$6,015 (reported on 7.6% of returns)
Here:
+$6,015
State:
+$16,168
(% of AGI for various income ranges: 2.1% for AGIs below $25k, 0.3% for AGIs $25k-50k, 2.3% for AGIs $50k-75k, 1.7% for AGIs $75k-100k)
Taxable individual retirement arrangement distribution: $8,174 (reported on 11.0% of returns)
13417:
$8,174
New York:
$17,621
(% of AGI for various income ranges: 3.6% for AGIs below $25k, 1.8% for AGIs $25k-50k, 2.1% for AGIs $50k-75k, 5.6% for AGIs $75k-100k)
Total itemized deductions: $17,735 (21% of AGI, reported on 18.0% of returns)
Here:
$17,735
State:
$34,985
Here:
21.0% of AGI
State:
21.3% of AGI
(% of AGI for various income ranges: 4.7% for AGIs below $25k, 4.6% for AGIs $25k-50k, 7.3% for AGIs $50k-75k, 9.3% for AGIs $75k-100k, 11.0% for AGIs $100k-200k)
Charity contributions: $2,100 (reported on 14.0% of returns)
Here:
$2,100
State:
$5,572
(% of AGI for various income ranges: 0.4% for AGIs $25k-50k, 0.6% for AGIs $50k-75k, 1.0% for AGIs $75k-100k, 1.2% for AGIs $100k-200k)
Taxes paid: $7,958 (reported on 18.0% of returns)
13417:
$7,958
State:
$18,656
(% of AGI for various income ranges: 0.9% for AGIs below $25k, 1.4% for AGIs $25k-50k, 2.8% for AGIs $50k-75k, 4.5% for AGIs $75k-100k, 6.4% for AGIs $100k-200k)
Earned income credit: $2,013 (reported on 14.0% of returns)
Here:
$2,013
State:
$2,230
(% of AGI for various income ranges: 4.0% for AGIs below $25k, 0.6% for AGIs $25k-50k)
Percentage of individuals using paid preparers for their 2012 taxes: 48.8%
Here:
49%
State:
66%
(% for various income ranges: 42.9% for AGIs below $25k, 43.4% for AGIs $25k-50k, 60.0% for AGIs $50k-75k, 66.7% for AGIs $75k-100k, 66.7% for AGIs $100k-200k)
Averages for the 2004 tax year for zip code 13417, filed in 2005:
Average Adjusted Gross Income (AGI) in 2004: $35,102 (Individual Income Tax Returns)
Here:
$35,102
State:
$59,519
Salary/wage: $32,981 (reported on 80.1% of returns)
Here:
$32,981
State:
$50,673
(% of AGI for various income ranges: 77.8% for AGIs below $10k, 68.7% for AGIs $10k-25k, 81.3% for AGIs $25k-50k, 79.4% for AGIs $50k-75k, 81.5% for AGIs $75k-100k, 61.5% for AGIs over 100k)
Taxable interest for individuals: $1,610 (reported on 53.7% of returns)
This zip code:
$1,610
New York:
$2,377
(% of AGI for various income ranges: 6.9% for AGIs below $10k, 3.7% for AGIs $10k-25k, 1.9% for AGIs $25k-50k, 1.8% for AGIs $50k-75k, 1.7% for AGIs $75k-100k, 3.2% for AGIs over 100k)
Taxable dividends: $1,518 (reported on 28.4% of returns)
Here:
$1,518
State:
$5,394
(% of AGI for various income ranges: 3.0% for AGIs below $10k, 2.2% for AGIs $10k-25k, 0.9% for AGIs $25k-50k, 1.2% for AGIs $50k-75k, 0.8% for AGIs $75k-100k, 1.1% for AGIs over 100k)
Net capital gain/loss: +$906 (reported on 17.5% of returns)
Here:
+$906
State:
+$23,581
(% of AGI for various income ranges: 0.4% for AGIs below $10k, -0.2% for AGIs $10k-25k, -0.1% for AGIs $25k-50k, 0.0% for AGIs $50k-75k, 3.2% for AGIs $75k-100k, 0.7% for AGIs over 100k)
Profit/loss from business: +$4,789 (reported on 7.8% of returns)
Here:
+$4,789
State:
+$13,809
(% of AGI for various income ranges: 0.7% for AGIs below $10k, 2.3% for AGIs $10k-25k, 0.3% for AGIs $25k-50k, 0.7% for AGIs $50k-75k, 3.8% for AGIs $75k-100k)
IRA payment deduction: $2,417 (reported on 2.1% of returns)
13417:
$2,417
New York:
$3,115
Total itemized deductions: $15,337 (20% of AGI, reported on 18.3% of returns)
Here:
$15,337
State:
$25,864
Here:
20.4% of AGI
State:
21.9% of AGI
(% of AGI for various income ranges: 6.5% for AGIs $10k-25k, 5.1% for AGIs $25k-50k, 7.1% for AGIs $50k-75k, 11.5% for AGIs $75k-100k, 14.0% for AGIs over 100k)
Charity contributions deductions: $2,489 (3% of AGI, reported on 16.3% of returns)
Here:
$2,489
State:
$4,439
Here:
3.2% of AGI
State:
3.6% of AGI
(% of AGI for various income ranges: 0.4% for AGIs $10k-25k, 0.8% for AGIs $25k-50k, 1.1% for AGIs $50k-75k, 1.1% for AGIs $75k-100k, 2.6% for AGIs over 100k)
Total tax: $4,276 (reported on 76.8% of returns)
13417:
$4,276
State:
$11,730
(% of AGI for various income ranges: 1.0% for AGIs below $10k, 4.3% for AGIs $10k-25k, 7.4% for AGIs $25k-50k, 9.6% for AGIs $50k-75k, 10.5% for AGIs $75k-100k, 16.8% for AGIs over 100k)
Earned income credit: $1,332 (reported on 12.8% of returns)
Here:
$1,332
State:
$1,757
Percentage of individuals using paid preparers for their 2004 taxes: 53.6%
Here:
54%
State:
67%
(% for various income ranges: 51.3% for AGIs below $10k, 50.4% for AGIs $10k-25k, 52.6% for AGIs $25k-50k, 62.7% for AGIs $50k-75k, 55.6% for AGIs $75k-100k, 65.6% for AGIs over 100k)
Household received Food Stamps/SNAP in the past 12 months: 369 Household did not receive Food Stamps/SNAP in the past 12 months: 1,333
Women who did not have a birth in the past 12 months: 731 (167 now married, 568 unmarried)
Housing units in zip code 13417 with a mortgage: 241 (39 second mortgage, 40 both second mortgage and home equity loan) Median monthly owner costs for units with a mortgage: $1,730 Median monthly owner costs for units without a mortgage: $638
Residents with income below the poverty level in 2022:
This zip code:
11.4%
Whole state:
14.3%
Residents with income below 50% of the poverty level in 2022:
This zip code:
8.4%
Whole state:
6.8%
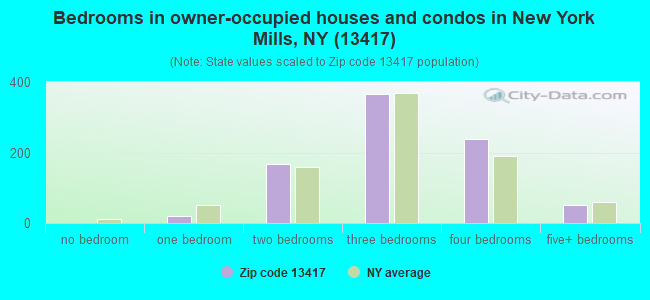
Median number of rooms in houses and condos:
Here:
6.4
State:
6.3
Median number of rooms in apartments:
Here:
4.0
State:
3.8
Notable locations in this zip code not listed on our city pages
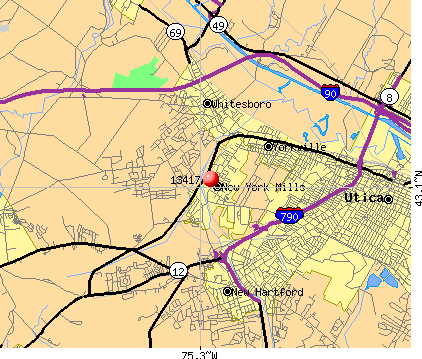
Notable locations in zip code 13417: Twin Ponds Golf Club (A), New York Mills Fire Department (B), New York Mills Public Library (C). Display/hide their locations on the map
Churches in zip code 13417 include: Saint Mary's Roman Catholic Church (A), Sacred Heart Polish National Church (B), Walcott Memorial Presbyterian Church (C), Cornerstone Community Church (D), Calvary Gospel Church (E). Display/hide their locations on the map
In group quarters: 12 (-1 institutionalized population)
Size of family households: 437 2-persons, 14 3-persons, 242 4-persons, 12 5-persons, 24 6-persons
Size of nonfamily households: 871 1-person, 110 2-persons
163 married couples with children.
111 single-parent households (111 women).
93.6% of residents of 13417 zip code speak English at home.
0.8% of residents speak Spanish at home (100% very well).
5.0% of residents speak other Indo-European language at home (75% very well, 25% well).
0.9% of residents speak Asian or Pacific Island language at home (100% very well).
0.4% of residents speak other language at home (100% very well).
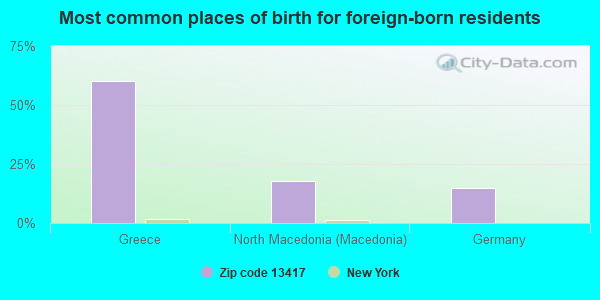
Foreign born population: 69 (2.3%) (100.0% of them are naturalized citizens)
This zip code:
2.3%
Whole state:
22.7%
60%Greece
18%North Macedonia (Macedonia)
15%Germany
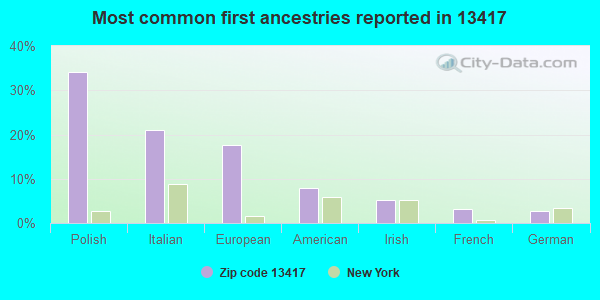
34%Polish
21%Italian
18%European
8%American
5%Irish
3%French
3%German
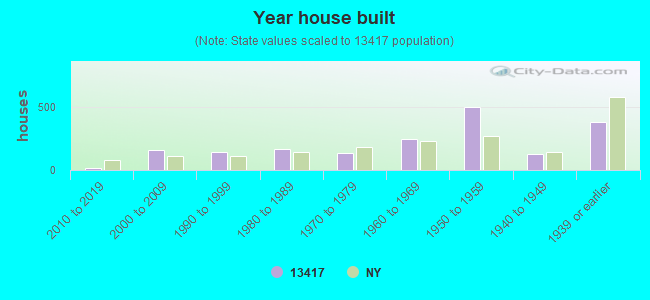
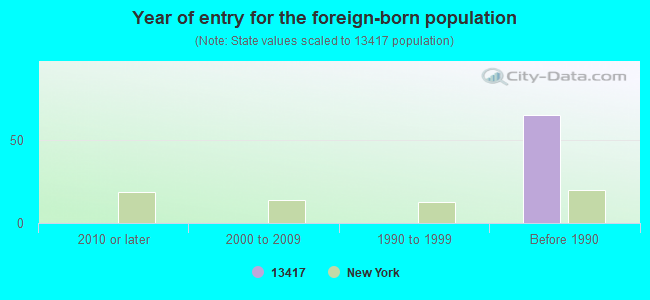
Year of entry for the foreign-born population
02010 or later
02000 to 2009
01990 to 1999
65Before 1990
Facilities with environmental interests located in this zip code:
HUSTED CONCRETE PRODUCTS INC (50 SAQUOIT ST in NEW YORK MILLS, NY)
Small Quantity Generators, between 100 kg and 1000 kg of hazardous waste/month (Resource Conservation and Recovery Act (tracking hazardous waste)) - notification
Housing units lacking complete kitchen facilities: 0.8%
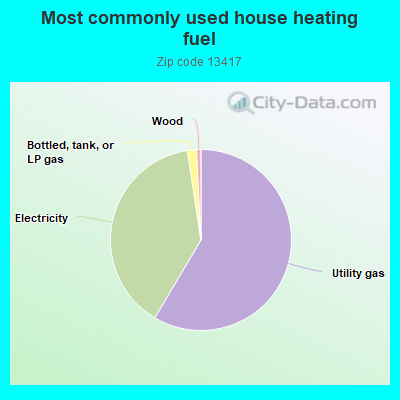
58.6%Utility gas
39.1%Electricity
1.6%Bottled, tank, or LP gas
0.8%Wood
Population in 1990: 3,646.
Place of birth for U.S.-born residents:
This state: 2,499
Northeast: 109
Midwest: 85
South: 141
West: 149
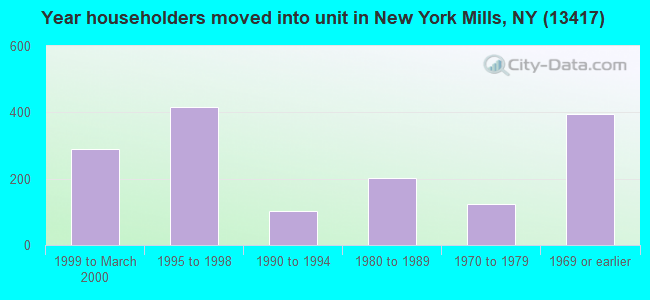
52% of the 13417 zip code residents lived in the same house 5 years ago. Out of people who lived in different houses, 85% lived in this county. Out of people who lived in different counties, 50% lived in New York.
84% of the 13417 zip code residents lived in the same house 1 year ago. Out of people who lived in different houses, 58% moved from this county. Out of people who lived in different houses, 41% moved from different county within same state.
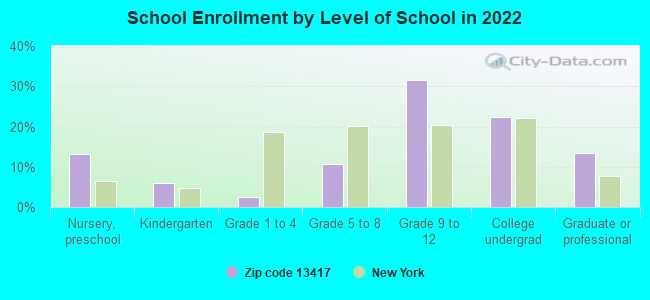
Private vs. public school enrollment:
Students in private schools in grades 1 to 8 (elementary and middle school):
Here:
0.0%
New York:
15.6%
Students in private schools in grades 9 to 12 (high school): 26
Here:
16.7%
New York:
15.0%
Students in private undergraduate colleges:
Here:
0.0%
New York:
39.2%
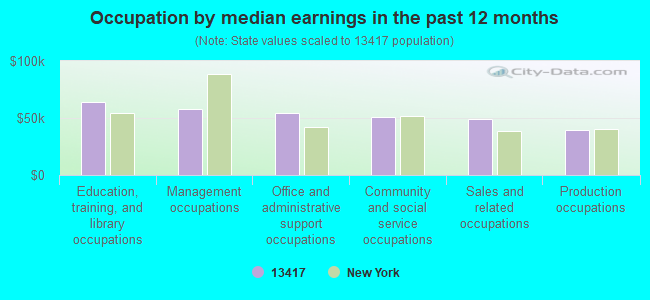
Occupation by median earnings in the past 12 months ($)
63,602Education, training, and library occupations
58,156Management occupations
54,545Office and administrative support occupations
51,284Community and social service occupations
48,994Sales and related occupations
39,184Production occupations
Companies with federal contracts located in this zip code:
LUPINI CONSTRUCTION INC (11 MILL ST in NEW YORK MILLS, NY; small business) : $7,878,109 in 52 contractsfrom 2000 to 2006
Contracts for Construction of Structures and Facilities -- Miscellaneous Buildings, Construction of Structures and Facilities -- Restoration of real property, Maintenance, Repair or Alteration of Real Property -- Office Buildings, Maintenance, Repair or Alteration of Real Property -- Restoration of real property, and moreby Army, Public Buildings Service, Saint Lawrence Seaway Development Corporation Signed by year:2000: $1,441,760; 2001: -$1,773; 2002: $410,737; 2003: $661,427; 2004: $784,998; 2005: $4,244,181; 2006: $336,779.
Biggest contracts:
$1,820,859 with Army for Construction of Structures and Facilities -- Miscellaneous Buildings. Signed on 2005-07-07. Completion date: 2005-08-10.
$1,138,866 with Army for Construction of Structures and Facilities -- Restoration of real property. Signed on 2005-09-27. Completion date: 2005-10-28.
$556,415, same as above.Signed on 2005-09-27. Completion date: 2005-10-28.
$480,346 with Army for Maintenance, Repair or Alteration of Real Property -- Office Buildings. Signed on 2000-09-30. Completion date: 2001-08-18.
Top industries in this zip code by the number of employees in 2005:
Wholesale Trade: Beer and Ale Merchant Wholesalers (100-249 employees: 1 establishment)
Accommodation and Food Services: Limited-Service Restaurants (20-49: 1, 5-9: 1)
Arts, Entertainment, and Recreation: Fitness and Recreational Sports Centers (20-49: 1)
People in group quarters in 2010:
4 people in group homes intended for adults
3 people in other noninstitutional facilities
People in group quarters in 2000:
4 people in homes for the mentally retarded
Fatal accident statistics in 2010:
Fatal accident count: 1
Vehicles involved in fatal accidents: 2
Fatal accidents caused by drunken drivers: 0
Fatalities: 1
Persons involved in fatal accidents: 2
Pedestrians involved in fatal accidents: 0
Home Mortgage Disclosure Act Aggregated Statistics For Year 2009 (Based on 2 partial tracts)
A) FHA, FSA/RHS & VA Home Purchase Loans
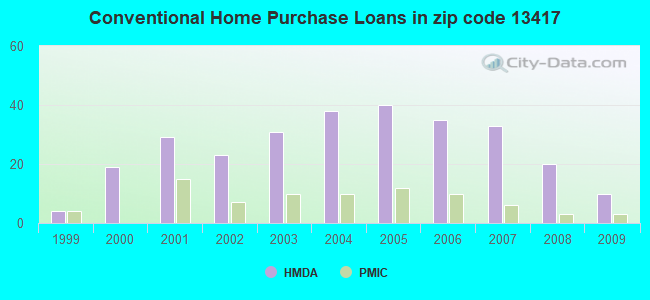
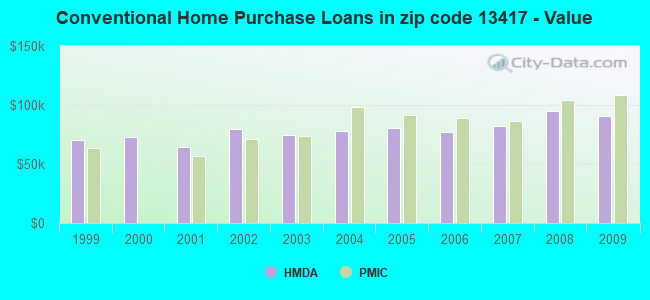
B) Conventional Home Purchase Loans
C) Refinancings
D) Home Improvement Loans
E) Loans on Dwellings For 5+ Families
F) Non-occupant Loans on < 5 Family Dwellings (A B C & D)
Number
Average Value
Number
Average Value
Number
Average Value
Number
Average Value
Number
Average Value
Number
Average Value
LOANS ORIGINATED
19
$104,143
10
$90,261
44
$84,862
13
$34,306
1
$122,410
3
$86,217
APPLICATIONS APPROVED, NOT ACCEPTED
1
$93,670
0
$0
9
$113,300
1
$10,640
0
$0
0
$0
APPLICATIONS DENIED
1
$151,140
1
$84,090
16
$96,328
4
$19,160
0
$0
4
$69,718
APPLICATIONS WITHDRAWN
0
$0
1
$108,570
12
$93,668
2
$75,040
0
$0
3
$76,283
FILES CLOSED FOR INCOMPLETENESS
2
$143,160
0
$0
1
$88,350
1
$31,930
0
$0
0
$0
Aggregated Statistics For Year 2008 (Based on 2 partial tracts)
A) FHA, FSA/RHS & VA Home Purchase Loans
B) Conventional Home Purchase Loans
C) Refinancings
D) Home Improvement Loans
F) Non-occupant Loans on < 5 Family Dwellings (A B C & D)
Number
Average Value
Number
Average Value
Number
Average Value
Number
Average Value
Number
Average Value
LOANS ORIGINATED
10
$94,199
20
$94,998
45
$90,782
14
$21,744
6
$97,215
APPLICATIONS APPROVED, NOT ACCEPTED
0
$0
1
$58,540
1
$30,870
6
$13,482
0
$0
APPLICATIONS DENIED
3
$102,537
3
$50,737
16
$97,526
5
$11,922
3
$91,183
APPLICATIONS WITHDRAWN
2
$160,190
1
$128,790
13
$113,399
5
$61,522
1
$111,760
FILES CLOSED FOR INCOMPLETENESS
2
$78,765
3
$63,153
1
$143,690
1
$26,610
1
$28,740
Aggregated Statistics For Year 2007 (Based on 2 partial tracts)
A) FHA, FSA/RHS & VA Home Purchase Loans
B) Conventional Home Purchase Loans
C) Refinancings
D) Home Improvement Loans
F) Non-occupant Loans on < 5 Family Dwellings (A B C & D)
G) Loans On Manufactured Home Dwelling (A B C & D)
Number
Average Value
Number
Average Value
Number
Average Value
Number
Average Value
Number
Average Value
Number
Average Value
LOANS ORIGINATED
12
$102,892
33
$81,959
31
$68,122
17
$32,809
9
$74,390
0
$0
APPLICATIONS APPROVED, NOT ACCEPTED
1
$158,600
3
$69,187
4
$76,902
3
$16,677
1
$37,250
0
$0
APPLICATIONS DENIED
0
$0
9
$68,594
27
$92,681
23
$25,407
2
$76,105
1
$45,770
APPLICATIONS WITHDRAWN
1
$78,770
3
$124,533
22
$92,893
2
$104,845
0
$0
0
$0
FILES CLOSED FOR INCOMPLETENESS
0
$0
2
$54,815
0
$0
1
$67,060
1
$63,860
0
$0
Aggregated Statistics For Year 2006 (Based on 2 partial tracts)
A) FHA, FSA/RHS & VA Home Purchase Loans
B) Conventional Home Purchase Loans
C) Refinancings
D) Home Improvement Loans
F) Non-occupant Loans on < 5 Family Dwellings (A B C & D)
G) Loans On Manufactured Home Dwelling (A B C & D)
Number
Average Value
Number
Average Value
Number
Average Value
Number
Average Value
Number
Average Value
Number
Average Value
LOANS ORIGINATED
7
$91,994
35
$76,819
43
$82,330
13
$38,973
7
$65,233
0
$0
APPLICATIONS APPROVED, NOT ACCEPTED
0
$0
3
$67,057
14
$85,684
5
$24,906
3
$51,447
0
$0
APPLICATIONS DENIED
0
$0
6
$67,767
23
$88,299
5
$29,590
4
$76,638
1
$43,640
APPLICATIONS WITHDRAWN
0
$0
4
$65,460
21
$79,577
3
$62,090
2
$41,510
0
$0
FILES CLOSED FOR INCOMPLETENESS
0
$0
2
$87,815
10
$105,163
0
$0
3
$68,477
0
$0
Aggregated Statistics For Year 2005 (Based on 2 partial tracts)
A) FHA, FSA/RHS & VA Home Purchase Loans
B) Conventional Home Purchase Loans
C) Refinancings
D) Home Improvement Loans
F) Non-occupant Loans on < 5 Family Dwellings (A B C & D)
G) Loans On Manufactured Home Dwelling (A B C & D)
Number
Average Value
Number
Average Value
Number
Average Value
Number
Average Value
Number
Average Value
Number
Average Value
LOANS ORIGINATED
12
$92,780
40
$80,921
39
$80,103
14
$30,639
6
$117,262
0
$0
APPLICATIONS APPROVED, NOT ACCEPTED
1
$152,210
3
$44,703
3
$102,183
1
$28,740
1
$21,290
0
$0
APPLICATIONS DENIED
0
$0
6
$80,185
36
$83,821
10
$25,439
2
$84,090
1
$30,870
APPLICATIONS WITHDRAWN
0
$0
1
$8,520
34
$91,382
2
$21,290
2
$80,895
0
$0
FILES CLOSED FOR INCOMPLETENESS
0
$0
2
$89,940
3
$101,827
1
$29,800
1
$75,570
0
$0
Aggregated Statistics For Year 2004 (Based on 2 partial tracts)
A) FHA, FSA/RHS & VA Home Purchase Loans
B) Conventional Home Purchase Loans
C) Refinancings
D) Home Improvement Loans
E) Loans on Dwellings For 5+ Families
F) Non-occupant Loans on < 5 Family Dwellings (A B C & D)
G) Loans On Manufactured Home Dwelling (A B C & D)
Number
Average Value
Number
Average Value
Number
Average Value
Number
Average Value
Number
Average Value
Number
Average Value
Number
Average Value
LOANS ORIGINATED
13
$80,075
38
$78,037
44
$69,646
15
$31,009
1
$638,640
7
$51,851
0
$0
APPLICATIONS APPROVED, NOT ACCEPTED
0
$0
5
$51,304
3
$94,023
3
$31,933
0
$0
1
$62,800
2
$22,350
APPLICATIONS DENIED
0
$0
0
$0
36
$68,861
10
$31,400
0
$0
3
$50,027
0
$0
APPLICATIONS WITHDRAWN
0
$0
4
$86,218
42
$78,563
6
$40,447
0
$0
2
$124,005
0
$0
FILES CLOSED FOR INCOMPLETENESS
1
$88,350
2
$81,960
5
$103,460
0
$0
0
$0
0
$0
0
$0
Aggregated Statistics For Year 2003 (Based on 2 partial tracts)
A) FHA, FSA/RHS & VA Home Purchase Loans
B) Conventional Home Purchase Loans
C) Refinancings
D) Home Improvement Loans
E) Loans on Dwellings For 5+ Families
F) Non-occupant Loans on < 5 Family Dwellings (A B C & D)
Number
Average Value
Number
Average Value
Number
Average Value
Number
Average Value
Number
Average Value
Number
Average Value
LOANS ORIGINATED
21
$82,263
31
$74,680
87
$74,484
13
$19,896
1
$451,310
5
$54,924
APPLICATIONS APPROVED, NOT ACCEPTED
0
$0
1
$57,480
11
$75,573
2
$11,710
0
$0
1
$56,410
APPLICATIONS DENIED
0
$0
5
$58,754
29
$70,471
3
$30,513
0
$0
1
$68,120
APPLICATIONS WITHDRAWN
0
$0
6
$78,943
26
$71,560
3
$36,543
0
$0
2
$50,560
FILES CLOSED FOR INCOMPLETENESS
0
$0
1
$106,440
2
$73,445
0
$0
0
$0
0
$0
Aggregated Statistics For Year 2002 (Based on 2 partial tracts)
A) FHA, FSA/RHS & VA Home Purchase Loans
B) Conventional Home Purchase Loans
C) Refinancings
D) Home Improvement Loans
F) Non-occupant Loans on < 5 Family Dwellings (A B C & D)
Number
Average Value
Number
Average Value
Number
Average Value
Number
Average Value
Number
Average Value
LOANS ORIGINATED
13
$79,338
23
$79,552
54
$64,002
14
$24,481
4
$62,532
APPLICATIONS APPROVED, NOT ACCEPTED
0
$0
1
$59,610
9
$39,974
1
$13,840
1
$63,860
APPLICATIONS DENIED
0
$0
5
$84,088
24
$59,606
6
$21,465
1
$53,220
APPLICATIONS WITHDRAWN
1
$72,380
1
$86,220
27
$61,104
5
$26,610
0
$0
FILES CLOSED FOR INCOMPLETENESS
0
$0
1
$373,600
1
$56,410
0
$0
0
$0
Aggregated Statistics For Year 2001 (Based on 2 partial tracts)
A) FHA, FSA/RHS & VA Home Purchase Loans
B) Conventional Home Purchase Loans
C) Refinancings
D) Home Improvement Loans
E) Loans on Dwellings For 5+ Families
F) Non-occupant Loans on < 5 Family Dwellings (A B C & D)
Number
Average Value
Number
Average Value
Number
Average Value
Number
Average Value
Number
Average Value
Number
Average Value
LOANS ORIGINATED
11
$65,896
29
$64,708
37
$62,944
11
$13,547
2
$10,554,590
2
$47,900
APPLICATIONS APPROVED, NOT ACCEPTED
1
$64,930
1
$40,450
4
$82,758
3
$12,773
0
$0
1
$35,130
APPLICATIONS DENIED
2
$79,830
3
$39,737
28
$52,041
6
$15,788
0
$0
4
$64,927
APPLICATIONS WITHDRAWN
0
$0
1
$96,860
14
$50,407
3
$23,063
0
$0
1
$10,640
FILES CLOSED FOR INCOMPLETENESS
0
$0
0
$0
3
$75,573
0
$0
0
$0
0
$0
Aggregated Statistics For Year 2000 (Based on 2 partial tracts)
A) FHA, FSA/RHS & VA Home Purchase Loans
B) Conventional Home Purchase Loans
C) Refinancings
D) Home Improvement Loans
F) Non-occupant Loans on < 5 Family Dwellings (A B C & D)
Number
Average Value
Number
Average Value
Number
Average Value
Number
Average Value
Number
Average Value
LOANS ORIGINATED
10
$67,696
19
$73,219
22
$47,269
16
$24,348
3
$41,157
APPLICATIONS APPROVED, NOT ACCEPTED
2
$63,330
2
$26,610
7
$69,339
0
$0
1
$53,220
APPLICATIONS DENIED
2
$60,140
6
$81,427
11
$74,508
14
$30,107
0
$0
APPLICATIONS WITHDRAWN
0
$0
1
$58,540
5
$32,996
1
$21,290
0
$0
FILES CLOSED FOR INCOMPLETENESS
0
$0
0
$0
0
$0
0
$0
0
$0
Aggregated Statistics For Year 1999 (Based on 1 partial tract)
A) FHA, FSA/RHS & VA Home Purchase Loans
B) Conventional Home Purchase Loans
C) Refinancings
D) Home Improvement Loans
E) Loans on Dwellings For 5+ Families
F) Non-occupant Loans on < 5 Family Dwellings (A B C & D)

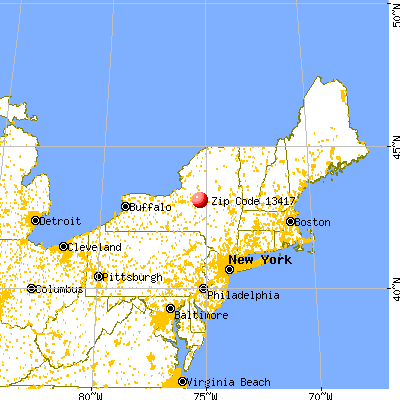


 Nearest zip codes: 13495, 13413, 13492, 13403, 13501, 13321.