Estimated zip code population in 2022: 2,316 Zip code population in 2010: 2,873 Zip code population in 2000: 3,416
Houses and condos: 1,012 Renter-occupied apartments: 102
% of renters here:
12%
State:
46%
March 2022 cost of living index in zip code 13143: 93.9 (less than average, U.S. average is 100)
Land area: 43.2 sq. mi. Water area: 0.6 sq. mi.
Population density: 54 people per square mile
(very low).
OSM Map
General Map
Google Map
MSN Map
OSM Map
General Map
Google Map
MSN Map
OSM Map
General Map
Google Map
MSN Map
OSM Map
General Map
Google Map
MSN Map
Please wait while loading the map...
Real estate property taxes paid for housing units in 2022:
This zip code:
2.2% ($2,637)
New York:
1.5% ($6,180)
Median real estate property taxes paid for housing units with mortgages in 2022: $2,934 (2.3%) Median real estate property taxes paid for housing units with no mortgage in 2022: $2,336 (2.2%)
Business Search- 14 Million verified businesses
Males: 1,156
(49.9%)
Females: 1,159
(50.1%)
For population 25 years and over in 13143:
High school or higher: 90.6%
Bachelor's degree or higher: 22.5%
Graduate or professional degree: 9.9%
Unemployed: 3.9%
Mean travel time to work (commute): 30.7 minutes
For population 15 years and over in 13143:
Never married: 26.3%
Now married: 53.6%
Separated: 2.8%
Widowed: 5.3%
Divorced: 12.0%
Zip code 13143 compared to state average:
Median house value significantly below state average.
Black race population percentage significantly below state average.
Hispanic race population percentage significantly below state average.
Foreign-born population percentage significantly below state average.
Renting percentage significantly below state average.
Number of rooms per house above state average.
Number of college students below state average.
Percentage of population with a bachelor's degree or higher below state average.
Averages for the 2020 tax year for zip code 13143, filed in 2021:
Average Adjusted Gross Income (AGI) in 2020: $52,968 (Individual Income Tax Returns)
Here:
$52,968
State:
$90,930
Salary/wage: $46,707 (reported on 83.2% of returns)
Here:
$46,707
State:
$72,104
(% of AGI for various income ranges: 1332.2% for AGIs below $25k, 3192.1% for AGIs $25k-50k, 6085.6% for AGIs $50k-75k, 9324.4% for AGIs $75k-100k, 17898.9% for AGIs $100k-200k)
Taxable interest for individuals: $431 (reported on 32.8% of returns)
This zip code:
$431
New York:
$3,075
(% of AGI for various income ranges: 4.3% for AGIs below $25k, 6.4% for AGIs $25k-50k, 30.0% for AGIs $50k-75k, 35.6% for AGIs $75k-100k, 66.7% for AGIs $100k-200k)
Ordinary dividends: $1,333 (reported on 10.1% of returns)
Here:
$1,333
State:
$11,095
(% of AGI for various income ranges: 3.9% for AGIs below $25k, 6.8% for AGIs $25k-50k, 51.9% for AGIs $50k-75k, 54.4% for AGIs $100k-200k)
Net capital gain/loss in AGI: +$4,180 (reported on 8.4% of returns)
Here:
+$4,180
State:
+$44,925
(% of AGI for various income ranges: 12.2% for AGIs below $25k, 19.6% for AGIs $25k-50k, 33.8% for AGIs $50k-75k, 312.2% for AGIs $100k-200k)
Profit/loss from business: +$6,083 (reported on 10.1% of returns)
Here:
+$6,083
State:
+$14,940
(% of AGI for various income ranges: 93.9% for AGIs below $25k, 73.9% for AGIs $25k-50k, 148.1% for AGIs $50k-75k, 77.8% for AGIs $100k-200k)
Taxable individual retirement arrangement distribution: $13,840 (reported on 8.4% of returns)
13143:
$13,840
New York:
$19,609
(% of AGI for various income ranges: 156.1% for AGIs $25k-50k, 305.0% for AGIs $50k-75k, 510.0% for AGIs $100k-200k)
Earned income credit: $2,170 (reported on 16.8% of returns)
Here:
$2,170
State:
$2,138
(% of AGI for various income ranges: 108.3% for AGIs below $25k, 66.1% for AGIs $25k-50k)
Percentage of individuals using paid preparers for their 2020 taxes: 98.3%
Here:
98%
State:
95%
(% for various income ranges: 97.3% for AGIs below $25k, 100.0% for AGIs $25k-50k, 95.5% for AGIs $50k-75k, 100.0% for AGIs $75k-100k, 100.0% for AGIs $100k-200k)
Averages for the 2012 tax year for zip code 13143, filed in 2013:
Average Adjusted Gross Income (AGI) in 2012: $41,139 (Individual Income Tax Returns)
Here:
$41,139
State:
$77,088
Salary/wage: $36,334 (reported on 85.0% of returns)
Here:
$36,334
State:
$60,593
(% of AGI for various income ranges: 68.6% for AGIs below $25k, 81.4% for AGIs $25k-50k, 78.9% for AGIs $50k-75k, 79.6% for AGIs $75k-100k, 65.8% for AGIs $100k-200k)
Taxable interest for individuals: $512 (reported on 35.0% of returns)
This zip code:
$512
New York:
$3,125
(% of AGI for various income ranges: 1.3% for AGIs below $25k, 0.2% for AGIs $25k-50k, 0.4% for AGIs $50k-75k, 0.1% for AGIs $75k-100k, 0.5% for AGIs $100k-200k)
Ordinary dividends: $1,107 (reported on 12.5% of returns)
Here:
$1,107
State:
$10,299
(% of AGI for various income ranges: 0.9% for AGIs below $25k, 0.1% for AGIs $25k-50k, 0.6% for AGIs $50k-75k, 0.2% for AGIs $100k-200k)
Net capital gain/loss in AGI: +$2,000 (reported on 7.5% of returns)
Here:
+$2,000
State:
+$42,474
(% of AGI for various income ranges: 1.1% for AGIs $25k-50k, 0.7% for AGIs $75k-100k)
Profit/loss from business: +$6,338 (reported on 10.8% of returns)
Here:
+$6,338
State:
+$16,168
(% of AGI for various income ranges: 6.2% for AGIs below $25k, 3.7% for AGIs $25k-50k, 0.3% for AGIs $75k-100k)
Taxable individual retirement arrangement distribution: $10,150 (reported on 8.3% of returns)
13143:
$10,150
New York:
$17,621
(% of AGI for various income ranges: 2.7% for AGIs below $25k, 2.0% for AGIs $25k-50k, 1.7% for AGIs $50k-75k, 4.7% for AGIs $75k-100k)
Total itemized deductions: $17,686 (21% of AGI, reported on 18.3% of returns)
Here:
$17,686
State:
$34,985
Here:
20.9% of AGI
State:
21.3% of AGI
(% of AGI for various income ranges: 4.4% for AGIs below $25k, 3.9% for AGIs $25k-50k, 7.2% for AGIs $50k-75k, 9.8% for AGIs $75k-100k, 12.3% for AGIs $100k-200k)
Charity contributions: $2,820 (reported on 12.5% of returns)
Here:
$2,820
State:
$5,572
(% of AGI for various income ranges: 0.6% for AGIs below $25k, 0.9% for AGIs $50k-75k, 1.3% for AGIs $75k-100k, 1.4% for AGIs $100k-200k)
Taxes paid: $7,586 (reported on 18.3% of returns)
13143:
$7,586
State:
$18,656
(% of AGI for various income ranges: 1.6% for AGIs below $25k, 1.2% for AGIs $25k-50k, 3.0% for AGIs $50k-75k, 3.9% for AGIs $75k-100k, 6.2% for AGIs $100k-200k)
Earned income credit: $2,089 (reported on 23.3% of returns)
Here:
$2,089
State:
$2,230
(% of AGI for various income ranges: 7.0% for AGIs below $25k, 1.4% for AGIs $25k-50k)
Percentage of individuals using paid preparers for their 2012 taxes: 57.5%
Here:
57%
State:
66%
(% for various income ranges: 50.0% for AGIs below $25k, 58.1% for AGIs $25k-50k, 64.7% for AGIs $50k-75k, 63.6% for AGIs $75k-100k, 77.8% for AGIs $100k-200k)
Averages for the 2004 tax year for zip code 13143, filed in 2005:
Average Adjusted Gross Income (AGI) in 2004: $32,690 (Individual Income Tax Returns)
Here:
$32,690
State:
$59,519
Salary/wage: $31,818 (reported on 84.6% of returns)
Here:
$31,818
State:
$50,673
(% of AGI for various income ranges: 89.1% for AGIs below $10k, 75.5% for AGIs $10k-25k, 83.1% for AGIs $25k-50k, 86.1% for AGIs $50k-75k, 83.4% for AGIs $75k-100k, 76.9% for AGIs over 100k)
Taxable interest for individuals: $550 (reported on 40.1% of returns)
This zip code:
$550
New York:
$2,377
(% of AGI for various income ranges: 3.8% for AGIs below $10k, 1.7% for AGIs $10k-25k, 0.5% for AGIs $25k-50k, 0.4% for AGIs $50k-75k, 0.4% for AGIs $75k-100k, 0.2% for AGIs over 100k)
Taxable dividends: $984 (reported on 15.8% of returns)
Here:
$984
State:
$5,394
(% of AGI for various income ranges: 2.3% for AGIs below $10k, 0.7% for AGIs $10k-25k, 0.3% for AGIs $25k-50k, 0.1% for AGIs $50k-75k, 0.6% for AGIs $75k-100k, 0.8% for AGIs over 100k)
Net capital gain/loss: +$1,746 (reported on 11.6% of returns)
Here:
+$1,746
State:
+$23,581
(% of AGI for various income ranges: 0.9% for AGIs below $10k, 0.0% for AGIs $10k-25k, 0.9% for AGIs $25k-50k, 0.0% for AGIs $50k-75k, 1.3% for AGIs $75k-100k, 0.9% for AGIs over 100k)
Profit/loss from business: +$3,642 (reported on 13.5% of returns)
Here:
+$3,642
State:
+$13,809
(% of AGI for various income ranges: 7.7% for AGIs below $10k, 5.0% for AGIs $10k-25k, 2.0% for AGIs $25k-50k, 0.4% for AGIs $50k-75k, -0.3% for AGIs $75k-100k)
IRA payment deduction: $1,900 (reported on 0.8% of returns)
13143:
$1,900
New York:
$3,115
Total itemized deductions: $14,146 (22% of AGI, reported on 20.8% of returns)
Here:
$14,146
State:
$25,864
Here:
21.7% of AGI
State:
21.9% of AGI
(% of AGI for various income ranges: 4.1% for AGIs $10k-25k, 8.1% for AGIs $25k-50k, 8.2% for AGIs $50k-75k, 12.8% for AGIs $75k-100k, 15.4% for AGIs over 100k)
Charity contributions deductions: $2,258 (3% of AGI, reported on 17.1% of returns)
Here:
$2,258
State:
$4,439
Here:
3.2% of AGI
State:
3.6% of AGI
(% of AGI for various income ranges: 0.2% for AGIs $10k-25k, 0.4% for AGIs $25k-50k, 0.8% for AGIs $50k-75k, 2.2% for AGIs $75k-100k, 3.7% for AGIs over 100k)
Total tax: $3,733 (reported on 69.8% of returns)
13143:
$3,733
State:
$11,730
(% of AGI for various income ranges: 2.5% for AGIs below $10k, 3.9% for AGIs $10k-25k, 6.2% for AGIs $25k-50k, 8.2% for AGIs $50k-75k, 10.3% for AGIs $75k-100k, 14.2% for AGIs over 100k)
Earned income credit: $1,828 (reported on 19.1% of returns)
Here:
$1,828
State:
$1,757
Percentage of individuals using paid preparers for their 2004 taxes: 66.2%
Here:
66%
State:
67%
(% for various income ranges: 58.2% for AGIs below $10k, 68.9% for AGIs $10k-25k, 65.0% for AGIs $25k-50k, 69.9% for AGIs $50k-75k, 80.5% for AGIs $75k-100k, 71.1% for AGIs over 100k)
Household received Food Stamps/SNAP in the past 12 months: 168 Household did not receive Food Stamps/SNAP in the past 12 months: 700
Women who had a birth in the past 12 months: 62 (20 now married, 43 unmarried) Women who did not have a birth in the past 12 months: 405 (189 now married, 213 unmarried)
Housing units in zip code 13143 with a mortgage: 372 (37 second mortgage, 17 both second mortgage and home equity loan) Houses without a mortgage: 7
Median monthly owner costs for units with a mortgage: $1,256 Median monthly owner costs for units without a mortgage: $510
Residents with income below the poverty level in 2022:
This zip code:
11.8%
Whole state:
14.3%
Residents with income below 50% of the poverty level in 2022:
This zip code:
7.8%
Whole state:
6.8%
Median number of rooms in houses and condos:
Here:
6.7
State:
6.3
Median number of rooms in apartments:
Here:
5.8
State:
3.8
Notable locations in this zip code not listed on our city pages
Notable locations in zip code 13143: Yellow Red Corners (A), Duncans Corners (B), Holiday Harbor Marina (C), Red Creek Free Library (D), Red Volunteer Creek Fire Department (E), Victory Fire Department (F). Display/hide their locations on the map
Cemeteries: French Cemetery (1), Livingston Cemetery (2), McArthur Cemetery (3), Ford Cemetery (4), New Westbury Cemetery (5), Old Westbury Cemetery (6), Phillips Cemetery (7). Display/hide their locations on the map
425 married couples with children.
181 single-parent households (58 men, 123 women).
94.0% of residents of 13143 zip code speak English at home.
1.9% of residents speak Spanish at home (78% very well, 22% well).
2.8% of residents speak other Indo-European language at home (97% very well, 3% well).
0.7% of residents speak Asian or Pacific Island language at home (53% very well, 47% well).
Foreign born population: 23 (1.0%) (38.7% of them are naturalized citizens)
This zip code:
1.0%
Whole state:
22.7%
43%Bosnia and Herzegovina
17%American
17%German
10%French Canadian
9%English
7%Irish
6%Italian
5%Scottish
Year of entry for the foreign-born population
102010 or later
82000 to 2009
01990 to 1999
23Before 1990
Facilities with environmental interests located in this zip code:
HANSON BUTLER QUARRY (P-5) (5465 REITZ RD in RED CREEK, NY)
AIR MINOR (AIRS/AFS) STATE MASTER (New York facility tracking) - AIR PROGRAM, MINE OPERATING PERMIT, MINE OPERATING PERMIT STATE MASTER (New York facility tracking) - National Pollutant Discharge Elimination System Permit Business SIC classification: CRUSHED AND BROKEN LIMESTONE Organizations: HANSON AGGREGATES NEW YORK INC (LEGALLY RESPONSIBLE PARTY)
, HANSON AGGREGATES GLSC INC (LEGALLY RESPONSIBLE PARTY)
Alternative names: GENESEE LEROY STONE P-5, HANSON BUTLER P-5, LEROY GENESEE STONE CORP
AGRILINK FOODS - RED CREEK FACILITY (14018 KEELEY ROAD in RED CREEK, NY)
AIR SYNTHETIC MINOR (AIRS/AFS) STATE MASTER (New York facility tracking) - National Pollutant Discharge Elimination System Permit, AIR PROGRAM, SECTION 404 PERMITTING, HAZARDOUS WASTE PROGRAM, National Pollutant Discharge Elimination System Permit Small Quantity Generators, between 100 kg and 1000 kg of hazardous waste/month (Resource Conservation and Recovery Act (tracking hazardous waste)) - notification Business SIC classification: CANNED FRUITS, VEGETABLES, PRESERVES, JAMS, AND JELLIES Business NAICS classification: FRUIT AND VEGETABLE CANNING. Organizations: AGRILINK FOODS INC (CONTACT/OWNER)
, BIRDS EYE FOODS INC (LEGALLY RESPONSIBLE PARTY)
Alternative names: COMSTOCK FOODS
Housing units lacking complete plumbing facilities: 1.1% Housing units lacking complete kitchen facilities: 2.0%
26.9%Bottled, tank, or LP gas
24.6%Utility gas
17.8%Fuel oil, kerosene, etc.
14.6%Wood
8.1%Electricity
4.4%Other fuel
3.4%Coal or coke
0.7%No fuel used
Population in 1990: 3,289. Population change in the 1990s: +127 (+3.9%).
Place of birth for U.S.-born residents:
This state: 1,930
Northeast: 148
Midwest: 52
South: 104
West: 29
60% of the 13143 zip code residents lived in the same house 5 years ago. Out of people who lived in different houses, 55% lived in this county. Out of people who lived in different counties, 50% lived in New York.
94% of the 13143 zip code residents lived in the same house 1 year ago. Out of people who lived in different houses, 30% moved from this county. Out of people who lived in different houses, 64% moved from different county within same state. Out of people who lived in different houses, 5% moved from different state.
Private vs. public school enrollment:
Students in private schools in grades 1 to 8 (elementary and middle school): 80
Here:
24.9%
New York:
15.6%
Students in private schools in grades 9 to 12 (high school): 5
Here:
8.7%
New York:
15.0%
Students in private undergraduate colleges:
Here:
0.0%
New York:
39.2%
Occupation by median earnings in the past 12 months ($)
85,304Computer and mathematical occupations
67,289Installation, maintenance, and repair occupations
65,266Transportation occupations
53,182Material moving occupations
48,593Health diagnosing and treating practitioners and other technical occupations
47,468Management occupations
Top industries in this zip code by the number of employees in 2005:
Health Care and Social Assistance: Child Day Care Services (20-49 employees: 1 establishment, 1-4 employees: 2 establishments)
Wholesale Trade: Home Furnishing Merchant Wholesalers (10-19: 1)
Other Services (except Public Administration): Religious Organizations (5-9: 1, 1-4: 1)
Other Services (except Public Administration): General Automotive Repair (5-9: 1, 1-4: 1)
Accommodation and Food Services: Limited-Service Restaurants (5-9: 1)
Mining: Crushed and Broken Limestone Mining and Quarrying (5-9: 1)
People in group quarters in 2010:
232 people in state prisons
People in group quarters in 2000:
531 people in state prisons
6 people in other group homes
Fatal accident statistics in 2010:
Fatal accident count: 1
Vehicles involved in fatal accidents: 1
Fatal accidents caused by drunken drivers: 0
Fatalities: 1
Persons involved in fatal accidents: 1
Pedestrians involved in fatal accidents: 0
Home Mortgage Disclosure Act Aggregated Statistics For Year 2009 (Based on 4 partial tracts)
A) FHA, FSA/RHS & VA Home Purchase Loans
B) Conventional Home Purchase Loans
C) Refinancings
D) Home Improvement Loans
F) Non-occupant Loans on < 5 Family Dwellings (A B C & D)
G) Loans On Manufactured Home Dwelling (A B C & D)
Number
Average Value
Number
Average Value
Number
Average Value
Number
Average Value
Number
Average Value
Number
Average Value
LOANS ORIGINATED
16
$73,322
16
$87,936
34
$96,301
18
$12,776
6
$132,638
6
$47,322
APPLICATIONS APPROVED, NOT ACCEPTED
1
$58,900
3
$100,247
1
$51,610
3
$33,020
1
$142,780
1
$76,340
APPLICATIONS DENIED
3
$54,847
1
$93,700
15
$84,382
15
$17,085
3
$34,210
2
$39,665
APPLICATIONS WITHDRAWN
3
$69,240
1
$8,920
6
$60,943
1
$9,820
0
$0
0
$0
FILES CLOSED FOR INCOMPLETENESS
0
$0
0
$0
0
$0
0
$0
0
$0
0
$0
Aggregated Statistics For Year 2008 (Based on 4 partial tracts)
A) FHA, FSA/RHS & VA Home Purchase Loans
B) Conventional Home Purchase Loans
C) Refinancings
D) Home Improvement Loans
F) Non-occupant Loans on < 5 Family Dwellings (A B C & D)
G) Loans On Manufactured Home Dwelling (A B C & D)
Number
Average Value
Number
Average Value
Number
Average Value
Number
Average Value
Number
Average Value
Number
Average Value
LOANS ORIGINATED
13
$69,739
23
$87,699
22
$61,879
17
$26,471
10
$81,476
7
$85,020
APPLICATIONS APPROVED, NOT ACCEPTED
1
$68,710
3
$61,277
7
$58,690
2
$21,515
2
$73,625
2
$42,835
APPLICATIONS DENIED
3
$70,103
6
$37,483
40
$80,899
40
$20,319
6
$74,687
9
$33,376
APPLICATIONS WITHDRAWN
5
$49,020
3
$70,000
16
$67,188
6
$36,760
2
$53,990
1
$61,090
FILES CLOSED FOR INCOMPLETENESS
0
$0
0
$0
2
$47,845
0
$0
0
$0
0
$0
Aggregated Statistics For Year 2007 (Based on 4 partial tracts)
A) FHA, FSA/RHS & VA Home Purchase Loans
B) Conventional Home Purchase Loans
C) Refinancings
D) Home Improvement Loans
F) Non-occupant Loans on < 5 Family Dwellings (A B C & D)
G) Loans On Manufactured Home Dwelling (A B C & D)
Number
Average Value
Number
Average Value
Number
Average Value
Number
Average Value
Number
Average Value
Number
Average Value
LOANS ORIGINATED
11
$67,176
38
$84,837
33
$70,891
34
$26,219
18
$96,568
11
$47,537
APPLICATIONS APPROVED, NOT ACCEPTED
1
$74,960
5
$59,998
9
$65,924
3
$19,543
3
$92,810
4
$71,170
APPLICATIONS DENIED
0
$0
22
$73,386
60
$78,586
35
$157,662
2
$41,805
18
$65,613
APPLICATIONS WITHDRAWN
1
$46,400
6
$95,233
28
$70,695
6
$21,728
0
$0
1
$28,880
FILES CLOSED FOR INCOMPLETENESS
0
$0
3
$119,880
6
$81,830
0
$0
1
$66,410
0
$0
Aggregated Statistics For Year 2006 (Based on 4 partial tracts)
A) FHA, FSA/RHS & VA Home Purchase Loans
B) Conventional Home Purchase Loans
C) Refinancings
D) Home Improvement Loans
F) Non-occupant Loans on < 5 Family Dwellings (A B C & D)
G) Loans On Manufactured Home Dwelling (A B C & D)
Number
Average Value
Number
Average Value
Number
Average Value
Number
Average Value
Number
Average Value
Number
Average Value
LOANS ORIGINATED
12
$63,257
30
$65,558
34
$73,432
39
$20,425
11
$77,345
9
$37,637
APPLICATIONS APPROVED, NOT ACCEPTED
1
$37,480
5
$60,922
10
$80,028
4
$57,962
1
$80,320
2
$71,315
APPLICATIONS DENIED
3
$123,980
16
$76,704
59
$70,349
49
$21,362
6
$27,293
17
$51,539
APPLICATIONS WITHDRAWN
2
$107,110
7
$63,186
34
$61,356
8
$32,307
2
$53,990
2
$66,040
FILES CLOSED FOR INCOMPLETENESS
0
$0
1
$124,190
7
$77,371
0
$0
0
$0
0
$0
Aggregated Statistics For Year 2005 (Based on 4 partial tracts)
A) FHA, FSA/RHS & VA Home Purchase Loans
B) Conventional Home Purchase Loans
C) Refinancings
D) Home Improvement Loans
E) Loans on Dwellings For 5+ Families
F) Non-occupant Loans on < 5 Family Dwellings (A B C & D)
G) Loans On Manufactured Home Dwelling (A B C & D)
Number
Average Value
Number
Average Value
Number
Average Value
Number
Average Value
Number
Average Value
Number
Average Value
Number
Average Value
LOANS ORIGINATED
6
$84,103
38
$76,992
48
$56,653
34
$23,041
0
$0
13
$64,984
8
$42,498
APPLICATIONS APPROVED, NOT ACCEPTED
0
$0
2
$42,955
22
$61,292
2
$27,750
0
$0
2
$41,945
2
$49,880
APPLICATIONS DENIED
4
$59,210
22
$60,023
99
$61,308
36
$21,097
1
$83,890
10
$50,766
13
$55,548
APPLICATIONS WITHDRAWN
1
$36,590
7
$59,244
41
$63,437
9
$37,617
0
$0
1
$48,290
5
$46,996
FILES CLOSED FOR INCOMPLETENESS
0
$0
4
$65,662
9
$85,254
1
$62,470
0
$0
2
$79,425
0
$0
Aggregated Statistics For Year 2004 (Based on 4 partial tracts)
A) FHA, FSA/RHS & VA Home Purchase Loans
B) Conventional Home Purchase Loans
C) Refinancings
D) Home Improvement Loans
F) Non-occupant Loans on < 5 Family Dwellings (A B C & D)
G) Loans On Manufactured Home Dwelling (A B C & D)
Number
Average Value
Number
Average Value
Number
Average Value
Number
Average Value
Number
Average Value
Number
Average Value
LOANS ORIGINATED
7
$60,463
32
$75,313
57
$57,974
36
$24,658
11
$87,881
7
$53,743
APPLICATIONS APPROVED, NOT ACCEPTED
0
$0
8
$74,216
12
$81,533
2
$27,690
2
$79,870
6
$46,352
APPLICATIONS DENIED
0
$0
15
$68,076
73
$64,390
29
$16,613
4
$77,400
18
$45,634
APPLICATIONS WITHDRAWN
0
$0
4
$50,065
47
$61,647
6
$32,962
2
$63,360
7
$64,150
FILES CLOSED FOR INCOMPLETENESS
0
$0
4
$58,738
12
$73,632
0
$0
0
$0
0
$0
Aggregated Statistics For Year 2003 (Based on 6 partial tracts)
A) FHA, FSA/RHS & VA Home Purchase Loans
B) Conventional Home Purchase Loans
C) Refinancings
D) Home Improvement Loans
F) Non-occupant Loans on < 5 Family Dwellings (A B C & D)
Number
Average Value
Number
Average Value
Number
Average Value
Number
Average Value
Number
Average Value
LOANS ORIGINATED
8
$79,281
48
$71,746
147
$64,217
33
$15,818
22
$62,075
APPLICATIONS APPROVED, NOT ACCEPTED
0
$0
8
$67,665
22
$61,994
7
$15,727
0
$0
APPLICATIONS DENIED
2
$33,970
20
$61,052
106
$64,609
35
$21,571
6
$49,527
APPLICATIONS WITHDRAWN
0
$0
3
$31,560
87
$78,867
5
$25,678
0
$0
FILES CLOSED FOR INCOMPLETENESS
0
$0
1
$55,610
10
$68,070
0
$0
0
$0
Aggregated Statistics For Year 2002 (Based on 6 partial tracts)
A) FHA, FSA/RHS & VA Home Purchase Loans
B) Conventional Home Purchase Loans
C) Refinancings
D) Home Improvement Loans
F) Non-occupant Loans on < 5 Family Dwellings (A B C & D)
Number
Average Value
Number
Average Value
Number
Average Value
Number
Average Value
Number
Average Value
LOANS ORIGINATED
14
$62,066
55
$71,835
120
$62,588
35
$11,597
16
$63,132
APPLICATIONS APPROVED, NOT ACCEPTED
1
$43,360
3
$41,797
20
$56,601
9
$21,756
1
$78,570
APPLICATIONS DENIED
1
$57,140
19
$48,760
106
$57,269
27
$17,028
6
$49,223
APPLICATIONS WITHDRAWN
1
$98,400
7
$78,051
63
$66,489
4
$25,000
1
$136,880
FILES CLOSED FOR INCOMPLETENESS
0
$0
0
$0
13
$67,148
1
$67,420
1
$72,280
Aggregated Statistics For Year 2001 (Based on 6 partial tracts)
A) FHA, FSA/RHS & VA Home Purchase Loans
B) Conventional Home Purchase Loans
C) Refinancings
D) Home Improvement Loans
E) Loans on Dwellings For 5+ Families
F) Non-occupant Loans on < 5 Family Dwellings (A B C & D)
Number
Average Value
Number
Average Value
Number
Average Value
Number
Average Value
Number
Average Value
Number
Average Value
LOANS ORIGINATED
17
$55,881
59
$60,844
103
$59,312
39
$11,602
1
$53,540
14
$65,908
APPLICATIONS APPROVED, NOT ACCEPTED
0
$0
19
$48,459
17
$59,178
3
$7,840
0
$0
2
$58,110
APPLICATIONS DENIED
3
$59,050
58
$42,583
117
$55,436
41
$14,528
0
$0
12
$34,241
APPLICATIONS WITHDRAWN
3
$55,180
6
$58,193
50
$60,087
6
$24,085
0
$0
2
$36,710
FILES CLOSED FOR INCOMPLETENESS
0
$0
1
$40,050
6
$59,583
0
$0
0
$0
0
$0
Aggregated Statistics For Year 2000 (Based on 6 partial tracts)
A) FHA, FSA/RHS & VA Home Purchase Loans
B) Conventional Home Purchase Loans
C) Refinancings
D) Home Improvement Loans
F) Non-occupant Loans on < 5 Family Dwellings (A B C & D)
Number
Average Value
Number
Average Value
Number
Average Value
Number
Average Value
Number
Average Value
LOANS ORIGINATED
19
$53,010
57
$55,298
54
$46,877
52
$14,125
7
$56,554
APPLICATIONS APPROVED, NOT ACCEPTED
0
$0
31
$50,748
18
$55,910
16
$10,309
4
$17,752
APPLICATIONS DENIED
1
$29,110
104
$43,769
108
$50,017
47
$16,926
6
$51,755
APPLICATIONS WITHDRAWN
0
$0
9
$60,456
38
$48,539
4
$12,120
1
$27,790
FILES CLOSED FOR INCOMPLETENESS
0
$0
0
$0
13
$58,946
1
$18,670
0
$0
Aggregated Statistics For Year 1999 (Based on 3 partial tracts)
A) FHA, FSA/RHS & VA Home Purchase Loans
B) Conventional Home Purchase Loans
C) Refinancings
D) Home Improvement Loans
F) Non-occupant Loans on < 5 Family Dwellings (A B C & D)
2005 - 2018 National Fire Incident Reporting System (NFIRS) incidents
Based on the data from the years 2005 - 2018 the average number of fires per year is 11. The highest number of reported fires - 21 took place in 2012, and the least - 0 in 2009. The data has a rising trend.
When looking into fire subcategories, the most reports belonged to: Structure Fires (63.1%), and Outside Fires (32.9%).
Fire incident types reported to NFIRS in Zip Code 13143

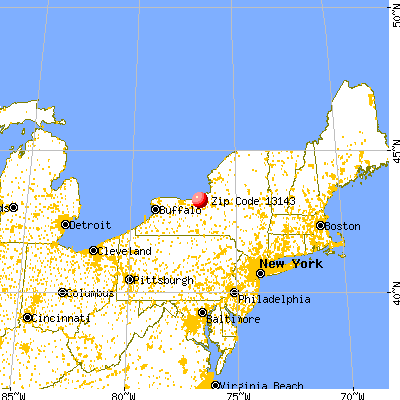


 Nearest zip codes: 13064, 13111, 13156, 14590, 13146, 13033.


 Based on the data from the years 2005 - 2018 the average number of fires per year is 11. The highest number of reported fires - 21 took place in 2012, and the least - 0 in 2009. The data has a rising trend.
 When looking into fire subcategories, the most reports belonged to: Structure Fires (63.1%), and Outside Fires (32.9%).