Estimated zip code population in 2022: 1,212 Zip code population in 2010: 1,403 Zip code population in 2000: 1,312
Houses and condos: 558 Renter-occupied apartments: 83
% of renters here:
18%
State:
46%
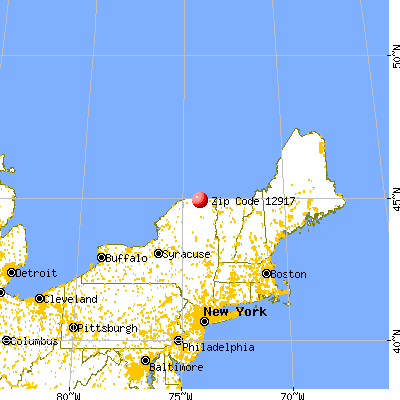
March 2022 cost of living index in zip code 12917: 93.6 (less than average, U.S. average is 100)
Land area: 43.1 sq. mi. Water area: 0.0 sq. mi.
Population density: 28 people per square mile
(very low).
OSM Map
General Map
Google Map
MSN Map
OSM Map
General Map
Google Map
MSN Map
OSM Map
General Map
Google Map
MSN Map
OSM Map
General Map
Google Map
MSN Map
Please wait while loading the map...
Real estate property taxes paid for housing units in 2022:
This zip code:
1.6% ($1,956)
New York:
1.5% ($6,180)
Median real estate property taxes paid for housing units with mortgages in 2022: $2,411 (1.7%) Median real estate property taxes paid for housing units with no mortgage in 2022: $1,528 (1.5%)
Business Search- 14 Million verified businesses
Males: 512
(42.3%)
Females: 699
(57.7%)
For population 25 years and over in 12917:
High school or higher: 86.3%
Bachelor's degree or higher: 12.7%
Graduate or professional degree: 3.3%
Unemployed: 2.1%
Mean travel time to work (commute): 24.5 minutes
For population 15 years and over in 12917:
Never married: 28.0%
Now married: 57.5%
Separated: 1.1%
Widowed: 4.3%
Divorced: 9.0%
Zip code 12917 compared to state average:
Median house value significantly below state average.
Unemployed percentage below state average.
Black race population percentage significantly below state average.
Hispanic race population percentage significantly below state average.
Foreign-born population percentage significantly below state average.
Renting percentage significantly below state average.
Length of stay since moving in above state average.
Number of rooms per house above state average.
Number of college students below state average.
Percentage of population with a bachelor's degree or higher significantly below state average.
Averages for the 2020 tax year for zip code 12917, filed in 2021:
Average Adjusted Gross Income (AGI) in 2020: $52,158 (Individual Income Tax Returns)
Here:
$52,158
State:
$90,930
Salary/wage: $46,981 (reported on 77.4% of returns)
Here:
$46,981
State:
$72,104
(% of AGI for various income ranges: 1438.0% for AGIs below $25k, 3690.0% for AGIs $25k-50k, 6656.2% for AGIs $50k-75k, 8684.0% for AGIs $75k-100k, 14036.0% for AGIs $100k-200k)
Taxable interest for individuals: $476 (reported on 27.4% of returns)
This zip code:
$476
New York:
$3,075
(% of AGI for various income ranges: 18.0% for AGIs below $25k, 19.2% for AGIs $25k-50k, 16.2% for AGIs $50k-75k, 42.0% for AGIs $75k-100k, 12.0% for AGIs $100k-200k)
Ordinary dividends: $620 (reported on 8.1% of returns)
Here:
$620
State:
$11,095
(% of AGI for various income ranges: 10.0% for AGIs below $25k, 26.2% for AGIs $50k-75k)
Net capital gain/loss in AGI: +$4,880 (reported on 8.1% of returns)
Here:
+$4,880
State:
+$44,925
(% of AGI for various income ranges: 305.0% for AGIs $50k-75k)
Profit/loss from business: +$13,509 (reported on 17.7% of returns)
Here:
+$13,509
State:
+$14,940
(% of AGI for various income ranges: 287.0% for AGIs below $25k, 257.5% for AGIs $25k-50k, 433.8% for AGIs $50k-75k, 1086.0% for AGIs $100k-200k)
Taxable individual retirement arrangement distribution: $9,300 (reported on 4.8% of returns)
12917:
$9,300
New York:
$19,609
(% of AGI for various income ranges: 232.5% for AGIs $25k-50k)
Earned income credit: $2,325 (reported on 12.9% of returns)
Here:
$2,325
State:
$2,138
(% of AGI for various income ranges: 116.0% for AGIs below $25k, 58.3% for AGIs $25k-50k)
Percentage of individuals using paid preparers for their 2020 taxes: 98.4%
Here:
98%
State:
95%
(% for various income ranges: 100.0% for AGIs below $25k, 94.4% for AGIs $25k-50k, 100.0% for AGIs $50k-75k, 100.0% for AGIs $75k-100k, 100.0% for AGIs $100k-200k)
Averages for the 2012 tax year for zip code 12917, filed in 2013:
Average Adjusted Gross Income (AGI) in 2012: $40,902 (Individual Income Tax Returns)
Here:
$40,902
State:
$77,088
Salary/wage: $39,342 (reported on 80.6% of returns)
Here:
$39,342
State:
$60,593
(% of AGI for various income ranges: 62.6% for AGIs below $25k, 77.6% for AGIs $25k-50k, 81.7% for AGIs $50k-75k, 76.7% for AGIs $75k-100k, 84.8% for AGIs $100k-200k)
Taxable interest for individuals: $615 (reported on 32.3% of returns)
This zip code:
$615
New York:
$3,125
(% of AGI for various income ranges: 1.5% for AGIs below $25k, 0.6% for AGIs $25k-50k, 0.4% for AGIs $50k-75k, 0.3% for AGIs $75k-100k)
Ordinary dividends: $367 (reported on 9.7% of returns)
Here:
$367
State:
$10,299
(% of AGI for various income ranges: 0.4% for AGIs below $25k, 0.2% for AGIs $50k-75k)
Net capital gain/loss in AGI: +$6,220 (reported on 8.1% of returns)
Here:
+$6,220
State:
+$42,474
(% of AGI for various income ranges: 6.2% for AGIs below $25k, 1.7% for AGIs $50k-75k)
Profit/loss from business: +$5,382 (reported on 17.7% of returns)
Here:
+$5,382
State:
+$16,168
(% of AGI for various income ranges: 7.6% for AGIs below $25k, 3.4% for AGIs $25k-50k, 2.2% for AGIs $75k-100k)
Taxable individual retirement arrangement distribution: $4,725 (reported on 6.5% of returns)
12917:
$4,725
New York:
$17,621
(% of AGI for various income ranges: 3.3% for AGIs $25k-50k)
Total itemized deductions: $15,540 (21% of AGI, reported on 16.1% of returns)
Here:
$15,540
State:
$34,985
Here:
20.6% of AGI
State:
21.3% of AGI
(% of AGI for various income ranges: 11.3% for AGIs $50k-75k, 6.9% for AGIs $75k-100k, 11.0% for AGIs $100k-200k)
Charity contributions: $1,567 (reported on 9.7% of returns)
Here:
$1,567
State:
$5,572
(% of AGI for various income ranges: 0.6% for AGIs $25k-50k, 0.5% for AGIs $75k-100k, 0.7% for AGIs $100k-200k)
Taxes paid: $6,440 (reported on 16.1% of returns)
12917:
$6,440
State:
$18,656
(% of AGI for various income ranges: 3.3% for AGIs $50k-75k, 3.1% for AGIs $75k-100k, 6.0% for AGIs $100k-200k)
Earned income credit: $2,031 (reported on 21.0% of returns)
Here:
$2,031
State:
$2,230
(% of AGI for various income ranges: 5.6% for AGIs below $25k, 1.2% for AGIs $25k-50k)
Percentage of individuals using paid preparers for their 2012 taxes: 75.8%
Here:
76%
State:
66%
(% for various income ranges: 73.1% for AGIs below $25k, 75.0% for AGIs $25k-50k, 77.8% for AGIs $50k-75k, 85.7% for AGIs $75k-100k, 75.0% for AGIs $100k-200k)
Averages for the 2004 tax year for zip code 12917, filed in 2005:
Average Adjusted Gross Income (AGI) in 2004: $30,728 (Individual Income Tax Returns)
Here:
$30,728
State:
$59,519
Salary/wage: $29,920 (reported on 84.2% of returns)
Here:
$29,920
State:
$50,673
(% of AGI for various income ranges: 83.5% for AGIs below $10k, 73.5% for AGIs $10k-25k, 84.2% for AGIs $25k-50k, 83.8% for AGIs $50k-75k, 82.5% for AGIs $75k-100k)
Taxable interest for individuals: $716 (reported on 44.9% of returns)
This zip code:
$716
New York:
$2,377
(% of AGI for various income ranges: 4.3% for AGIs below $10k, 2.3% for AGIs $10k-25k, 0.6% for AGIs $25k-50k, 0.9% for AGIs $50k-75k, 0.4% for AGIs $75k-100k)
Taxable dividends: $442 (reported on 13.3% of returns)
Here:
$442
State:
$5,394
(% of AGI for various income ranges: 0.4% for AGIs $10k-25k, 0.2% for AGIs $25k-50k, 0.1% for AGIs $50k-75k, 0.2% for AGIs $75k-100k)
Net capital gain/loss: +$3,041 (reported on 12.6% of returns)
Here:
+$3,041
State:
+$23,581
(% of AGI for various income ranges: -1.9% for AGIs below $10k, 2.9% for AGIs $10k-25k, 2.6% for AGIs $25k-50k, -0.0% for AGIs $50k-75k)
Profit/loss from business: +$2,955 (reported on 11.5% of returns)
Here:
+$2,955
State:
+$13,809
(% of AGI for various income ranges: 7.8% for AGIs below $10k, 5.6% for AGIs $10k-25k, -0.1% for AGIs $25k-50k, -0.2% for AGIs $50k-75k)
Profit/loss from farming: +$3,717 (reported on 7.9% of returns)
Here:
+$3,717
State:
-$2,666
IRA payment deduction: $2,222 (reported on 3.1% of returns)
12917:
$2,222
New York:
$3,115
Total itemized deductions: $12,614 (22% of AGI, reported on 14.3% of returns)
Here:
$12,614
State:
$25,864
Here:
21.7% of AGI
State:
21.9% of AGI
Charity contributions deductions: $1,437 (2% of AGI, reported on 12.2% of returns)
Here:
$1,437
State:
$4,439
Here:
2.5% of AGI
State:
3.6% of AGI
Total tax: $3,030 (reported on 73.5% of returns)
12917:
$3,030
State:
$11,730
(% of AGI for various income ranges: 3.8% for AGIs below $10k, 4.8% for AGIs $10k-25k, 5.8% for AGIs $25k-50k, 8.0% for AGIs $50k-75k, 11.3% for AGIs $75k-100k)
Earned income credit: $1,680 (reported on 21.0% of returns)
Here:
$1,680
State:
$1,757
Percentage of individuals using paid preparers for their 2004 taxes: 81.4%
Here:
81%
State:
67%
(% for various income ranges: 82.1% for AGIs below $10k, 79.9% for AGIs $10k-25k, 76.6% for AGIs $25k-50k, 90.2% for AGIs $50k-75k, 86.8% for AGIs $75k-100k)
Likely homosexual households (counted as self-reported same-sex unmarried-partner households)
Lesbian couples: 0.8% of all households
Gay men: 0.0% of all households
Household received Food Stamps/SNAP in the past 12 months: 86 Household did not receive Food Stamps/SNAP in the past 12 months: 380
Women who had a birth in the past 12 months: 13 (11 now married, 2 unmarried) Women who did not have a birth in the past 12 months: 227 (90 now married, 137 unmarried)
Housing units in zip code 12917 with a mortgage: 194 (20 second mortgage, 8 both second mortgage and home equity loan) Houses without a mortgage: 14
Median monthly owner costs for units with a mortgage: $1,068 Median monthly owner costs for units without a mortgage: $562
Residents with income below the poverty level in 2022:
This zip code:
17.2%
Whole state:
14.3%
Residents with income below 50% of the poverty level in 2022:
This zip code:
8.1%
Whole state:
6.8%
Median number of rooms in houses and condos:
Here:
6.3
State:
6.3
Median number of rooms in apartments:
Here:
4.7
State:
3.8
Notable locations in this zip code not listed on our city pages
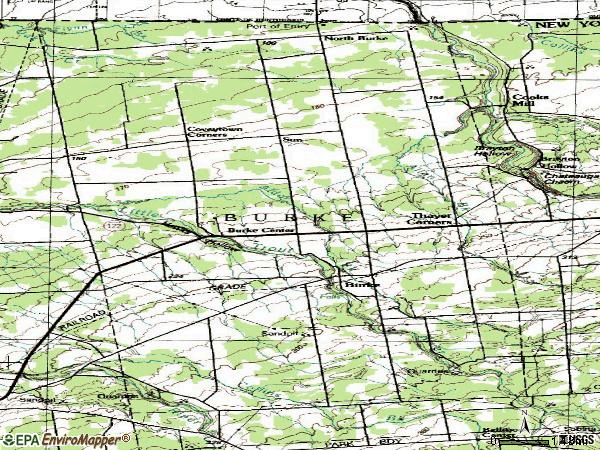
Cemeteries: Saint George Cemetery (1), Burke Center Cemetery (2), North Burke Cemetery (3), Ridgway Cemetery (4), Pike Cemetery (5), Mitchell Cemetery (6), Thayer Corners Cemetery (7). Display/hide their locations on the map
In group quarters: 2 (-1 institutionalized population)
Size of family households: 155 2-persons, 68 3-persons, 51 4-persons, 30 5-persons, 14 6-persons, 18 7-or-more-persons
Size of nonfamily households: 96 1-person, 22 2-persons, 4 3-persons
194 married couples with children.
86 single-parent households (19 men, 67 women).
85.6% of residents of 12917 zip code speak English at home.
0.3% of residents speak Spanish at home (100% well).
13.7% of residents speak other Indo-European language at home (27% very well, 61% well, 13% not well).
0.3% of residents speak other language at home (100% well).
Foreign born population: 12 (1.0%) (84.0% of them are naturalized citizens)
This zip code:
1.0%
Whole state:
22.7%
20%American
19%French
15%English
4%German
3%French Canadian
3%Irish
2%Polish
Year of entry for the foreign-born population
02010 or later
02000 to 2009
01990 to 1999
13Before 1990
Facilities with environmental interests located in this zip code:
BURKE V (PO BOX 20 in BURKE, NY)
(Integrated Compliance Information System) - ICIS-02-2000-8237, FORMAL ENFORCEMENT ACTION COMMUNITY WATER SYSTEM (SDWIS) - SDWIS-NY1600005 11302, WATER TREATMENT PLANT Business SIC classification: WATER SUPPLY
BURKE AUTO BODY & RADIATOR REPAIR (PO BOX 98 QUARRY RD in BURKE, NY)
STATE MASTER (New York facility tracking) - AIR PROGRAM Conditionally Exempt Small Quantity Generators, less than 100 kg/month of hazardous waste (Resource Conservation and Recovery Act (tracking hazardous waste)) - notification TRANSPORTER (Resource Conservation and Recovery Act (tracking hazardous waste)) - notification Organizations: DANIEL V & ROBER E BLAIR (CONTACT/OWNER)
Alternative names: BURKE AUTOBODY & RADIATOR REPAIR
Housing units lacking complete plumbing facilities: 1.2% Housing units lacking complete kitchen facilities: 1.8%
52.9%Fuel oil, kerosene, etc.
24.8%Wood
9.1%Bottled, tank, or LP gas
4.2%Electricity
4.0%Coal or coke
3.3%Other fuel
2.4%Utility gas
Population in 1990: 1,279. Population change in the 1990s: +33 (+2.6%).
Place of birth for U.S.-born residents:
This state: 910
Northeast: 145
Midwest: 9
South: 116
West: 11
72% of the 12917 zip code residents lived in the same house 5 years ago. Out of people who lived in different houses, 74% lived in this county. Out of people who lived in different counties, 50% lived in New York.
91% of the 12917 zip code residents lived in the same house 1 year ago. Out of people who lived in different houses, 19% moved from this county. Out of people who lived in different houses, 74% moved from different county within same state. Out of people who lived in different houses, 7% moved from different state.
Private vs. public school enrollment:
Students in private schools in grades 1 to 8 (elementary and middle school): 15
Here:
9.5%
New York:
15.6%
Students in private schools in grades 9 to 12 (high school):
Here:
0.0%
New York:
15.0%
Students in private undergraduate colleges:
Here:
0.0%
New York:
39.2%
Occupation by median earnings in the past 12 months ($)
85,717Health diagnosing and treating practitioners and other technical occupations
73,460Law enforcement workers including supervisors
61,212Farming, fishing, and forestry occupations
60,205Installation, maintenance, and repair occupations
50,491Material moving occupations
50,452Production occupations
Companies with federal contracts located in this zip code:
JAMES JOHNSTON (THAYERS CORS RR 11 in BURKE, NY; small business)
$6,000 with Public Buildings Service for Snow Removal/Salt Service (also spreading aggregate or other snow melting material). Signed on 2000-09-15. Completion date: 2001-04-15.
Top industries in this zip code by the number of employees in 2005:
Accommodation and Food Services: Full-Service Restaurants (20-49 employees: 1 establishment)
Wholesale Trade: Farm and Garden Machinery and Equipment Merchant Wholesalers (10-19: 1)
Administrative and Support and Waste Management and Remediation Services: Carpet and Upholstery Cleaning Services (5-9: 1)
Other Services (except Public Administration): Cemeteries and Crematories (1-4: 2)
Mining: Crushed and Broken Limestone Mining and Quarrying (1-4: 1)
Accommodation and Food Services: All Other Traveler Accommodation (1-4: 1)
Other Services (except Public Administration): Religious Organizations (1-4: 1)
Construction: New Single-Family Housing Construction (except Operative Builders) (1-4: 1)
People in group quarters in 2000:
16 people in other noninstitutional group quarters
2 people in homes for the mentally retarded
Fatal accident statistics in 2013:
Fatal accident count: 1
Vehicles involved in fatal accidents: 1
Fatal accidents caused by drunken drivers: 1
Fatalities: 1
Persons involved in fatal accidents: 1
Pedestrians involved in fatal accidents: 0
2002 - 2018 National Fire Incident Reporting System (NFIRS) incidents
Based on the data from the years 2002 - 2018 the average number of fires per year is 16. The highest number of reported fire incidents - 32 took place in 2008, and the least - 5 in 2015. The data has a growing trend.
When looking into fire subcategories, the most reports belonged to: Structure Fires (48.4%), and Outside Fires (29.7%).
Fire incident types reported to NFIRS in Zip Code 12917


+$3,717
-$2,666
 Nearest zip codes: 12920, 12926, 12953, 12969, 12955, 12923.


 Based on the data from the years 2002 - 2018 the average number of fires per year is 16. The highest number of reported fire incidents - 32 took place in 2008, and the least - 5 in 2015. The data has a growing trend.
 When looking into fire subcategories, the most reports belonged to: Structure Fires (48.4%), and Outside Fires (29.7%).