Estimated zip code population in 2022: 2,037 Zip code population in 2010: 2,471 Zip code population in 2000: 3,101
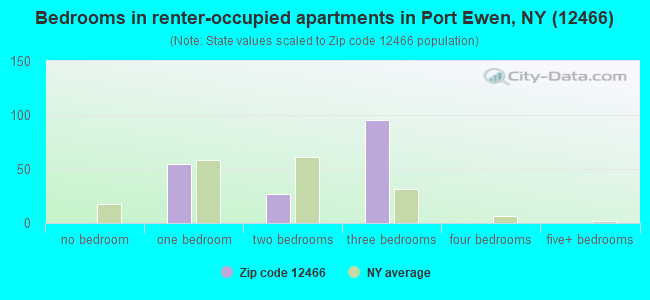
Houses and condos: 895 Renter-occupied apartments: 176
% of renters here:
21%
State:
46%
March 2022 cost of living index in zip code 12466: 110.6 (more than average, U.S. average is 100)
Land area: 1.0 sq. mi. Water area: 0.0 sq. mi.
Population density: 1,963 people per square mile
(low).
OSM Map
General Map
Google Map
MSN Map
OSM Map
General Map
Google Map
MSN Map
OSM Map
General Map
Google Map
MSN Map
OSM Map
General Map
Google Map
MSN Map
Please wait while loading the map...
Real estate property taxes paid for housing units in 2022:
This zip code:
1.8% ($4,787)
New York:
1.5% ($6,180)
Median real estate property taxes paid for housing units with mortgages in 2022: $5,557 (2.0%) Median real estate property taxes paid for housing units with no mortgage in 2022: $4,010 (1.5%)
Business Search- 14 Million verified businesses
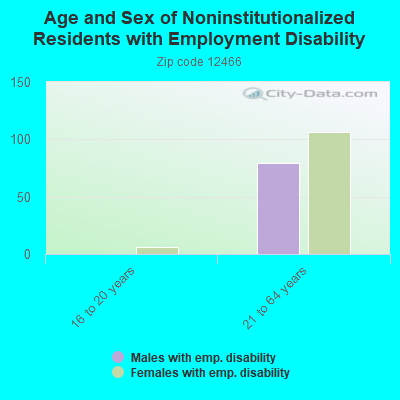
Males: 1,099
(54.0%)
Females: 937
(46.0%)
For population 25 years and over in 12466:
High school or higher: 94.9%
Bachelor's degree or higher: 32.7%
Graduate or professional degree: 11.2%
Unemployed: 0.8%
Mean travel time to work (commute): 24.0 minutes
For population 15 years and over in 12466:
Never married: 29.4%
Now married: 54.3%
Separated: 0.6%
Widowed: 5.5%
Divorced: 10.3%
Zip code 12466 compared to state average:
Unemployed percentage significantly below state average.
Black race population percentage below state average.
Median age above state average.
Foreign-born population percentage below state average.
Renting percentage below state average.
Length of stay since moving in above state average.
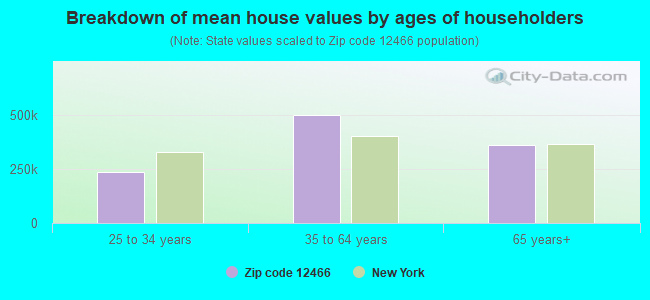
Estimated median house/condo value in 2022: $270,408
12466:
$270,408
New York:
$400,400
According to our research of New York and other state lists, there was 1 registered sex offender living in 12466 zip code as of June 01, 2024. The ratio of all residents to sex offenders in zip code 12466 is 2,292 to 1. The ratio of registered sex offenders to all residents in this zip code is lower than the state average.
Median resident age:
This zip code:
44.6 years
New York median age:
40.0 years
Average household size:
This zip code:
2.3 people
New York:
2.5 people
Averages for the 2020 tax year for zip code 12466, filed in 2021:
Average Adjusted Gross Income (AGI) in 2020: $64,154 (Individual Income Tax Returns)
Here:
$64,154
State:
$90,930
Salary/wage: $52,701 (reported on 77.0% of returns)
Here:
$52,701
State:
$72,104
(% of AGI for various income ranges: 1078.7% for AGIs below $25k, 3452.3% for AGIs $25k-50k, 6092.2% for AGIs $50k-75k, 8283.3% for AGIs $75k-100k, 14094.4% for AGIs $100k-200k)
Taxable interest for individuals: $891 (reported on 43.5% of returns)
This zip code:
$891
New York:
$3,075
(% of AGI for various income ranges: 27.1% for AGIs below $25k, 31.3% for AGIs $25k-50k, 42.8% for AGIs $50k-75k, 47.5% for AGIs $75k-100k, 148.1% for AGIs $100k-200k)
Ordinary dividends: $4,817 (reported on 25.5% of returns)
Here:
$4,817
State:
$11,095
(% of AGI for various income ranges: 40.6% for AGIs below $25k, 52.3% for AGIs $25k-50k, 141.7% for AGIs $50k-75k, 207.5% for AGIs $75k-100k, 475.6% for AGIs $100k-200k)
Net capital gain/loss in AGI: +$16,444 (reported on 19.9% of returns)
Here:
+$16,444
State:
+$44,925
(% of AGI for various income ranges: 35.3% for AGIs $25k-50k, 48.9% for AGIs $50k-75k, 154.2% for AGIs $75k-100k, 861.3% for AGIs $100k-200k)
Profit/loss from business: +$9,235 (reported on 12.4% of returns)
Here:
+$9,235
State:
+$14,940
(% of AGI for various income ranges: 48.4% for AGIs below $25k, 43.3% for AGIs $25k-50k, 240.0% for AGIs $50k-75k, 193.3% for AGIs $75k-100k, 564.4% for AGIs $100k-200k)
Taxable individual retirement arrangement distribution: $14,674 (reported on 11.8% of returns)
12466:
$14,674
New York:
$19,609
(% of AGI for various income ranges: 79.4% for AGIs below $25k, 103.0% for AGIs $25k-50k, 208.9% for AGIs $50k-75k, 572.5% for AGIs $75k-100k, 731.2% for AGIs $100k-200k)
Total itemized deductions: $23,286 (reported on 8.7% of returns)
Here:
$23,286
State:
$39,326
(% of AGI for various income ranges: 237.4% for AGIs below $25k, 300.6% for AGIs $50k-75k, 720.0% for AGIs $75k-100k, 699.4% for AGIs $100k-200k)
Charity contributions: $5,011 (reported on 5.6% of returns)
Here:
$5,011
State:
$15,420
(% of AGI for various income ranges: 30.0% for AGIs $25k-50k, 133.3% for AGIs $75k-100k, 125.6% for AGIs $100k-200k)
Taxes paid: $8,229 (reported on 8.7% of returns)
12466:
$8,229
State:
$9,183
(% of AGI for various income ranges: 56.1% for AGIs below $25k, 123.9% for AGIs $50k-75k, 273.3% for AGIs $75k-100k, 266.9% for AGIs $100k-200k)
Earned income credit: $1,817 (reported on 11.2% of returns)
Here:
$1,817
State:
$2,138
(% of AGI for various income ranges: 65.2% for AGIs below $25k, 41.7% for AGIs $25k-50k)
Percentage of individuals using paid preparers for their 2020 taxes: 93.2%
Here:
93%
State:
95%
(% for various income ranges: 93.2% for AGIs below $25k, 95.0% for AGIs $25k-50k, 88.9% for AGIs $50k-75k, 94.7% for AGIs $75k-100k, 92.6% for AGIs $100k-200k, 100.0% for AGIs over 200k)
Averages for the 2012 tax year for zip code 12466, filed in 2013:
Average Adjusted Gross Income (AGI) in 2012: $54,792 (Individual Income Tax Returns)
Here:
$54,792
State:
$77,088
Salary/wage: $47,088 (reported on 81.8% of returns)
Here:
$47,088
State:
$60,593
(% of AGI for various income ranges: 69.8% for AGIs below $25k, 76.8% for AGIs $25k-50k, 74.9% for AGIs $50k-75k, 68.9% for AGIs $75k-100k, 86.6% for AGIs $100k-200k)
Taxable interest for individuals: $741 (reported on 46.5% of returns)
This zip code:
$741
New York:
$3,125
(% of AGI for various income ranges: 1.1% for AGIs below $25k, 0.6% for AGIs $25k-50k, 0.4% for AGIs $50k-75k, 0.4% for AGIs $75k-100k, 0.6% for AGIs $100k-200k, 1.3% for AGIs over 200k)
Ordinary dividends: $3,412 (reported on 25.2% of returns)
Here:
$3,412
State:
$10,299
(% of AGI for various income ranges: 1.6% for AGIs below $25k, 0.8% for AGIs $25k-50k, 1.0% for AGIs $50k-75k, 1.2% for AGIs $75k-100k, 2.9% for AGIs $100k-200k)
Net capital gain/loss in AGI: +$8,800 (reported on 16.4% of returns)
Here:
+$8,800
State:
+$42,474
(% of AGI for various income ranges: 0.3% for AGIs $25k-50k, 1.2% for AGIs $75k-100k, 7.5% for AGIs $100k-200k)
Profit/loss from business: +$5,624 (reported on 13.2% of returns)
Here:
+$5,624
State:
+$16,168
(% of AGI for various income ranges: 7.3% for AGIs below $25k, 1.1% for AGIs $25k-50k, 2.2% for AGIs $50k-75k, 0.7% for AGIs $100k-200k)
Taxable individual retirement arrangement distribution: $9,716 (reported on 11.9% of returns)
12466:
$9,716
New York:
$17,621
(% of AGI for various income ranges: 3.1% for AGIs below $25k, 1.7% for AGIs $25k-50k, 1.4% for AGIs $50k-75k, 2.9% for AGIs $75k-100k, 2.9% for AGIs $100k-200k)
Total itemized deductions: $20,175 (22% of AGI, reported on 37.7% of returns)
Here:
$20,175
State:
$34,985
Here:
22.0% of AGI
State:
21.3% of AGI
(% of AGI for various income ranges: 10.2% for AGIs below $25k, 11.5% for AGIs $25k-50k, 12.9% for AGIs $50k-75k, 16.2% for AGIs $75k-100k, 15.6% for AGIs $100k-200k, 13.5% for AGIs over 200k)
Charity contributions: $2,345 (reported on 30.8% of returns)
Here:
$2,345
State:
$5,572
(% of AGI for various income ranges: 0.3% for AGIs below $25k, 1.1% for AGIs $25k-50k, 1.3% for AGIs $50k-75k, 1.3% for AGIs $75k-100k, 1.9% for AGIs $100k-200k, 0.7% for AGIs over 200k)
Taxes paid: $10,059 (reported on 37.1% of returns)
12466:
$10,059
State:
$18,656
(% of AGI for various income ranges: 3.5% for AGIs below $25k, 4.3% for AGIs $25k-50k, 5.6% for AGIs $50k-75k, 7.7% for AGIs $75k-100k, 8.7% for AGIs $100k-200k, 8.3% for AGIs over 200k)
Earned income credit: $1,795 (reported on 13.2% of returns)
Here:
$1,795
State:
$2,230
(% of AGI for various income ranges: 4.5% for AGIs below $25k, 0.6% for AGIs $25k-50k)
Percentage of individuals using paid preparers for their 2012 taxes: 55.3%
Here:
55%
State:
66%
(% for various income ranges: 50.0% for AGIs below $25k, 50.0% for AGIs $25k-50k, 57.7% for AGIs $50k-75k, 66.7% for AGIs $75k-100k, 66.7% for AGIs $100k-200k, 66.7% for AGIs over 200k)
Averages for the 2004 tax year for zip code 12466, filed in 2005:
Average Adjusted Gross Income (AGI) in 2004: $45,042 (Individual Income Tax Returns)
Here:
$45,042
State:
$59,519
Salary/wage: $41,349 (reported on 82.9% of returns)
Here:
$41,349
State:
$50,673
(% of AGI for various income ranges: 105.5% for AGIs below $10k, 72.6% for AGIs $10k-25k, 77.0% for AGIs $25k-50k, 78.7% for AGIs $50k-75k, 78.5% for AGIs $75k-100k, 70.9% for AGIs over 100k)
Taxable interest for individuals: $1,020 (reported on 60.5% of returns)
This zip code:
$1,020
New York:
$2,377
(% of AGI for various income ranges: 4.1% for AGIs below $10k, 2.2% for AGIs $10k-25k, 1.6% for AGIs $25k-50k, 1.3% for AGIs $50k-75k, 1.2% for AGIs $75k-100k, 1.0% for AGIs over 100k)
Taxable dividends: $2,143 (reported on 31.9% of returns)
Here:
$2,143
State:
$5,394
(% of AGI for various income ranges: 2.5% for AGIs below $10k, 2.1% for AGIs $10k-25k, 1.4% for AGIs $25k-50k, 1.0% for AGIs $50k-75k, 1.8% for AGIs $75k-100k, 1.6% for AGIs over 100k)
Net capital gain/loss: +$4,391 (reported on 22.6% of returns)
Here:
+$4,391
State:
+$23,581
(% of AGI for various income ranges: -1.5% for AGIs below $10k, -0.3% for AGIs $10k-25k, 0.3% for AGIs $25k-50k, 1.2% for AGIs $50k-75k, 1.7% for AGIs $75k-100k, 6.1% for AGIs over 100k)
Profit/loss from business: +$7,179 (reported on 13.6% of returns)
Here:
+$7,179
State:
+$13,809
(% of AGI for various income ranges: 6.3% for AGIs below $10k, 5.0% for AGIs $10k-25k, 2.9% for AGIs $25k-50k, 2.3% for AGIs $50k-75k, 0.2% for AGIs $75k-100k, 1.8% for AGIs over 100k)
IRA payment deduction: $3,315 (reported on 3.4% of returns)
12466:
$3,315
New York:
$3,115
Total itemized deductions: $16,644 (22% of AGI, reported on 38.6% of returns)
Here:
$16,644
State:
$25,864
Here:
22.5% of AGI
State:
21.9% of AGI
(% of AGI for various income ranges: 11.6% for AGIs below $10k, 9.9% for AGIs $10k-25k, 13.1% for AGIs $25k-50k, 14.2% for AGIs $50k-75k, 16.7% for AGIs $75k-100k, 15.1% for AGIs over 100k)
Charity contributions deductions: $2,422 (3% of AGI, reported on 34.8% of returns)
Here:
$2,422
State:
$4,439
Here:
3.2% of AGI
State:
3.6% of AGI
(% of AGI for various income ranges: 1.0% for AGIs $10k-25k, 1.6% for AGIs $25k-50k, 1.5% for AGIs $50k-75k, 2.0% for AGIs $75k-100k, 2.7% for AGIs over 100k)
Total tax: $6,024 (reported on 80.3% of returns)
12466:
$6,024
State:
$11,730
(% of AGI for various income ranges: 2.5% for AGIs below $10k, 4.7% for AGIs $10k-25k, 7.6% for AGIs $25k-50k, 10.0% for AGIs $50k-75k, 10.5% for AGIs $75k-100k, 16.7% for AGIs over 100k)
Earned income credit: $1,428 (reported on 12.1% of returns)
Here:
$1,428
State:
$1,757
Percentage of individuals using paid preparers for their 2004 taxes: 60.7%
Here:
61%
State:
67%
(% for various income ranges: 54.4% for AGIs below $10k, 58.3% for AGIs $10k-25k, 60.6% for AGIs $25k-50k, 64.3% for AGIs $50k-75k, 66.5% for AGIs $75k-100k, 65.9% for AGIs over 100k)
Household received Food Stamps/SNAP in the past 12 months: 140 Household did not receive Food Stamps/SNAP in the past 12 months: 720
Women who had a birth in the past 12 months: 47 (37 now married, 10 unmarried) Women who did not have a birth in the past 12 months: 308 (110 now married, 197 unmarried)
Housing units in zip code 12466 with a mortgage: 387 (14 second mortgage, 14 both second mortgage and home equity loan) Median monthly owner costs for units with a mortgage: $1,867 Median monthly owner costs for units without a mortgage: $819
Residents with income below the poverty level in 2022:
This zip code:
16.4%
Whole state:
14.3%
Residents with income below 50% of the poverty level in 2022:
This zip code:
13.8%
Whole state:
6.8%
Median number of rooms in houses and condos:
Here:
6.3
State:
6.3
Median number of rooms in apartments:
Here:
4.6
State:
3.8
Notable locations in this zip code not listed on our city pages
Notable locations in zip code 12466: Port Ewen Fire Department Station Number 1 (A), Port Ewen Public Library (B), Town of Esopus Port Ewen Library (C). Display/hide their locations on the map
Churches in zip code 12466 include: Port Ewen Methodist Church (A), Port Ewen Reformed Church (B), Presentation Roman Catholic Church (C). Display/hide their locations on the map
In group quarters: 13 (-1 institutionalized population)
Size of family households: 309 2-persons, 133 3-persons, 89 4-persons, 45 5-persons
Size of nonfamily households: 262 1-person, 19 2-persons
171 married couples with children.
242 single-parent households (242 women).
85.0% of residents of 12466 zip code speak English at home.
11.5% of residents speak Spanish at home (59% very well, 41% well).
3.7% of residents speak other Indo-European language at home (99% very well, 1% not at all).
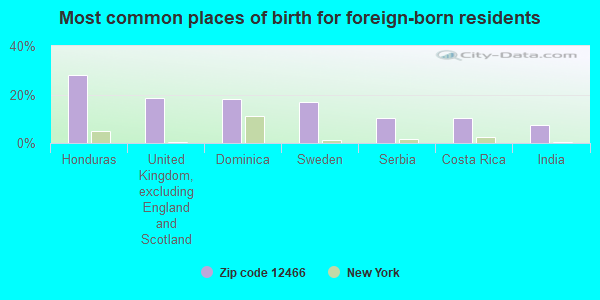
Foreign born population: 236 (11.6%) (68.4% of them are naturalized citizens)
This zip code:
11.6%
Whole state:
22.7%
28%Honduras
19%United Kingdom, excluding England and Scotland
18%Dominica
17%Sweden
10%Serbia
10%Costa Rica
7%India
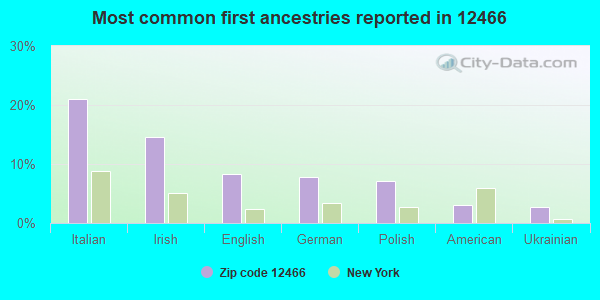
21%Italian
15%Irish
8%English
8%German
7%Polish
3%American
3%Ukrainian
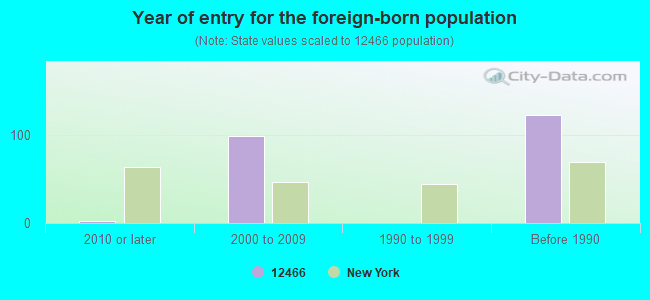
Year of entry for the foreign-born population
22010 or later
992000 to 2009
01990 to 1999
123Before 1990
Facilities with environmental interests located in this zip code:
GETTY PORT EWEN TERMINAL (FOOT OF THE HILL, NORTH BROADWAY in PORT EWEN, NY)
OIL CONTROL (Facility Response Plan for oil discharge) Organizations: KINGSTON OIL SUPPLY CORP. (CONTACT/GENERAL)
Housing units lacking complete plumbing facilities: 0.6% Housing units lacking complete kitchen facilities: 0.6%
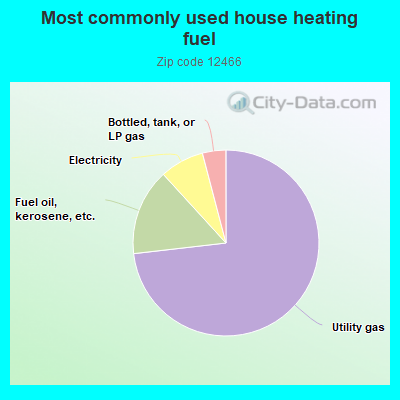
73.4%Utility gas
15.1%Fuel oil, kerosene, etc.
7.7%Electricity
4.1%Bottled, tank, or LP gas
Population in 1990: 7,283.
Place of birth for U.S.-born residents:
This state: 1,513
Northeast: 126
Midwest: 62
South: 40
West: 58
71% of the 12466 zip code residents lived in the same house 5 years ago. Out of people who lived in different houses, 66% lived in this county. Out of people who lived in different counties, 50% lived in New York.
97% of the 12466 zip code residents lived in the same house 1 year ago. Out of people who lived in different houses, 35% moved from this county. Out of people who lived in different houses, 61% moved from different state. Out of people who lived in different houses, 4% moved from abroad.
Private vs. public school enrollment:
Students in private schools in grades 1 to 8 (elementary and middle school): 113
Here:
45.5%
New York:
15.6%
Students in private schools in grades 9 to 12 (high school):
Here:
0.0%
New York:
15.0%
Students in private undergraduate colleges: 11
Here:
17.0%
New York:
39.2%
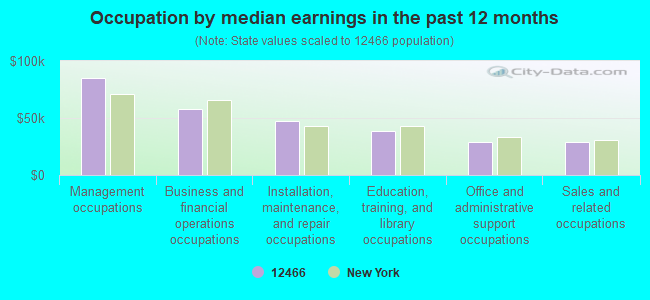
Occupation by median earnings in the past 12 months ($)
85,165Management occupations
58,088Business and financial operations occupations
47,473Installation, maintenance, and repair occupations
38,286Education, training, and library occupations
29,190Office and administrative support occupations
28,767Sales and related occupations
Top industries in this zip code by the number of employees in 2005:
Information: Data Processing, Hosting, and Related Services (50-99 employees: 1 establishment, 1-4 employees: 1 establishment)
Construction: Water and Sewer Line and Related Structures Construction (20-49: 1)
Arts, Entertainment, and Recreation: All Other Amusement and Recreation Industries (10-19: 1)
Health Care and Social Assistance: Residential Mental Retardation Facilities (10-19: 1)
Mining: Crushed and Broken Limestone Mining and Quarrying (10-19: 1)
Other Services (except Public Administration): General Automotive Repair (5-9: 1, 1-4: 1)
People in group quarters in 2010:
7 people in group homes intended for adults
Home Mortgage Disclosure Act Aggregated Statistics For Year 2009 (Based on 2 partial tracts)
A) FHA, FSA/RHS & VA Home Purchase Loans
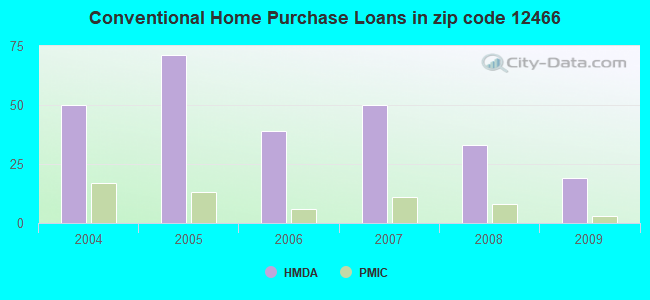
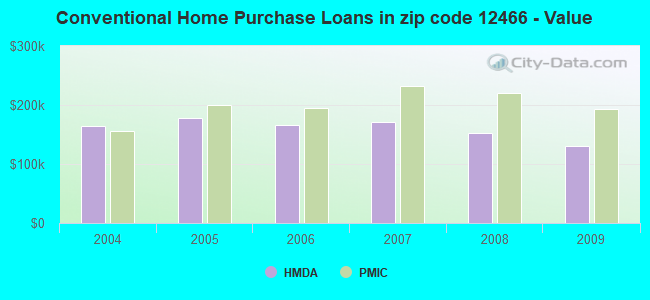
B) Conventional Home Purchase Loans
C) Refinancings
D) Home Improvement Loans
F) Non-occupant Loans on < 5 Family Dwellings (A B C & D)
G) Loans On Manufactured Home Dwelling (A B C & D)
Number
Average Value
Number
Average Value
Number
Average Value
Number
Average Value
Number
Average Value
Number
Average Value
LOANS ORIGINATED
9
$178,560
19
$130,350
45
$152,763
17
$37,728
3
$107,410
4
$38,472
APPLICATIONS APPROVED, NOT ACCEPTED
1
$119,800
1
$48,540
3
$188,313
1
$32,020
0
$0
1
$48,540
APPLICATIONS DENIED
6
$185,388
5
$89,854
10
$254,998
5
$29,744
0
$0
2
$40,280
APPLICATIONS WITHDRAWN
1
$212,760
3
$147,690
10
$156,469
0
$0
0
$0
0
$0
FILES CLOSED FOR INCOMPLETENESS
0
$0
0
$0
1
$98,120
0
$0
0
$0
0
$0
Aggregated Statistics For Year 2008 (Based on 2 partial tracts)
A) FHA, FSA/RHS & VA Home Purchase Loans
B) Conventional Home Purchase Loans
C) Refinancings
D) Home Improvement Loans
F) Non-occupant Loans on < 5 Family Dwellings (A B C & D)
G) Loans On Manufactured Home Dwelling (A B C & D)
Number
Average Value
Number
Average Value
Number
Average Value
Number
Average Value
Number
Average Value
Number
Average Value
LOANS ORIGINATED
4
$191,325
33
$153,261
33
$144,811
11
$40,843
4
$158,018
2
$45,960
APPLICATIONS APPROVED, NOT ACCEPTED
1
$185,900
3
$177,297
4
$159,310
1
$25,820
1
$134,260
0
$0
APPLICATIONS DENIED
1
$240,640
3
$43,033
21
$160,920
11
$28,074
4
$250,970
4
$50,090
APPLICATIONS WITHDRAWN
2
$186,935
1
$103,280
10
$159,671
0
$0
0
$0
0
$0
FILES CLOSED FOR INCOMPLETENESS
0
$0
1
$204,490
3
$169,723
0
$0
0
$0
0
$0
Aggregated Statistics For Year 2007 (Based on 2 partial tracts)
B) Conventional Home Purchase Loans
C) Refinancings
D) Home Improvement Loans
E) Loans on Dwellings For 5+ Families
F) Non-occupant Loans on < 5 Family Dwellings (A B C & D)
G) Loans On Manufactured Home Dwelling (A B C & D)
Number
Average Value
Number
Average Value
Number
Average Value
Number
Average Value
Number
Average Value
Number
Average Value
LOANS ORIGINATED
50
$170,474
50
$149,281
14
$44,115
1
$2,910,430
7
$169,231
5
$45,236
APPLICATIONS APPROVED, NOT ACCEPTED
9
$143,674
12
$153,112
3
$76,083
0
$0
0
$0
0
$0
APPLICATIONS DENIED
19
$121,164
41
$177,591
14
$97,526
0
$0
3
$145,280
8
$52,285
APPLICATIONS WITHDRAWN
6
$140,117
12
$143,215
1
$196,230
0
$0
0
$0
1
$41,310
FILES CLOSED FOR INCOMPLETENESS
2
$104,830
5
$236,718
0
$0
0
$0
0
$0
1
$51,640
Aggregated Statistics For Year 2006 (Based on 2 partial tracts)
B) Conventional Home Purchase Loans
C) Refinancings
D) Home Improvement Loans
F) Non-occupant Loans on < 5 Family Dwellings (A B C & D)
G) Loans On Manufactured Home Dwelling (A B C & D)
Number
Average Value
Number
Average Value
Number
Average Value
Number
Average Value
Number
Average Value
LOANS ORIGINATED
39
$165,672
60
$119,719
24
$52,630
6
$169,723
2
$46,990
APPLICATIONS APPROVED, NOT ACCEPTED
6
$117,395
13
$108,444
1
$20,660
2
$129,100
0
$0
APPLICATIONS DENIED
10
$144,799
30
$132,577
26
$67,847
5
$119,598
3
$68,853
APPLICATIONS WITHDRAWN
6
$134,780
24
$148,379
4
$113,608
2
$180,740
0
$0
FILES CLOSED FOR INCOMPLETENESS
1
$260,270
11
$189,284
1
$10,330
0
$0
0
$0
Aggregated Statistics For Year 2005 (Based on 2 partial tracts)
A) FHA, FSA/RHS & VA Home Purchase Loans
B) Conventional Home Purchase Loans
C) Refinancings
D) Home Improvement Loans
E) Loans on Dwellings For 5+ Families
F) Non-occupant Loans on < 5 Family Dwellings (A B C & D)
G) Loans On Manufactured Home Dwelling (A B C & D)
Number
Average Value
Number
Average Value
Number
Average Value
Number
Average Value
Number
Average Value
Number
Average Value
Number
Average Value
LOANS ORIGINATED
1
$192,100
71
$177,409
76
$137,199
29
$47,616
0
$0
9
$190,723
2
$66,615
APPLICATIONS APPROVED, NOT ACCEPTED
0
$0
10
$190,965
12
$86,669
3
$32,017
0
$0
2
$183,320
0
$0
APPLICATIONS DENIED
0
$0
14
$125,854
37
$135,325
17
$39,611
0
$0
0
$0
4
$58,352
APPLICATIONS WITHDRAWN
0
$0
11
$138,865
39
$142,685
3
$105,690
0
$0
1
$66,100
0
$0
FILES CLOSED FOR INCOMPLETENESS
0
$0
1
$200,360
12
$160,428
0
$0
2
$97,600
0
$0
0
$0
Aggregated Statistics For Year 2004 (Based on 2 partial tracts)
A) FHA, FSA/RHS & VA Home Purchase Loans
B) Conventional Home Purchase Loans
C) Refinancings
D) Home Improvement Loans
F) Non-occupant Loans on < 5 Family Dwellings (A B C & D)
G) Loans On Manufactured Home Dwelling (A B C & D)


 Nearest zip codes: 12417, 12574, 12487, 12429, 12411, 12471.