Estimated zip code population in 2022: 5,949 Zip code population in 2010: 6,309 Zip code population in 2000: 5,779
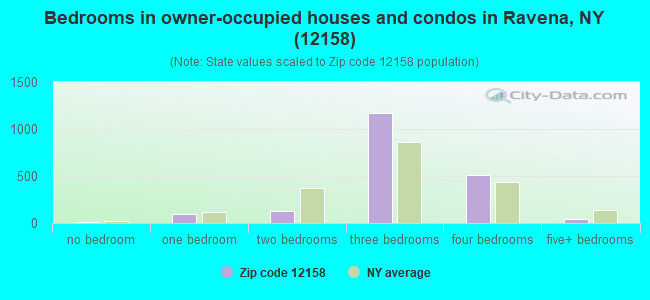
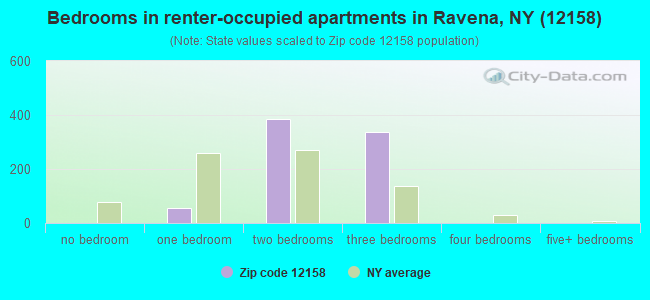
Houses and condos: 3,242 Renter-occupied apartments: 787
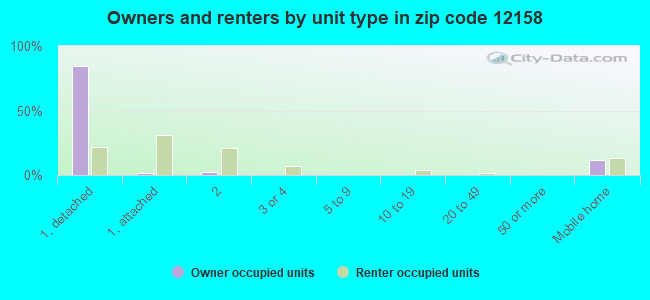
% of renters here:
29%
State:
46%
March 2022 cost of living index in zip code 12158: 107.2 (more than average, U.S. average is 100)
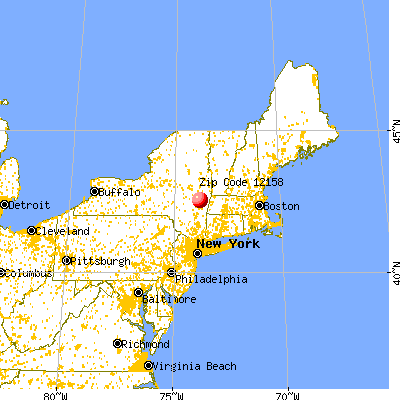
Land area: 30.6 sq. mi. Water area: 0.9 sq. mi.
Population density: 194 people per square mile
(very low).
OSM Map
General Map
Google Map
MSN Map
OSM Map
General Map
Google Map
MSN Map
OSM Map
General Map
Google Map
MSN Map
OSM Map
General Map
Google Map
MSN Map
Please wait while loading the map...
Real estate property taxes paid for housing units in 2022:
This zip code:
1.9% ($5,497)
New York:
1.5% ($6,180)
Median real estate property taxes paid for housing units with mortgages in 2022: $6,000 (1.9%) Median real estate property taxes paid for housing units with no mortgage in 2022: $4,714 (1.8%)
Business Search- 14 Million verified businesses
Males: 3,093
(52.0%)
Females: 2,856
(48.0%)
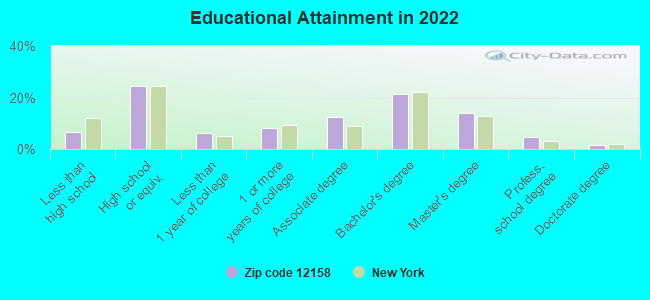
For population 25 years and over in 12158:
High school or higher: 93.5%
Bachelor's degree or higher: 41.7%
Graduate or professional degree: 20.5%
Unemployed: 1.3%
Mean travel time to work (commute): 23.2 minutes
For population 15 years and over in 12158:
Never married: 20.1%
Now married: 56.4%
Separated: 0.5%
Widowed: 11.5%
Divorced: 11.5%
Zip code 12158 compared to state average:
Unemployed percentage significantly below state average.
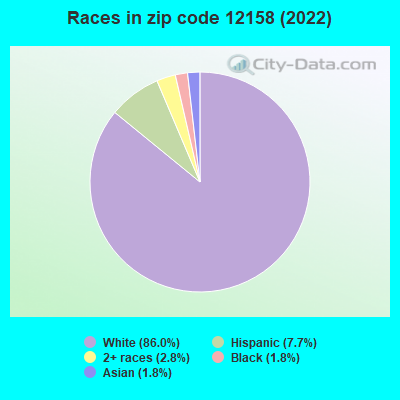
Black race population percentage significantly below state average.
Hispanic race population percentage below state average.
Median age significantly above state average.
Foreign-born population percentage below state average.
Renting percentage below state average.
Length of stay since moving in significantly above state average.
Estimated median house/condo value in 2022: $289,276
12158:
$289,276
New York:
$400,400
According to our research of New York and other state lists, there were 4 registered sex offenders living in 12158 zip code as of June 01, 2024. The ratio of all residents to sex offenders in zip code 12158 is 1,798 to 1. The ratio of registered sex offenders to all residents in this zip code is lower than the state average.
Median resident age:
This zip code:
51.0 years
New York median age:
40.0 years
Average household size:
This zip code:
2.2 people
New York:
2.5 people
Averages for the 2020 tax year for zip code 12158, filed in 2021:
Average Adjusted Gross Income (AGI) in 2020: $81,195 (Individual Income Tax Returns)
Here:
$81,195
State:
$90,930
Salary/wage: $73,342 (reported on 81.5% of returns)
Here:
$73,342
State:
$72,104
(% of AGI for various income ranges: 1136.3% for AGIs below $25k, 3369.2% for AGIs $25k-50k, 5915.2% for AGIs $50k-75k, 9198.5% for AGIs $75k-100k, 18518.8% for AGIs $100k-200k, 74828.6% for AGIs over 200k)
Taxable interest for individuals: $802 (reported on 43.2% of returns)
This zip code:
$802
New York:
$3,075
(% of AGI for various income ranges: 17.3% for AGIs below $25k, 10.3% for AGIs $25k-50k, 23.1% for AGIs $50k-75k, 107.0% for AGIs $75k-100k, 86.0% for AGIs $100k-200k, 422.9% for AGIs over 200k)
Ordinary dividends: $3,183 (reported on 22.4% of returns)
Here:
$3,183
State:
$11,095
(% of AGI for various income ranges: 15.3% for AGIs below $25k, 23.3% for AGIs $25k-50k, 60.0% for AGIs $50k-75k, 152.6% for AGIs $75k-100k, 217.0% for AGIs $100k-200k, 945.7% for AGIs over 200k)
Net capital gain/loss in AGI: +$10,008 (reported on 18.2% of returns)
Here:
+$10,008
State:
+$44,925
(% of AGI for various income ranges: 22.9% for AGIs $25k-50k, 56.2% for AGIs $50k-75k, 137.8% for AGIs $75k-100k, 353.0% for AGIs $100k-200k, 5781.4% for AGIs over 200k)
Profit/loss from business: +$17,516 (reported on 10.9% of returns)
Here:
+$17,516
State:
+$14,940
(% of AGI for various income ranges: 129.8% for AGIs below $25k, 90.3% for AGIs $25k-50k, 122.6% for AGIs $50k-75k, 166.3% for AGIs $75k-100k, 294.0% for AGIs $100k-200k, 4442.9% for AGIs over 200k)
Taxable individual retirement arrangement distribution: $15,155 (reported on 9.7% of returns)
12158:
$15,155
New York:
$19,609
(% of AGI for various income ranges: 51.0% for AGIs below $25k, 73.8% for AGIs $25k-50k, 152.4% for AGIs $50k-75k, 294.8% for AGIs $75k-100k, 497.5% for AGIs $100k-200k, 1214.3% for AGIs over 200k)
Self-employed (Keogh) retirement plans: $29,050 (reported on 0.6% of returns)
12158:
$29,050
New York:
$32,497
(% of AGI for various income ranges: 92.2% for AGIs $25k-50k)
Total itemized deductions: $28,014 (reported on 8.2% of returns)
Here:
$28,014
State:
$39,326
(% of AGI for various income ranges: 135.6% for AGIs $25k-50k, 194.5% for AGIs $50k-75k, 598.5% for AGIs $75k-100k, 678.0% for AGIs $100k-200k, 2635.7% for AGIs over 200k)
Charity contributions: $6,335 (reported on 6.8% of returns)
Here:
$6,335
State:
$15,420
(% of AGI for various income ranges: 41.0% for AGIs $50k-75k, 61.9% for AGIs $75k-100k, 134.5% for AGIs $100k-200k, 828.6% for AGIs over 200k)
Taxes paid: $9,079 (reported on 8.2% of returns)
12158:
$9,079
State:
$9,183
(% of AGI for various income ranges: 33.3% for AGIs $25k-50k, 81.0% for AGIs $50k-75k, 199.6% for AGIs $75k-100k, 237.2% for AGIs $100k-200k, 720.0% for AGIs over 200k)
Earned income credit: $2,170 (reported on 7.9% of returns)
Here:
$2,170
State:
$2,138
(% of AGI for various income ranges: 68.2% for AGIs below $25k, 37.8% for AGIs $25k-50k)
Percentage of individuals using paid preparers for their 2020 taxes: 94.1%
Here:
94%
State:
95%
(% for various income ranges: 90.7% for AGIs below $25k, 94.8% for AGIs $25k-50k, 94.5% for AGIs $50k-75k, 95.1% for AGIs $75k-100k, 95.8% for AGIs $100k-200k, 95.2% for AGIs over 200k)
Averages for the 2012 tax year for zip code 12158, filed in 2013:
Average Adjusted Gross Income (AGI) in 2012: $63,756 (Individual Income Tax Returns)
Here:
$63,756
State:
$77,088
Salary/wage: $58,893 (reported on 83.7% of returns)
Here:
$58,893
State:
$60,593
(% of AGI for various income ranges: 68.3% for AGIs below $25k, 78.0% for AGIs $25k-50k, 74.8% for AGIs $50k-75k, 81.6% for AGIs $75k-100k, 80.5% for AGIs $100k-200k, 69.6% for AGIs over 200k)
Taxable interest for individuals: $608 (reported on 46.5% of returns)
This zip code:
$608
New York:
$3,125
(% of AGI for various income ranges: 0.8% for AGIs below $25k, 0.3% for AGIs $25k-50k, 0.5% for AGIs $50k-75k, 0.7% for AGIs $75k-100k, 0.3% for AGIs $100k-200k, 0.3% for AGIs over 200k)
Ordinary dividends: $2,126 (reported on 25.0% of returns)
Here:
$2,126
State:
$10,299
(% of AGI for various income ranges: 1.5% for AGIs below $25k, 0.7% for AGIs $25k-50k, 0.6% for AGIs $50k-75k, 0.8% for AGIs $75k-100k, 0.7% for AGIs $100k-200k, 1.4% for AGIs over 200k)
Net capital gain/loss in AGI: +$2,691 (reported on 14.4% of returns)
Here:
+$2,691
State:
+$42,474
(% of AGI for various income ranges: 0.2% for AGIs $50k-75k, 0.4% for AGIs $75k-100k, 0.7% for AGIs $100k-200k, 1.9% for AGIs over 200k)
Profit/loss from business: +$12,088 (reported on 12.8% of returns)
Here:
+$12,088
State:
+$16,168
(% of AGI for various income ranges: 6.4% for AGIs below $25k, 2.3% for AGIs $25k-50k, 1.7% for AGIs $50k-75k, 0.9% for AGIs $75k-100k, 2.0% for AGIs $100k-200k, 4.8% for AGIs over 200k)
Taxable individual retirement arrangement distribution: $13,063 (reported on 9.6% of returns)
12158:
$13,063
New York:
$17,621
(% of AGI for various income ranges: 2.5% for AGIs below $25k, 1.7% for AGIs $25k-50k, 1.7% for AGIs $50k-75k, 1.8% for AGIs $75k-100k, 2.9% for AGIs $100k-200k)
Self-employment retirement plans: $16,900 (reported on 1.0% of returns)
12158:
$16,900
New York:
$27,330
Total itemized deductions: $22,110 (21% of AGI, reported on 40.1% of returns)
Here:
$22,110
State:
$34,985
Here:
20.6% of AGI
State:
21.3% of AGI
(% of AGI for various income ranges: 7.3% for AGIs below $25k, 9.4% for AGIs $25k-50k, 12.2% for AGIs $50k-75k, 15.5% for AGIs $75k-100k, 16.2% for AGIs $100k-200k, 14.9% for AGIs over 200k)
Charity contributions: $2,373 (reported on 32.7% of returns)
Here:
$2,373
State:
$5,572
(% of AGI for various income ranges: 0.3% for AGIs below $25k, 0.7% for AGIs $25k-50k, 1.0% for AGIs $50k-75k, 1.2% for AGIs $75k-100k, 1.4% for AGIs $100k-200k, 1.8% for AGIs over 200k)
Taxes paid: $11,622 (reported on 40.1% of returns)
12158:
$11,622
State:
$18,656
(% of AGI for various income ranges: 2.5% for AGIs below $25k, 3.4% for AGIs $25k-50k, 6.1% for AGIs $50k-75k, 7.4% for AGIs $75k-100k, 9.0% for AGIs $100k-200k, 9.7% for AGIs over 200k)
Earned income credit: $1,945 (reported on 10.6% of returns)
Here:
$1,945
State:
$2,230
(% of AGI for various income ranges: 4.2% for AGIs below $25k, 0.7% for AGIs $25k-50k)
Percentage of individuals using paid preparers for their 2012 taxes: 51.3%
Here:
51%
State:
66%
(% for various income ranges: 45.1% for AGIs below $25k, 49.3% for AGIs $25k-50k, 56.6% for AGIs $50k-75k, 57.1% for AGIs $75k-100k, 52.7% for AGIs $100k-200k, 66.7% for AGIs over 200k)
Averages for the 2004 tax year for zip code 12158, filed in 2005:
Average Adjusted Gross Income (AGI) in 2004: $49,540 (Individual Income Tax Returns)
Here:
$49,540
State:
$59,519
Salary/wage: $47,419 (reported on 87.3% of returns)
Here:
$47,419
State:
$50,673
(% of AGI for various income ranges: 95.2% for AGIs below $10k, 71.2% for AGIs $10k-25k, 84.3% for AGIs $25k-50k, 84.3% for AGIs $50k-75k, 89.3% for AGIs $75k-100k, 80.8% for AGIs over 100k)
Taxable interest for individuals: $936 (reported on 57.2% of returns)
This zip code:
$936
New York:
$2,377
(% of AGI for various income ranges: 4.3% for AGIs below $10k, 1.8% for AGIs $10k-25k, 1.3% for AGIs $25k-50k, 0.9% for AGIs $50k-75k, 0.5% for AGIs $75k-100k, 1.2% for AGIs over 100k)
Taxable dividends: $1,855 (reported on 26.8% of returns)
Here:
$1,855
State:
$5,394
(% of AGI for various income ranges: 2.9% for AGIs below $10k, 0.7% for AGIs $10k-25k, 0.7% for AGIs $25k-50k, 0.6% for AGIs $50k-75k, 0.6% for AGIs $75k-100k, 1.7% for AGIs over 100k)
Net capital gain/loss: +$2,382 (reported on 18.5% of returns)
Here:
+$2,382
State:
+$23,581
(% of AGI for various income ranges: -1.5% for AGIs below $10k, 0.4% for AGIs $10k-25k, 0.2% for AGIs $25k-50k, 0.0% for AGIs $50k-75k, 1.0% for AGIs $75k-100k, 2.0% for AGIs over 100k)
Profit/loss from business: +$10,330 (reported on 11.5% of returns)
Here:
+$10,330
State:
+$13,809
(% of AGI for various income ranges: 1.8% for AGIs below $10k, 4.8% for AGIs $10k-25k, 1.3% for AGIs $25k-50k, 2.5% for AGIs $50k-75k, 1.2% for AGIs $75k-100k, 3.4% for AGIs over 100k)
IRA payment deduction: $2,879 (reported on 2.2% of returns)
12158:
$2,879
New York:
$3,115
(% of AGI for various income ranges: 0.4% for AGIs $10k-25k, 0.2% for AGIs $25k-50k, 0.1% for AGIs $50k-75k, 0.2% for AGIs $75k-100k)
Self-employed pension: $9,000 (reported on 1.2% of returns)
Here:
$9,000
New York:
$19,016
Total itemized deductions: $17,223 (21% of AGI, reported on 38.4% of returns)
Here:
$17,223
State:
$25,864
Here:
20.6% of AGI
State:
21.9% of AGI
(% of AGI for various income ranges: 7.1% for AGIs below $10k, 6.2% for AGIs $10k-25k, 8.9% for AGIs $25k-50k, 13.8% for AGIs $50k-75k, 16.4% for AGIs $75k-100k, 15.6% for AGIs over 100k)
Charity contributions deductions: $2,009 (2% of AGI, reported on 34.8% of returns)
Here:
$2,009
State:
$4,439
Here:
2.3% of AGI
State:
3.6% of AGI
(% of AGI for various income ranges: 0.7% for AGIs $10k-25k, 0.8% for AGIs $25k-50k, 1.5% for AGIs $50k-75k, 1.5% for AGIs $75k-100k, 1.9% for AGIs over 100k)
Total tax: $6,485 (reported on 81.5% of returns)
12158:
$6,485
State:
$11,730
(% of AGI for various income ranges: 2.2% for AGIs below $10k, 4.2% for AGIs $10k-25k, 7.8% for AGIs $25k-50k, 9.4% for AGIs $50k-75k, 9.7% for AGIs $75k-100k, 15.5% for AGIs over 100k)
Earned income credit: $1,596 (reported on 9.9% of returns)
Here:
$1,596
State:
$1,757
Percentage of individuals using paid preparers for their 2004 taxes: 53.7%
Here:
54%
State:
67%
(% for various income ranges: 46.2% for AGIs below $10k, 53.8% for AGIs $10k-25k, 55.1% for AGIs $25k-50k, 57.9% for AGIs $50k-75k, 53.4% for AGIs $75k-100k, 55.6% for AGIs over 100k)
Likely homosexual households (counted as self-reported same-sex unmarried-partner households)
Lesbian couples: 0.0% of all households
Gay men: 0.8% of all households
Household received Food Stamps/SNAP in the past 12 months: 103 Household did not receive Food Stamps/SNAP in the past 12 months: 2,603
Women who had a birth in the past 12 months: 88 (59 now married, 29 unmarried) Women who did not have a birth in the past 12 months: 733 (417 now married, 308 unmarried)
Housing units in zip code 12158 with a mortgage: 808 (173 second mortgage, 15 home equity loan, 105 both second mortgage and home equity loan) Houses without a mortgage: 24
Median monthly owner costs for units with a mortgage: $2,068 Median monthly owner costs for units without a mortgage: $797
Residents with income below the poverty level in 2022:
This zip code:
7.0%
Whole state:
14.3%
Residents with income below 50% of the poverty level in 2022:
This zip code:
1.5%
Whole state:
6.8%
Median number of rooms in houses and condos:
Here:
6.1
State:
6.3
Median number of rooms in apartments:
Here:
4.7
State:
3.8
Notable locations in this zip code not listed on our city pages
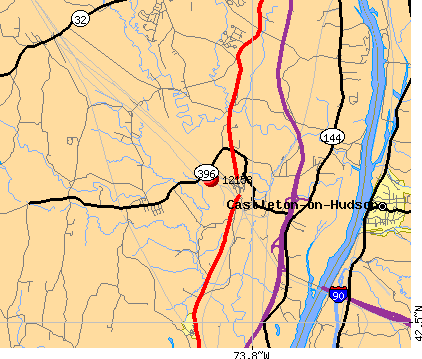
Notable locations in zip code 12158: Mallorys Corners (A), Meyers Corners (B), Majestic Tree Farm (C), Selkirk Fire Company 3 (D), Selkirk Fire Department (E). Display/hide their locations on the map
Streams, rivers, and creeks: Phillipin Kill (A), Feuri Spruyt (B), Dowers Kill (C), Binnen Kill (D), Vloman Kill (E), Onesquethaw Creek (F), Mosher Brook (G), Baker Creek (H). Display/hide their locations on the map
Size of family households: 822 2-persons, 496 3-persons, 279 4-persons, 107 5-persons, 15 6-persons, 49 7-or-more-persons
Size of nonfamily households: 875 1-person, 98 2-persons
710 married couples with children.
322 single-parent households (193 men, 129 women).
84.8% of residents of 12158 zip code speak English at home.
6.2% of residents speak Spanish at home (65% very well, 3% well, 33% not well).
5.8% of residents speak other Indo-European language at home (84% very well, 3% well, 13% not well).
2.0% of residents speak Asian or Pacific Island language at home (100% very well).
1.3% of residents speak other language at home (100% very well).
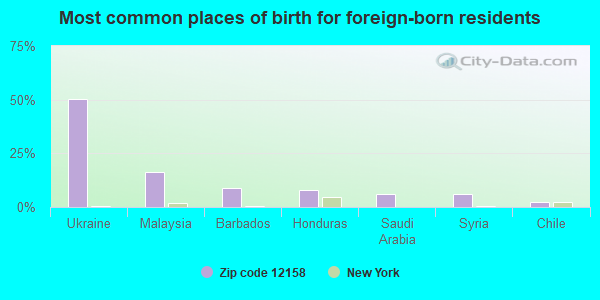
Foreign born population: 642 (10.8%) (73.9% of them are naturalized citizens)
This zip code:
10.8%
Whole state:
22.7%
50%Ukraine
16%Malaysia
9%Barbados
8%Honduras
6%Saudi Arabia
6%Syria
2%Chile
15%Italian
12%American
10%Russian
8%Irish
5%Polish
5%English
5%German
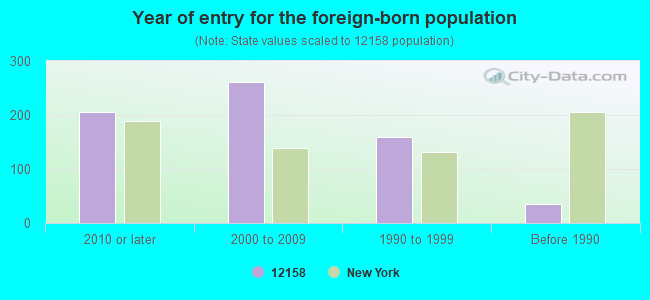
Year of entry for the foreign-born population
2062010 or later
2622000 to 2009
1601990 to 1999
36Before 1990
Public elementary/middle school in in zip code 12158 not listed on the city page:
Facilities with environmental interests located in this zip code:
ALBERTUS W. BECKER SCHOOL ( in SELKIRK, NY)
(National Center for Education Statistics) - STATE ID-010402060002 Organizations: RAVENA-COEYMANS-SELKIRK CSD (SCHOOL DISTRICT)
BETHLEHEM TOWN OF HIGHWAY DEPT (74 ELM AVE E in SELKIRK, NY)
Small Quantity Generators, between 100 kg and 1000 kg of hazardous waste/month (Resource Conservation and Recovery Act (tracking hazardous waste)) - notification (Resource Conservation and Recovery Act (tracking hazardous waste)) Organizations: TOWN OF BETHLEHEM (CONTACT/OWNER)
Alternative names: LAIDLAW SELKIRK TOWN OF HIGHWAY DEPT
ANCHOR MOTOR FREIGHT (LONG LANE in SELKIRK, NY)
(Resource Conservation and Recovery Act (tracking hazardous waste))
CIANBRO CORP (RTE 144 RIVER RD BOX 99 in SELKIRK, NY)
(Resource Conservation and Recovery Act (tracking hazardous waste))
HERBERT F CLARK JR INC (ELM AVE in SELKIRK, NY)
TRANSPORTER (Resource Conservation and Recovery Act (tracking hazardous waste)) - notification Organizations: HER F CLARK JR INC (CONTACT/OWNER)
COUNTRY CARRIAGE AUTO SALES (1178 RTE 9W in SELKIRK, NY)
Conditionally Exempt Small Quantity Generators, less than 100 kg/month of hazardous waste (Resource Conservation and Recovery Act (tracking hazardous waste)) - notification Organizations: JOHN PITTZ (CONTACT/OWNER)
CROSS BROTHERS TRANSPORTATION INC (205A MAPLE AVE in SELKIRK, NY)
COMMERCIAL CARRIERS INC (252 ELM AVE in SELKIRK, NY)
Conditionally Exempt Small Quantity Generators, less than 100 kg/month of hazardous waste (Resource Conservation and Recovery Act (tracking hazardous waste)) - notification Organizations: TIMOTHY OBRIEN (CONTACT/OWNER)
CONRAIL SELKIRK CAR SHOP (CAR SHOP BLDG RD 2 in SELKIRK, NY)
Conditionally Exempt Small Quantity Generators, less than 100 kg/month of hazardous waste (Resource Conservation and Recovery Act (tracking hazardous waste))
Housing units lacking complete plumbing facilities: 1.7% Housing units lacking complete kitchen facilities: 1.5%
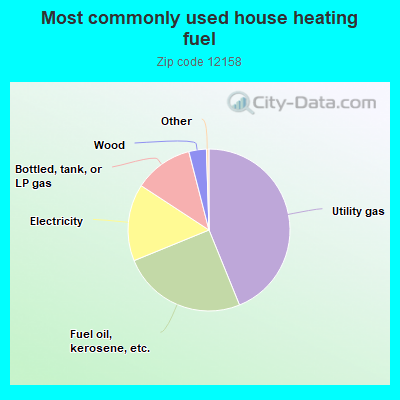
43.9%Utility gas
25.0%Fuel oil, kerosene, etc.
15.4%Electricity
11.8%Bottled, tank, or LP gas
3.5%Wood
Population in 1990: 6,062.
Place of birth for U.S.-born residents:
This state: 4,495
Northeast: 388
Midwest: 35
South: 266
West: 85
62% of the 12158 zip code residents lived in the same house 5 years ago. Out of people who lived in different houses, 74% lived in this county. Out of people who lived in different counties, 50% lived in New York.
90% of the 12158 zip code residents lived in the same house 1 year ago. Out of people who lived in different houses, 62% moved from this county. Out of people who lived in different houses, 21% moved from different county within same state. Out of people who lived in different houses, 14% moved from different state. Out of people who lived in different houses, 2% moved from abroad.
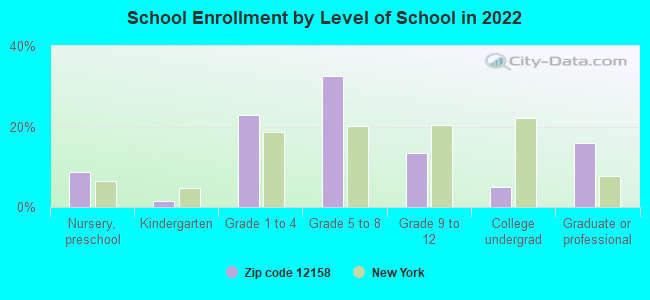
Private vs. public school enrollment:
Students in private schools in grades 1 to 8 (elementary and middle school): 93
Here:
15.4%
New York:
15.6%
Students in private schools in grades 9 to 12 (high school): 11
Here:
7.9%
New York:
15.0%
Students in private undergraduate colleges: 5
Here:
10.5%
New York:
39.2%
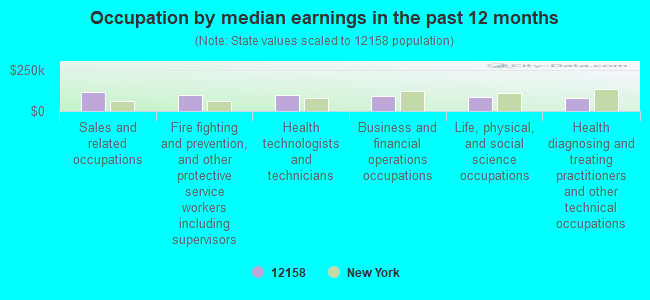
Occupation by median earnings in the past 12 months ($)
115,950Sales and related occupations
99,289Fire fighting and prevention, and other protective service workers including supervisors
96,855Health technologists and technicians
94,481Business and financial operations occupations
82,585Life, physical, and social science occupations
81,366Health diagnosing and treating practitioners and other technical occupations
Top industries in this zip code by the number of employees in 2005:
Management of Companies and Enterprises: Corporate, Subsidiary, and Regional Managing Offices (50-99 employees: 1 establishment)
Construction: Highway, Street, and Bridge Construction (20-49: 1, 10-19: 1, 1-4: 1)
Health Care and Social Assistance: Other Residential Care Facilities (20-49: 1)
Wholesale Trade: Roofing, Siding, and Insulation Material Merchant Wholesalers (20-49: 1)
Real Estate and Rental and Leasing: Truck, Utility Trailer, and RV (Recreational Vehicle) Rental and Leasing (20-49: 1)
Real Estate and Rental and Leasing: Construction, Mining, and Forestry Machinery and Equipment Rental and Leasing (20-49: 1)
Construction: Site Preparation Contractors (10-19: 1, 1-4: 1)
People in group quarters in 2000:
33 people in homes or halfway houses for drug/alcohol abuse
24 people in nursing homes
16 people in other group homes
11 people in short-term care, detention or diagnostic centers for delinquent children
Fatal accident statistics in 2014:
Fatal accident count: 1
Vehicles involved in fatal accidents: 1
Fatal accidents caused by drunken drivers: 0
Fatalities: 1
Persons involved in fatal accidents: 1
Pedestrians involved in fatal accidents: 1
Fatal accident statistics in 2012:
Fatal accident count: 1
Vehicles involved in fatal accidents: 1
Fatal accidents caused by drunken drivers: 0
Fatalities: 1
Persons involved in fatal accidents: 1
Pedestrians involved in fatal accidents: 0
Home Mortgage Disclosure Act Aggregated Statistics For Year 2009 (Based on 6 partial tracts)
A) FHA, FSA/RHS & VA Home Purchase Loans
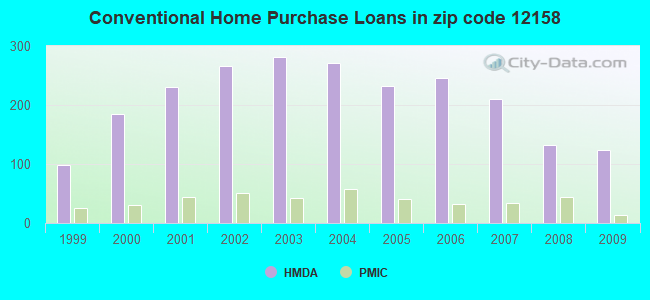
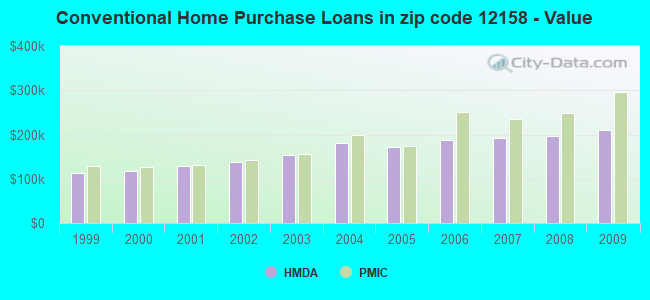
B) Conventional Home Purchase Loans
C) Refinancings
D) Home Improvement Loans
F) Non-occupant Loans on < 5 Family Dwellings (A B C & D)
G) Loans On Manufactured Home Dwelling (A B C & D)
Number
Average Value
Number
Average Value
Number
Average Value
Number
Average Value
Number
Average Value
Number
Average Value
LOANS ORIGINATED
46
$198,331
123
$209,084
339
$179,487
29
$50,546
13
$160,952
2
$45,110
APPLICATIONS APPROVED, NOT ACCEPTED
4
$200,492
25
$208,166
39
$197,126
4
$65,257
2
$117,035
2
$36,355
APPLICATIONS DENIED
5
$154,346
13
$183,438
102
$217,899
19
$62,938
4
$222,080
3
$35,590
APPLICATIONS WITHDRAWN
11
$203,024
7
$258,540
68
$185,227
1
$123,140
2
$314,940
0
$0
FILES CLOSED FOR INCOMPLETENESS
3
$274,057
1
$105,350
9
$251,303
0
$0
0
$0
0
$0
Aggregated Statistics For Year 2008 (Based on 6 partial tracts)
A) FHA, FSA/RHS & VA Home Purchase Loans
B) Conventional Home Purchase Loans
C) Refinancings
D) Home Improvement Loans
F) Non-occupant Loans on < 5 Family Dwellings (A B C & D)
G) Loans On Manufactured Home Dwelling (A B C & D)
Number
Average Value
Number
Average Value
Number
Average Value
Number
Average Value
Number
Average Value
Number
Average Value
LOANS ORIGINATED
41
$206,282
132
$197,673
172
$177,496
50
$47,923
12
$115,787
13
$48,227
APPLICATIONS APPROVED, NOT ACCEPTED
3
$138,987
32
$200,741
22
$178,905
5
$63,446
3
$149,590
3
$39,287
APPLICATIONS DENIED
8
$144,848
15
$141,773
112
$195,825
36
$25,929
3
$61,610
7
$51,174
APPLICATIONS WITHDRAWN
6
$167,517
13
$160,371
59
$204,000
8
$148,076
0
$0
3
$104,260
FILES CLOSED FOR INCOMPLETENESS
1
$240,800
10
$214,123
18
$180,533
0
$0
0
$0
0
$0
Aggregated Statistics For Year 2007 (Based on 6 partial tracts)
A) FHA, FSA/RHS & VA Home Purchase Loans
B) Conventional Home Purchase Loans
C) Refinancings
D) Home Improvement Loans
E) Loans on Dwellings For 5+ Families
F) Non-occupant Loans on < 5 Family Dwellings (A B C & D)
G) Loans On Manufactured Home Dwelling (A B C & D)
Number
Average Value
Number
Average Value
Number
Average Value
Number
Average Value
Number
Average Value
Number
Average Value
Number
Average Value
LOANS ORIGINATED
18
$188,473
210
$191,116
168
$156,809
46
$62,198
0
$0
10
$175,447
4
$33,578
APPLICATIONS APPROVED, NOT ACCEPTED
0
$0
28
$164,335
37
$153,634
10
$75,037
0
$0
1
$109,460
2
$33,150
APPLICATIONS DENIED
4
$170,078
32
$144,951
149
$192,735
52
$48,211
0
$0
4
$93,358
8
$82,278
APPLICATIONS WITHDRAWN
1
$163,830
13
$144,038
79
$180,676
12
$90,454
2
$168,115
3
$138,280
0
$0
FILES CLOSED FOR INCOMPLETENESS
0
$0
14
$164,287
26
$225,140
5
$91,780
0
$0
0
$0
0
$0
Aggregated Statistics For Year 2006 (Based on 6 partial tracts)
A) FHA, FSA/RHS & VA Home Purchase Loans
B) Conventional Home Purchase Loans
C) Refinancings
D) Home Improvement Loans
E) Loans on Dwellings For 5+ Families
F) Non-occupant Loans on < 5 Family Dwellings (A B C & D)
G) Loans On Manufactured Home Dwelling (A B C & D)
Number
Average Value
Number
Average Value
Number
Average Value
Number
Average Value
Number
Average Value
Number
Average Value
Number
Average Value
LOANS ORIGINATED
12
$152,148
245
$187,222
225
$147,082
69
$51,514
1
$566,970
21
$193,395
2
$56,505
APPLICATIONS APPROVED, NOT ACCEPTED
0
$0
30
$158,259
47
$128,276
16
$44,164
0
$0
5
$126,528
2
$49,245
APPLICATIONS DENIED
1
$237,900
36
$139,522
142
$147,928
43
$82,217
0
$0
6
$163,267
6
$47,353
APPLICATIONS WITHDRAWN
2
$180,520
24
$194,726
106
$159,178
5
$45,792
0
$0
3
$158,710
0
$0
FILES CLOSED FOR INCOMPLETENESS
0
$0
18
$135,442
42
$157,075
1
$41,050
0
$0
1
$239,430
0
$0
Aggregated Statistics For Year 2005 (Based on 6 partial tracts)
A) FHA, FSA/RHS & VA Home Purchase Loans
B) Conventional Home Purchase Loans
C) Refinancings
D) Home Improvement Loans
F) Non-occupant Loans on < 5 Family Dwellings (A B C & D)
G) Loans On Manufactured Home Dwelling (A B C & D)
Number
Average Value
Number
Average Value
Number
Average Value
Number
Average Value
Number
Average Value
Number
Average Value
LOANS ORIGINATED
6
$135,288
232
$172,577
292
$141,350
87
$49,920
15
$115,263
8
$41,801
APPLICATIONS APPROVED, NOT ACCEPTED
0
$0
34
$180,659
39
$121,201
12
$26,022
4
$125,355
0
$0
APPLICATIONS DENIED
1
$112,410
25
$101,941
113
$124,404
49
$48,951
4
$154,578
15
$40,899
APPLICATIONS WITHDRAWN
1
$136,820
25
$129,262
146
$142,206
19
$133,033
4
$58,552
4
$51,650
FILES CLOSED FOR INCOMPLETENESS
0
$0
13
$160,796
38
$215,257
2
$142,210
0
$0
0
$0
Aggregated Statistics For Year 2004 (Based on 6 partial tracts)
A) FHA, FSA/RHS & VA Home Purchase Loans
B) Conventional Home Purchase Loans
C) Refinancings
D) Home Improvement Loans
E) Loans on Dwellings For 5+ Families
F) Non-occupant Loans on < 5 Family Dwellings (A B C & D)
G) Loans On Manufactured Home Dwelling (A B C & D)
Number
Average Value
Number
Average Value
Number
Average Value
Number
Average Value
Number
Average Value
Number
Average Value
Number
Average Value
LOANS ORIGINATED
7
$132,654
272
$179,823
325
$131,637
60
$39,842
1
$4,788,700
10
$132,110
3
$100,770
APPLICATIONS APPROVED, NOT ACCEPTED
1
$307,840
25
$141,380
54
$126,998
9
$42,476
0
$0
0
$0
0
$0
APPLICATIONS DENIED
3
$103,057
19
$156,615
120
$115,732
38
$45,967
0
$0
2
$33,830
6
$34,635
APPLICATIONS WITHDRAWN
4
$110,782
18
$166,587
141
$113,725
5
$40,532
0
$0
2
$210,765
1
$39,150
FILES CLOSED FOR INCOMPLETENESS
1
$284,590
14
$102,201
23
$149,062
6
$57,205
0
$0
0
$0
0
$0
Aggregated Statistics For Year 2003 (Based on 6 partial tracts)
A) FHA, FSA/RHS & VA Home Purchase Loans
B) Conventional Home Purchase Loans
C) Refinancings
D) Home Improvement Loans
E) Loans on Dwellings For 5+ Families
F) Non-occupant Loans on < 5 Family Dwellings (A B C & D)
Number
Average Value
Number
Average Value
Number
Average Value
Number
Average Value
Number
Average Value
Number
Average Value
LOANS ORIGINATED
30
$122,685
282
$153,232
649
$124,889
28
$32,979
0
$0
17
$98,994
APPLICATIONS APPROVED, NOT ACCEPTED
0
$0
18
$136,510
101
$115,231
7
$43,983
0
$0
3
$57,387
APPLICATIONS DENIED
2
$198,880
30
$106,252
141
$120,317
19
$21,672
0
$0
8
$101,692
APPLICATIONS WITHDRAWN
1
$93,960
17
$196,461
123
$113,217
6
$27,470
1
$4,788,700
2
$139,265
FILES CLOSED FOR INCOMPLETENESS
0
$0
4
$123,495
22
$133,153
0
$0
0
$0
1
$83,890
Aggregated Statistics For Year 2002 (Based on 6 partial tracts)
A) FHA, FSA/RHS & VA Home Purchase Loans
B) Conventional Home Purchase Loans
C) Refinancings
D) Home Improvement Loans
F) Non-occupant Loans on < 5 Family Dwellings (A B C & D)
Number
Average Value
Number
Average Value
Number
Average Value
Number
Average Value
Number
Average Value
LOANS ORIGINATED
20
$103,704
266
$137,007
356
$114,095
23
$19,774
17
$94,512
APPLICATIONS APPROVED, NOT ACCEPTED
8
$136,446
36
$117,831
40
$100,375
9
$21,969
0
$0
APPLICATIONS DENIED
2
$159,620
17
$84,521
109
$97,676
23
$16,525
3
$85,800
APPLICATIONS WITHDRAWN
1
$179,650
19
$126,690
64
$105,494
9
$14,497
0
$0
FILES CLOSED FOR INCOMPLETENESS
0
$0
2
$71,260
12
$90,443
0
$0
0
$0
Aggregated Statistics For Year 2001 (Based on 6 partial tracts)
A) FHA, FSA/RHS & VA Home Purchase Loans
B) Conventional Home Purchase Loans
C) Refinancings
D) Home Improvement Loans
F) Non-occupant Loans on < 5 Family Dwellings (A B C & D)
Number
Average Value
Number
Average Value
Number
Average Value
Number
Average Value
Number
Average Value
LOANS ORIGINATED
28
$109,655
231
$129,529
267
$99,136
31
$21,211
8
$75,898
APPLICATIONS APPROVED, NOT ACCEPTED
3
$73,317
30
$112,286
41
$88,151
3
$58,910
1
$132,040
APPLICATIONS DENIED
2
$45,685
41
$64,886
131
$87,702
30
$23,066
3
$112,330
APPLICATIONS WITHDRAWN
6
$105,398
21
$104,523
59
$87,499
4
$16,875
0
$0
FILES CLOSED FOR INCOMPLETENESS
0
$0
4
$106,240
16
$82,959
3
$7,753
0
$0
Aggregated Statistics For Year 2000 (Based on 6 partial tracts)
A) FHA, FSA/RHS & VA Home Purchase Loans
B) Conventional Home Purchase Loans
C) Refinancings
D) Home Improvement Loans
E) Loans on Dwellings For 5+ Families
F) Non-occupant Loans on < 5 Family Dwellings (A B C & D)
Number
Average Value
Number
Average Value
Number
Average Value
Number
Average Value
Number
Average Value
Number
Average Value
LOANS ORIGINATED
42
$106,175
184
$118,374
66
$70,560
50
$19,779
1
$22,090
9
$70,756
APPLICATIONS APPROVED, NOT ACCEPTED
2
$86,995
39
$118,159
14
$72,766
14
$19,781
0
$0
2
$39,895
APPLICATIONS DENIED
3
$79,080
44
$58,704
76
$69,636
28
$21,666
0
$0
4
$48,308
APPLICATIONS WITHDRAWN
1
$144,610
8
$72,034
43
$72,291
4
$32,525
0
$0
3
$86,653
FILES CLOSED FOR INCOMPLETENESS
0
$0
4
$119,375
8
$103,301
0
$0
0
$0
1
$68,410
Aggregated Statistics For Year 1999 (Based on 3 partial tracts)
A) FHA, FSA/RHS & VA Home Purchase Loans
B) Conventional Home Purchase Loans
C) Refinancings
D) Home Improvement Loans
F) Non-occupant Loans on < 5 Family Dwellings (A B C & D)
2002 - 2018 National Fire Incident Reporting System (NFIRS) incidents
Based on the data from the years 2002 - 2018 the average number of fire incidents per year is 15. The highest number of fire incidents - 35 took place in 2004, and the least - 1 in 2009. The data has a decreasing trend.
When looking into fire subcategories, the most reports belonged to: Structure Fires (43.3%), and Outside Fires (26.8%).
Fire incident types reported to NFIRS in Zip Code 12158


 Nearest zip codes: 12161, 12143, 12045, 12077, 12054, 12124.


 (Students: 461, Location: 1146 RT 9W, Grades: PK-5)


 Based on the data from the years 2002 - 2018 the average number of fire incidents per year is 15. The highest number of fire incidents - 35 took place in 2004, and the least - 1 in 2009. The data has a decreasing trend.
 When looking into fire subcategories, the most reports belonged to: Structure Fires (43.3%), and Outside Fires (26.8%).