Estimated zip code population in 2022: 1,250 Zip code population in 2010: 1,500 Zip code population in 2000: 1,270
Houses and condos: 1,191 Renter-occupied apartments: 46
% of renters here:
8%
State:
46%
March 2022 cost of living index in zip code 12076: 95.1 (less than average, U.S. average is 100)
Land area: 75.0 sq. mi. Water area: 1.9 sq. mi.
Population density: 17 people per square mile
(very low).
OSM Map
General Map
Google Map
MSN Map
OSM Map
General Map
Google Map
MSN Map
OSM Map
General Map
Google Map
MSN Map
OSM Map
General Map
Google Map
MSN Map
Please wait while loading the map...
Real estate property taxes paid for housing units in 2022:
This zip code:
1.3% ($2,608)
New York:
1.5% ($6,180)
Median real estate property taxes paid for housing units with mortgages in 2022: $2,704 (1.2%) Median real estate property taxes paid for housing units with no mortgage in 2022: $2,467 (1.4%)
Business Search- 14 Million verified businesses
Males: 605
(48.4%)
Females: 645
(51.6%)
For population 25 years and over in 12076:
High school or higher: 88.3%
Bachelor's degree or higher: 24.4%
Graduate or professional degree: 9.8%
Unemployed: 6.2%
Mean travel time to work (commute): 34.6 minutes
For population 15 years and over in 12076:
Never married: 21.3%
Now married: 59.1%
Separated: 1.0%
Widowed: 8.1%
Divorced: 10.4%
Zip code 12076 compared to state average:
Median house value below state average.
Black race population percentage significantly below state average.
Hispanic race population percentage significantly below state average.
Median age significantly above state average.
Foreign-born population percentage significantly below state average.
Renting percentage significantly below state average.
Length of stay since moving in significantly above state average.
Averages for the 2020 tax year for zip code 12076, filed in 2021:
Average Adjusted Gross Income (AGI) in 2020: $68,745 (Individual Income Tax Returns)
Here:
$68,745
State:
$90,930
Salary/wage: $60,383 (reported on 76.7% of returns)
Here:
$60,383
State:
$72,104
(% of AGI for various income ranges: 1213.0% for AGIs below $25k, 3280.9% for AGIs $25k-50k, 5760.0% for AGIs $50k-75k, 7432.0% for AGIs $75k-100k, 12425.0% for AGIs $100k-200k)
Taxable interest for individuals: $580 (reported on 41.7% of returns)
This zip code:
$580
New York:
$3,075
(% of AGI for various income ranges: 18.0% for AGIs below $25k, 12.7% for AGIs $25k-50k, 14.3% for AGIs $50k-75k, 26.0% for AGIs $75k-100k, 136.7% for AGIs $100k-200k)
Ordinary dividends: $2,808 (reported on 21.7% of returns)
Here:
$2,808
State:
$11,095
(% of AGI for various income ranges: 33.0% for AGIs below $25k, 31.8% for AGIs $25k-50k, 137.1% for AGIs $50k-75k, 335.0% for AGIs $100k-200k)
Net capital gain/loss in AGI: +$9,878 (reported on 15.0% of returns)
Here:
+$9,878
State:
+$44,925
(% of AGI for various income ranges: 81.4% for AGIs $50k-75k, 1403.3% for AGIs $100k-200k)
Profit/loss from business: +$4,114 (reported on 11.7% of returns)
Here:
+$4,114
State:
+$14,940
(% of AGI for various income ranges: 128.0% for AGIs below $25k, 65.7% for AGIs $50k-75k, 190.0% for AGIs $100k-200k)
Taxable individual retirement arrangement distribution: $13,667 (reported on 15.0% of returns)
12076:
$13,667
New York:
$19,609
(% of AGI for various income ranges: 291.0% for AGIs below $25k, 527.1% for AGIs $50k-75k, 950.0% for AGIs $100k-200k)
Earned income credit: $1,986 (reported on 11.7% of returns)
Here:
$1,986
State:
$2,138
(% of AGI for various income ranges: 86.0% for AGIs below $25k, 48.2% for AGIs $25k-50k)
Percentage of individuals using paid preparers for their 2020 taxes: 96.7%
Here:
97%
State:
95%
(% for various income ranges: 94.1% for AGIs below $25k, 100.0% for AGIs $25k-50k, 90.0% for AGIs $50k-75k, 100.0% for AGIs $75k-100k, 100.0% for AGIs $100k-200k, 100.0% for AGIs over 200k)
Averages for the 2012 tax year for zip code 12076, filed in 2013:
Average Adjusted Gross Income (AGI) in 2012: $44,825 (Individual Income Tax Returns)
Here:
$44,825
State:
$77,088
Salary/wage: $40,009 (reported on 75.4% of returns)
Here:
$40,009
State:
$60,593
(% of AGI for various income ranges: 63.5% for AGIs below $25k, 71.3% for AGIs $25k-50k, 70.7% for AGIs $50k-75k, 70.0% for AGIs $75k-100k, 60.2% for AGIs $100k-200k)
Taxable interest for individuals: $480 (reported on 43.9% of returns)
This zip code:
$480
New York:
$3,125
(% of AGI for various income ranges: 1.1% for AGIs below $25k, 0.3% for AGIs $25k-50k, 0.5% for AGIs $50k-75k, 0.2% for AGIs $75k-100k, 0.5% for AGIs $100k-200k)
Ordinary dividends: $958 (reported on 21.1% of returns)
Here:
$958
State:
$10,299
(% of AGI for various income ranges: 0.7% for AGIs below $25k, 1.1% for AGIs $25k-50k, 0.8% for AGIs $75k-100k)
Net capital gain/loss in AGI: +$100 (reported on 8.8% of returns)
Here:
+$100
State:
+$42,474
Profit/loss from business: +$11,322 (reported on 15.8% of returns)
Here:
+$11,322
State:
+$16,168
(% of AGI for various income ranges: 7.5% for AGIs below $25k, 7.8% for AGIs $25k-50k, 7.8% for AGIs $75k-100k)
Taxable individual retirement arrangement distribution: $8,675 (reported on 14.0% of returns)
12076:
$8,675
New York:
$17,621
Total itemized deductions: $16,793 (25% of AGI, reported on 26.3% of returns)
Here:
$16,793
State:
$34,985
Here:
25.0% of AGI
State:
21.3% of AGI
(% of AGI for various income ranges: 14.4% for AGIs $25k-50k, 8.4% for AGIs $50k-75k, 9.8% for AGIs $75k-100k, 11.6% for AGIs $100k-200k)
Charity contributions: $1,870 (reported on 17.5% of returns)
Here:
$1,870
State:
$5,572
(% of AGI for various income ranges: 1.3% for AGIs below $25k, 1.4% for AGIs $50k-75k, 1.1% for AGIs $100k-200k)
Taxes paid: $6,947 (reported on 26.3% of returns)
12076:
$6,947
State:
$18,656
(% of AGI for various income ranges: 4.9% for AGIs $25k-50k, 3.6% for AGIs $50k-75k, 3.9% for AGIs $75k-100k, 5.7% for AGIs $100k-200k)
Earned income credit: $1,889 (reported on 15.8% of returns)
Here:
$1,889
State:
$2,230
(% of AGI for various income ranges: 4.6% for AGIs below $25k, 0.9% for AGIs $25k-50k)
Percentage of individuals using paid preparers for their 2012 taxes: 57.9%
Here:
58%
State:
66%
(% for various income ranges: 47.6% for AGIs below $25k, 53.3% for AGIs $25k-50k, 70.0% for AGIs $50k-75k, 66.7% for AGIs $75k-100k, 80.0% for AGIs $100k-200k)
Averages for the 2004 tax year for zip code 12076, filed in 2005:
Average Adjusted Gross Income (AGI) in 2004: $35,132 (Individual Income Tax Returns)
Here:
$35,132
State:
$59,519
Salary/wage: $30,114 (reported on 77.8% of returns)
Here:
$30,114
State:
$50,673
(% of AGI for various income ranges: 99.6% for AGIs below $10k, 63.2% for AGIs $10k-25k, 75.3% for AGIs $25k-50k, 68.7% for AGIs $50k-75k, 67.3% for AGIs $75k-100k, 42.7% for AGIs over 100k)
Taxable interest for individuals: $699 (reported on 50.6% of returns)
This zip code:
$699
New York:
$2,377
(% of AGI for various income ranges: 6.7% for AGIs below $10k, 2.3% for AGIs $10k-25k, 0.5% for AGIs $25k-50k, 0.7% for AGIs $50k-75k, 1.1% for AGIs $75k-100k, 0.5% for AGIs over 100k)
Taxable dividends: $906 (reported on 23.8% of returns)
Here:
$906
State:
$5,394
(% of AGI for various income ranges: 1.2% for AGIs below $10k, 1.7% for AGIs $10k-25k, 0.7% for AGIs $25k-50k, 0.5% for AGIs $50k-75k, 0.3% for AGIs $75k-100k)
Net capital gain/loss: +$4,500 (reported on 15.0% of returns)
Here:
+$4,500
State:
+$23,581
(% of AGI for various income ranges: -4.2% for AGIs below $10k, 0.2% for AGIs $10k-25k, 0.3% for AGIs $25k-50k, 1.1% for AGIs $50k-75k, 0.1% for AGIs $75k-100k, 11.6% for AGIs over 100k)
Profit/loss from business: +$3,214 (reported on 14.4% of returns)
Here:
+$3,214
State:
+$13,809
(% of AGI for various income ranges: 14.1% for AGIs below $10k, 6.8% for AGIs $10k-25k, 0.5% for AGIs $25k-50k, 0.1% for AGIs $50k-75k)
IRA payment deduction: $3,000 (reported on 2.1% of returns)
12076:
$3,000
New York:
$3,115
Total itemized deductions: $15,092 (24% of AGI, reported on 22.2% of returns)
Here:
$15,092
State:
$25,864
Here:
24.3% of AGI
State:
21.9% of AGI
(% of AGI for various income ranges: 8.5% for AGIs $10k-25k, 10.5% for AGIs $25k-50k, 8.4% for AGIs $50k-75k, 11.1% for AGIs $75k-100k, 10.5% for AGIs over 100k)
Charity contributions deductions: $1,790 (3% of AGI, reported on 17.9% of returns)
Here:
$1,790
State:
$4,439
Here:
2.7% of AGI
State:
3.6% of AGI
(% of AGI for various income ranges: 2.2% for AGIs below $10k, 0.8% for AGIs $25k-50k, 1.2% for AGIs $50k-75k, 1.1% for AGIs $75k-100k, 0.9% for AGIs over 100k)
Total tax: $4,287 (reported on 73.3% of returns)
12076:
$4,287
State:
$11,730
(% of AGI for various income ranges: 5.4% for AGIs below $10k, 4.5% for AGIs $10k-25k, 6.4% for AGIs $25k-50k, 9.1% for AGIs $50k-75k, 11.1% for AGIs $75k-100k, 15.1% for AGIs over 100k)
Earned income credit: $1,574 (reported on 16.1% of returns)
Here:
$1,574
State:
$1,757
Percentage of individuals using paid preparers for their 2004 taxes: 64.8%
Here:
65%
State:
67%
(% for various income ranges: 50.4% for AGIs below $10k, 65.5% for AGIs $10k-25k, 67.6% for AGIs $25k-50k, 71.3% for AGIs $50k-75k, 72.7% for AGIs $75k-100k, 90.0% for AGIs over 100k)
Notable locations in zip code 12076: Five Corners (A), Nickerson Park Campground (B), Country Road Campground (C), Conesville Town Hall (D). Display/hide their locations on the map
Cemeteries: Freese Cemetery (1), Gilboa Rural Cemetery (2), West Conesville Cemetery (3), East Conesville Cemetery (4), Manorkill Rural Cemetery (5), Moore Cemetery (6), Richtmyer Case Cemetery (7). Display/hide their locations on the map
Size of family households: 194 2-persons, 96 3-persons, 44 4-persons, 35 5-persons
Size of nonfamily households: 194 1-person, 16 2-persons, 2 5-persons
143 married couples with children.
29 single-parent households (6 men, 23 women).
94.6% of residents of 12076 zip code speak English at home.
1.3% of residents speak Spanish at home (88% very well, 12% well).
3.9% of residents speak other Indo-European language at home (94% very well, 6% well).
0.3% of residents speak Asian or Pacific Island language at home (100% well).
0.2% of residents speak other language at home (100% very well).
Foreign born population: 99 (8.0%) (72.1% of them are naturalized citizens)
This zip code:
8.0%
Whole state:
22.7%
13%Denmark
8%Romania
7%France
5%Belgium
5%Poland
4%Sweden
3%Greece
22%German
17%Irish
13%Italian
8%English
7%European
4%American
3%Scandinavian
Year of entry for the foreign-born population
212010 or later
42000 to 2009
51990 to 1999
83Before 1990
Facilities with environmental interests located in this zip code:
GILBOA CONESVILLE CENTRAL SCHOOL ( in GILBOA, NY)
(National Center for Education Statistics) - STATE ID-540801040001 Organizations: GILBOA-CONESVILLE CSD (SCHOOL DISTRICT)
GOLDEN ACRES FARM & RANCH (COUNTY RTE 14 in GILBOA, NY)
National Pollutant Discharge Elimination System NON-MAJOR (Tracking pollutant discharge elimination systems) - permit Business SIC classification: SERVICES Organizations: FARM RESORTS, INC (CONTACT/OWNER)
Alternative names: GILBOA LAND & DEVELOPMENT CORP
Housing units lacking complete plumbing facilities: 4.1% Housing units lacking complete kitchen facilities: 3.0%
51.5%Fuel oil, kerosene, etc.
21.5%Wood
16.5%Electricity
8.1%Bottled, tank, or LP gas
1.1%Utility gas
0.7%No fuel used
0.5%Other fuel
Population in 1990: 1,400.
Place of birth for U.S.-born residents:
This state: 938
Northeast: 77
Midwest: 21
South: 42
West: 52
73% of the 12076 zip code residents lived in the same house 5 years ago. Out of people who lived in different houses, 36% lived in this county. Out of people who lived in different counties, 50% lived in New York.
95% of the 12076 zip code residents lived in the same house 1 year ago. Out of people who lived in different houses, 23% moved from this county. Out of people who lived in different houses, 77% moved from different county within same state.
Private vs. public school enrollment:
Students in private schools in grades 1 to 8 (elementary and middle school): 4
Here:
3.2%
New York:
15.6%
Students in private schools in grades 9 to 12 (high school): 10
Here:
16.1%
New York:
15.0%
Students in private undergraduate colleges: 2
Here:
14.0%
New York:
39.2%
Occupation by median earnings in the past 12 months ($)
220,712Material moving occupations
65,297Health technologists and technicians
54,666Construction and extraction occupations
54,140Life, physical, and social science occupations
53,713Installation, maintenance, and repair occupations
44,804Education, training, and library occupations
Top industries in this zip code by the number of employees in 2005:
Construction: Highway, Street, and Bridge Construction (5-9 employees: 1 establishment)
Construction: Water and Sewer Line and Related Structures Construction (1-4: 2)
Accommodation and Food Services: RV (Recreational Vehicle) Parks and Campgrounds (1-4: 2)
Construction: Framing Contractors (1-4: 1)
Construction: Commercial and Institutional Building Construction (1-4: 1)
Construction: Site Preparation Contractors (1-4: 1)
Fatal accident statistics in 2012:
Fatal accident count: 1
Vehicles involved in fatal accidents: 2
Fatal accidents caused by drunken drivers: 1
Fatalities: 2
Persons involved in fatal accidents: 3
Pedestrians involved in fatal accidents: 0
Home Mortgage Disclosure Act Aggregated Statistics For Year 2009 (Based on 2 partial tracts)
A) FHA, FSA/RHS & VA Home Purchase Loans
B) Conventional Home Purchase Loans
C) Refinancings
D) Home Improvement Loans
F) Non-occupant Loans on < 5 Family Dwellings (A B C & D)
G) Loans On Manufactured Home Dwelling (A B C & D)
Number
Average Value
Number
Average Value
Number
Average Value
Number
Average Value
Number
Average Value
Number
Average Value
LOANS ORIGINATED
3
$101,790
12
$126,383
28
$123,291
6
$73,548
15
$124,506
3
$59,583
APPLICATIONS APPROVED, NOT ACCEPTED
0
$0
1
$111,720
5
$115,816
0
$0
2
$84,720
1
$111,720
APPLICATIONS DENIED
0
$0
6
$78,825
19
$143,913
5
$9,868
4
$171,070
6
$70,757
APPLICATIONS WITHDRAWN
1
$67,030
0
$0
11
$155,985
2
$49,345
2
$109,860
0
$0
FILES CLOSED FOR INCOMPLETENESS
0
$0
0
$0
1
$132,200
0
$0
0
$0
1
$132,200
Aggregated Statistics For Year 2008 (Based on 2 partial tracts)
A) FHA, FSA/RHS & VA Home Purchase Loans
B) Conventional Home Purchase Loans
C) Refinancings
D) Home Improvement Loans
F) Non-occupant Loans on < 5 Family Dwellings (A B C & D)
G) Loans On Manufactured Home Dwelling (A B C & D)
Number
Average Value
Number
Average Value
Number
Average Value
Number
Average Value
Number
Average Value
Number
Average Value
LOANS ORIGINATED
4
$134,762
17
$124,261
34
$137,021
9
$45,412
18
$180,252
7
$73,549
APPLICATIONS APPROVED, NOT ACCEPTED
0
$0
3
$131,890
7
$172,369
4
$31,188
4
$145,235
3
$112,650
APPLICATIONS DENIED
1
$224,370
10
$86,583
38
$149,768
9
$38,688
7
$132,734
9
$59,894
APPLICATIONS WITHDRAWN
1
$146,170
1
$167,580
13
$144,162
1
$23,270
1
$244,850
0
$0
FILES CLOSED FOR INCOMPLETENESS
0
$0
1
$167,580
4
$190,158
0
$0
2
$132,665
0
$0
Aggregated Statistics For Year 2007 (Based on 2 partial tracts)
A) FHA, FSA/RHS & VA Home Purchase Loans
B) Conventional Home Purchase Loans
C) Refinancings
D) Home Improvement Loans
F) Non-occupant Loans on < 5 Family Dwellings (A B C & D)
G) Loans On Manufactured Home Dwelling (A B C & D)
Number
Average Value
Number
Average Value
Number
Average Value
Number
Average Value
Number
Average Value
Number
Average Value
LOANS ORIGINATED
3
$107,377
34
$118,757
52
$128,585
9
$42,102
18
$145,288
7
$78,470
APPLICATIONS APPROVED, NOT ACCEPTED
0
$0
9
$76,342
13
$119,812
3
$27,930
5
$97,754
3
$42,827
APPLICATIONS DENIED
2
$27,930
20
$109,439
57
$150,430
24
$84,799
11
$156,662
14
$73,084
APPLICATIONS WITHDRAWN
1
$88,440
4
$171,305
25
$124,866
2
$42,360
4
$58,885
4
$67,962
FILES CLOSED FOR INCOMPLETENESS
0
$0
1
$46,550
7
$168,511
1
$69,820
0
$0
0
$0
Aggregated Statistics For Year 2006 (Based on 2 partial tracts)
A) FHA, FSA/RHS & VA Home Purchase Loans
B) Conventional Home Purchase Loans
C) Refinancings
D) Home Improvement Loans
E) Loans on Dwellings For 5+ Families
F) Non-occupant Loans on < 5 Family Dwellings (A B C & D)
G) Loans On Manufactured Home Dwelling (A B C & D)
Number
Average Value
Number
Average Value
Number
Average Value
Number
Average Value
Number
Average Value
Number
Average Value
Number
Average Value
LOANS ORIGINATED
2
$119,635
34
$118,730
63
$99,691
17
$68,127
0
$0
17
$134,666
11
$61,615
APPLICATIONS APPROVED, NOT ACCEPTED
1
$49,340
5
$105,576
11
$140,750
2
$6,985
0
$0
2
$88,910
2
$42,360
APPLICATIONS DENIED
1
$34,450
11
$106,895
59
$112,840
10
$66,101
1
$9,310
7
$113,050
9
$66,514
APPLICATIONS WITHDRAWN
1
$40,030
2
$191,785
20
$147,656
0
$0
0
$0
1
$138,720
1
$138,720
FILES CLOSED FOR INCOMPLETENESS
0
$0
2
$65,635
15
$145,298
1
$41,890
0
$0
3
$54,930
1
$59,580
Aggregated Statistics For Year 2005 (Based on 2 partial tracts)
A) FHA, FSA/RHS & VA Home Purchase Loans
B) Conventional Home Purchase Loans
C) Refinancings
D) Home Improvement Loans
F) Non-occupant Loans on < 5 Family Dwellings (A B C & D)
G) Loans On Manufactured Home Dwelling (A B C & D)
Number
Average Value
Number
Average Value
Number
Average Value
Number
Average Value
Number
Average Value
Number
Average Value
LOANS ORIGINATED
6
$105,668
46
$157,420
56
$94,530
12
$64,782
33
$140,045
13
$83,933
APPLICATIONS APPROVED, NOT ACCEPTED
0
$0
13
$152,898
21
$89,730
1
$23,270
9
$165,718
4
$69,360
APPLICATIONS DENIED
2
$104,270
14
$122,493
58
$82,056
8
$38,985
7
$113,449
14
$63,973
APPLICATIONS WITHDRAWN
1
$66,100
7
$139,119
36
$102,126
6
$109,082
7
$116,109
7
$75,544
FILES CLOSED FOR INCOMPLETENESS
0
$0
2
$101,015
14
$104,206
2
$22,345
0
$0
0
$0
Aggregated Statistics For Year 2004 (Based on 2 partial tracts)
A) FHA, FSA/RHS & VA Home Purchase Loans
B) Conventional Home Purchase Loans
C) Refinancings
D) Home Improvement Loans
F) Non-occupant Loans on < 5 Family Dwellings (A B C & D)
G) Loans On Manufactured Home Dwelling (A B C & D)
Number
Average Value
Number
Average Value
Number
Average Value
Number
Average Value
Number
Average Value
Number
Average Value
LOANS ORIGINATED
4
$74,712
39
$105,251
58
$91,431
11
$43,587
22
$132,117
12
$54,308
APPLICATIONS APPROVED, NOT ACCEPTED
0
$0
3
$53,377
8
$72,501
3
$24,827
0
$0
3
$44,687
APPLICATIONS DENIED
1
$49,340
12
$65,015
38
$79,257
16
$39,044
4
$78,670
2
$78,670
APPLICATIONS WITHDRAWN
2
$84,255
3
$131,270
33
$78,345
6
$87,358
6
$59,895
2
$40,965
FILES CLOSED FOR INCOMPLETENESS
0
$0
1
$325,850
7
$89,774
0
$0
1
$55,860
0
$0
Aggregated Statistics For Year 2003 (Based on 2 partial tracts)
A) FHA, FSA/RHS & VA Home Purchase Loans
B) Conventional Home Purchase Loans
C) Refinancings
D) Home Improvement Loans
F) Non-occupant Loans on < 5 Family Dwellings (A B C & D)
Number
Average Value
Number
Average Value
Number
Average Value
Number
Average Value
Number
Average Value
LOANS ORIGINATED
5
$55,302
34
$74,425
81
$81,123
1
$6,520
30
$77,552
APPLICATIONS APPROVED, NOT ACCEPTED
0
$0
14
$58,653
12
$67,420
1
$46,550
6
$75,100
APPLICATIONS DENIED
0
$0
8
$52,718
46
$99,799
9
$18,310
8
$92,169
APPLICATIONS WITHDRAWN
1
$46,550
9
$80,480
30
$91,300
2
$30,725
3
$65,170
FILES CLOSED FOR INCOMPLETENESS
0
$0
2
$67,500
2
$91,705
0
$0
1
$111,720
Aggregated Statistics For Year 2002 (Based on 2 partial tracts)
A) FHA, FSA/RHS & VA Home Purchase Loans
B) Conventional Home Purchase Loans
C) Refinancings
D) Home Improvement Loans
F) Non-occupant Loans on < 5 Family Dwellings (A B C & D)
Number
Average Value
Number
Average Value
Number
Average Value
Number
Average Value
Number
Average Value
LOANS ORIGINATED
6
$73,860
26
$66,208
45
$79,880
5
$30,164
16
$59,409
APPLICATIONS APPROVED, NOT ACCEPTED
1
$75,410
11
$53,321
11
$66,439
3
$24,827
2
$52,135
APPLICATIONS DENIED
0
$0
10
$50,460
28
$74,247
7
$23,141
6
$88,755
APPLICATIONS WITHDRAWN
0
$0
2
$78,205
13
$62,735
5
$26,068
0
$0
FILES CLOSED FOR INCOMPLETENESS
0
$0
4
$48,412
8
$64,355
0
$0
1
$70,760
Aggregated Statistics For Year 2001 (Based on 2 partial tracts)
A) FHA, FSA/RHS & VA Home Purchase Loans
B) Conventional Home Purchase Loans
C) Refinancings
D) Home Improvement Loans
E) Loans on Dwellings For 5+ Families
F) Non-occupant Loans on < 5 Family Dwellings (A B C & D)
Number
Average Value
Number
Average Value
Number
Average Value
Number
Average Value
Number
Average Value
Number
Average Value
LOANS ORIGINATED
6
$78,670
22
$59,034
40
$63,610
6
$22,343
1
$93,100
15
$55,177
APPLICATIONS APPROVED, NOT ACCEPTED
0
$0
5
$43,384
6
$75,877
4
$32,818
0
$0
2
$118,700
APPLICATIONS DENIED
0
$0
15
$43,881
36
$60,463
7
$22,610
0
$0
6
$45,153
APPLICATIONS WITHDRAWN
0
$0
1
$99,620
21
$59,274
2
$60,980
0
$0
0
$0
FILES CLOSED FOR INCOMPLETENESS
0
$0
0
$0
6
$76,652
0
$0
0
$0
0
$0
Aggregated Statistics For Year 2000 (Based on 2 partial tracts)
A) FHA, FSA/RHS & VA Home Purchase Loans
B) Conventional Home Purchase Loans
C) Refinancings
D) Home Improvement Loans
F) Non-occupant Loans on < 5 Family Dwellings (A B C & D)
Number
Average Value
Number
Average Value
Number
Average Value
Number
Average Value
Number
Average Value
LOANS ORIGINATED
7
$66,899
20
$79,414
13
$58,510
7
$12,501
8
$56,092
APPLICATIONS APPROVED, NOT ACCEPTED
0
$0
4
$44,222
6
$68,273
0
$0
2
$52,135
APPLICATIONS DENIED
0
$0
20
$49,576
27
$42,999
8
$11,055
2
$31,190
APPLICATIONS WITHDRAWN
1
$65,170
3
$64,240
26
$47,230
3
$17,067
0
$0
FILES CLOSED FOR INCOMPLETENESS
0
$0
1
$71,690
5
$62,936
0
$0
0
$0
Aggregated Statistics For Year 1999 (Based on 1 partial tract)
A) FHA, FSA/RHS & VA Home Purchase Loans
B) Conventional Home Purchase Loans
C) Refinancings
D) Home Improvement Loans
F) Non-occupant Loans on < 5 Family Dwellings (A B C & D)
Detailed PMIC statistics for the following Tracts:9908.00
2002 - 2018 National Fire Incident Reporting System (NFIRS) incidents
According to the data from the years 2002 - 2018 the average number of fires per year is 7. The highest number of reported fires - 23 took place in 2005, and the least - 0 in 2012. The data has a decreasing trend.
When looking into fire subcategories, the most reports belonged to: Structure Fires (49.6%), and Outside Fires (25.6%).
Fire incident types reported to NFIRS in Zip Code 12076

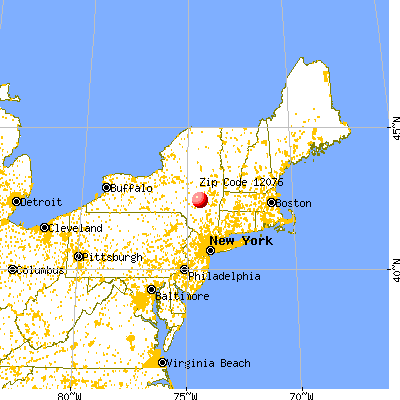


 Nearest zip codes: 12131, 12407, 12468, 12434, 12194, 12071.


 According to the data from the years 2002 - 2018 the average number of fires per year is 7. The highest number of reported fires - 23 took place in 2005, and the least - 0 in 2012. The data has a decreasing trend.
 When looking into fire subcategories, the most reports belonged to: Structure Fires (49.6%), and Outside Fires (25.6%).