Races in Vails Gate, New York (NY) Detailed Stats
Data:
Races - White alone (%)
Races - White alone (% change since 2000)
Races - Black alone (%)
Races - Black alone (% change since 2000)
Races - American Indian alone (%)
Races - American Indian alone (% change since 2000)
Races - Asian alone (%)
Races - Asian alone (% change since 2000)
Races - Hispanic (%)
Races - Hispanic (% change since 2000)
Races - Native Hawaiian and Other Pacific Islander alone (%)
Races - Native Hawaiian and Other Pacific Islander alone (% change since 2000)
Races - Two or more races(%)
Races - Two or more races(% change since 2000)
Races - Other race alone (%)
Races - Other race alone (% change since 2000)
Racial diversity
Place of birth - Born in state of residence (%)
Place of birth - Born in state of residence (%) - White
Place of birth - Born in state of residence (%) - Black or African American
Place of birth - Born in state of residence (%) - Asian
Place of birth - Born in state of residence (%) - Hispanic or Latino
Place of birth - Born in state of residence (%) - American Indian and Alaska Native
Place of birth - Born in state of residence (%) - Multirace
Place of birth - Born in state of residence (%) - Other Race
Place of birth - Born in other state (%)
Place of birth - Born in other state (%) - White
Place of birth - Born in other state (%) - Black or African American
Place of birth - Born in other state (%) - Asian
Place of birth - Born in other state (%) - Hispanic or Latino
Place of birth - Born in other state (%) - American Indian and Alaska Native
Place of birth - Born in other state (%) - Multirace
Place of birth - Born in other state (%) - Other Race
Place of birth - Native, outside of US (%)
Place of birth - Native, outside of US (%) - White
Place of birth - Native, outside of US (%) - Black or African American
Place of birth - Native, outside of US (%) - Asian
Place of birth - Native, outside of US (%) - Hispanic or Latino
Place of birth - Native, outside of US (%) - American Indian and Alaska Native
Place of birth - Native, outside of US (%) - Multirace
Place of birth - Native, outside of US (%) - Other Race
Place of birth - Foreign born (%)
Place of birth - Foreign born (%) - White
Place of birth - Foreign born (%) - Black or African American
Place of birth - Foreign born (%) - Asian
Place of birth - Foreign born (%) - Hispanic or Latino
Place of birth - Foreign born (%) - American Indian and Alaska Native
Place of birth - Foreign born (%) - Multirace
Place of birth - Foreign born (%) - Other Race
Residents speaking English at home (%)
Residents speaking English at home - Born in the United States (%)
Residents speaking English at home - Native, born elsewhere (%)
Residents speaking English at home - Foreign born (%)
Residents speaking Spanish at home (%)
Residents speaking Spanish at home - Born in the United States (%)
Residents speaking Spanish at home - Native, born elsewhere (%)
Residents speaking Spanish at home - Foreign born (%)
Residents speaking other language at home (%)
Residents speaking other language at home - Born in the United States (%)
Residents speaking other language at home - Native, born elsewhere (%)
Residents speaking other language at home - Foreign born (%)
Marital status - Never married (%)
Marital status - Now married (%)
Marital status - Separated (%)
Marital status - Widowed (%)
Marital status - Divorced (%)
Ancestries Reported - Arab (%)
Ancestries Reported - Czech (%)
Ancestries Reported - Danish (%)
Ancestries Reported - Dutch (%)
Ancestries Reported - English (%)
Ancestries Reported - French (%)
Ancestries Reported - French Canadian (%)
Ancestries Reported - German (%)
Ancestries Reported - Greek (%)
Ancestries Reported - Hungarian (%)
Ancestries Reported - Irish (%)
Ancestries Reported - Italian (%)
Ancestries Reported - Lithuanian (%)
Ancestries Reported - Norwegian (%)
Ancestries Reported - Polish (%)
Ancestries Reported - Portuguese (%)
Ancestries Reported - Russian (%)
Ancestries Reported - Scotch-Irish (%)
Ancestries Reported - Scottish (%)
Ancestries Reported - Slovak (%)
Ancestries Reported - Subsaharan African (%)
Ancestries Reported - Swedish (%)
Ancestries Reported - Swiss (%)
Ancestries Reported - Ukrainian (%)
Ancestries Reported - United States (%)
Ancestries Reported - Welsh (%)
Ancestries Reported - West Indian (%)
Ancestries Reported - Other (%)
Geographical mobility - Same house 1 year ago (%)
Geographical mobility - Same house 1 year ago (%) - White
Geographical mobility - Same house 1 year ago (%) - Black or African American
Geographical mobility - Same house 1 year ago (%) - Asian
Geographical mobility - Same house 1 year ago (%) - Hispanic or Latino
Geographical mobility - Same house 1 year ago (%) - American Indian and Alaska Native
Geographical mobility - Same house 1 year ago (%) - Multirace
Geographical mobility - Same house 1 year ago (%) - Other Race
Geographical mobility - Moved within same county (%)
Geographical mobility - Moved within same county (%) - White
Geographical mobility - Moved within same county (%) - Black or African American
Geographical mobility - Moved within same county (%) - Asian
Geographical mobility - Moved within same county (%) - Hispanic or Latino
Geographical mobility - Moved within same county (%) - American Indian and Alaska Native
Geographical mobility - Moved within same county (%) - Multirace
Geographical mobility - Moved within same county (%) - Other Race
Geographical mobility - Moved from different county within same state (%)
Geographical mobility - Moved from different county within same state (%) - White
Geographical mobility - Moved from different county within same state (%) - Black or African American
Geographical mobility - Moved from different county within same state (%) - Asian
Geographical mobility - Moved from different county within same state (%) - Hispanic or Latino
Geographical mobility - Moved from different county within same state (%) - American Indian and Alaska Native
Geographical mobility - Moved from different county within same state (%) - Multirace
Geographical mobility - Moved from different county within same state (%) - Other Race
Geographical mobility - Moved from different state (%)
Geographical mobility - Moved from different state (%) - White
Geographical mobility - Moved from different state (%) - Black or African American
Geographical mobility - Moved from different state (%) - Asian
Geographical mobility - Moved from different state (%) - Hispanic or Latino
Geographical mobility - Moved from different state (%) - American Indian and Alaska Native
Geographical mobility - Moved from different state (%) - Multirace
Geographical mobility - Moved from different state (%) - Other Race
Geographical mobility - Moved from abroad (%)
Geographical mobility - Moved from abroad (%) - White
Geographical mobility - Moved from abroad (%) - Black or African American
Geographical mobility - Moved from abroad (%) - Asian
Geographical mobility - Moved from abroad (%) - Hispanic or Latino
Geographical mobility - Moved from abroad (%) - American Indian and Alaska Native
Geographical mobility - Moved from abroad (%) - Multirace
Geographical mobility - Moved from abroad (%) - Other Race
Place of birth for the foreign-born population - Ireland (%)
Place of birth for the foreign-born population - Denmark (%)
Place of birth for the foreign-born population - Norway (%)
Place of birth for the foreign-born population - Sweden (%)
Place of birth for the foreign-born population - United Kingdom (%)
Place of birth for the foreign-born population - England (%)
Place of birth for the foreign-born population - Scotland (%)
Place of birth for the foreign-born population - Other Northern Europe (%)
Place of birth for the foreign-born population - Austria (%)
Place of birth for the foreign-born population - Belgium (%)
Place of birth for the foreign-born population - France (%)
Place of birth for the foreign-born population - Germany (%)
Place of birth for the foreign-born population - Netherlands (%)
Place of birth for the foreign-born population - Switzerland (%)
Place of birth for the foreign-born population - Other Western Europe (%)
Place of birth for the foreign-born population - Greece (%)
Place of birth for the foreign-born population - Italy (%)
Place of birth for the foreign-born population - Portugal (%)
Place of birth for the foreign-born population - Spain (%)
Place of birth for the foreign-born population - Other Southern Europe (%)
Place of birth for the foreign-born population - Albania (%)
Place of birth for the foreign-born population - Belarus (%)
Place of birth for the foreign-born population - Bosnia and Herzegovina (%)
Place of birth for the foreign-born population - Bulgaria (%)
Place of birth for the foreign-born population - Croatia (%)
Place of birth for the foreign-born population - Czechoslovakia (%)
Place of birth for the foreign-born population - Hungary (%)
Place of birth for the foreign-born population - Latvia (%)
Place of birth for the foreign-born population - Lithuania (%)
Place of birth for the foreign-born population - North Macedonia (Macedonia) (%)
Place of birth for the foreign-born population - Moldova (%)
Place of birth for the foreign-born population - Poland (%)
Place of birth for the foreign-born population - Romania (%)
Place of birth for the foreign-born population - Russia (%)
Place of birth for the foreign-born population - Serbia (%)
Place of birth for the foreign-born population - Ukraine (%)
Place of birth for the foreign-born population - Other Eastern Europe (%)
Place of birth for the foreign-born population - China (%)
Place of birth for the foreign-born population - Hong Kong (%)
Place of birth for the foreign-born population - Taiwan (%)
Place of birth for the foreign-born population - Japan (%)
Place of birth for the foreign-born population - Korea (%)
Place of birth for the foreign-born population - Other Eastern Asia (%)
Place of birth for the foreign-born population - Afghanistan (%)
Place of birth for the foreign-born population - Bangladesh (%)
Place of birth for the foreign-born population - India (%)
Place of birth for the foreign-born population - Iran (%)
Place of birth for the foreign-born population - Kazakhstan (%)
Place of birth for the foreign-born population - Nepal (%)
Place of birth for the foreign-born population - Pakistan (%)
Place of birth for the foreign-born population - Sri Lanka (%)
Place of birth for the foreign-born population - Uzbekistan (%)
Place of birth for the foreign-born population - Other South Central Asia (%)
Place of birth for the foreign-born population - Burma (%)
Place of birth for the foreign-born population - Cambodia (%)
Place of birth for the foreign-born population - Indonesia (%)
Place of birth for the foreign-born population - Laos (%)
Place of birth for the foreign-born population - Malaysia (%)
Place of birth for the foreign-born population - Philippines (%)
Place of birth for the foreign-born population - Singapore (%)
Place of birth for the foreign-born population - Thailand (%)
Place of birth for the foreign-born population - Vietnam (%)
Place of birth for the foreign-born population - Other South Eastern Asia (%)
Place of birth for the foreign-born population - Armenia (%)
Place of birth for the foreign-born population - Iraq (%)
Place of birth for the foreign-born population - Israel (%)
Place of birth for the foreign-born population - Jordan (%)
Place of birth for the foreign-born population - Kuwait (%)
Place of birth for the foreign-born population - Lebanon (%)
Place of birth for the foreign-born population - Saudi Arabia (%)
Place of birth for the foreign-born population - Syria (%)
Place of birth for the foreign-born population - Turkey (%)
Place of birth for the foreign-born population - Yemen (%)
Place of birth for the foreign-born population - Other Western Asia (%)
Place of birth for the foreign-born population - Eritrea (%)
Place of birth for the foreign-born population - Ethiopia (%)
Place of birth for the foreign-born population - Kenya (%)
Place of birth for the foreign-born population - Somalia (%)
Place of birth for the foreign-born population - Uganda (%)
Place of birth for the foreign-born population - Zimbabwe (%)
Place of birth for the foreign-born population - Other Eastern Africa (%)
Place of birth for the foreign-born population - Cameroon (%)
Place of birth for the foreign-born population - Congo (%)
Place of birth for the foreign-born population - Democratic Republic of Congo (Zaire) (%)
Place of birth for the foreign-born population - Other Middle Africa (%)
Place of birth for the foreign-born population - Egypt (%)
Place of birth for the foreign-born population - Morocco (%)
Place of birth for the foreign-born population - Sudan (%)
Place of birth for the foreign-born population - Other Northern Africa (%)
Place of birth for the foreign-born population - South Africa (%)
Place of birth for the foreign-born population - Other Southern Africa (%)
Place of birth for the foreign-born population - Cabo Verde (%)
Place of birth for the foreign-born population - Ghana (%)
Place of birth for the foreign-born population - Liberia (%)
Place of birth for the foreign-born population - Nigeria (%)
Place of birth for the foreign-born population - Senegal (%)
Place of birth for the foreign-born population - Sierra Leone (%)
Place of birth for the foreign-born population - Other Western Africa (%)
Place of birth for the foreign-born population - Australia (%)
Place of birth for the foreign-born population - New Zealand (%)
Place of birth for the foreign-born population - Fiji (%)
Place of birth for the foreign-born population - Micronesia (%)
Place of birth for the foreign-born population - Bahamas (%)
Place of birth for the foreign-born population - Barbados (%)
Place of birth for the foreign-born population - Cuba (%)
Place of birth for the foreign-born population - Dominica (%)
Place of birth for the foreign-born population - Dominican Republic (%)
Place of birth for the foreign-born population - Grenada (%)
Place of birth for the foreign-born population - Haiti (%)
Place of birth for the foreign-born population - Jamaica (%)
Place of birth for the foreign-born population - St. Vincent and the Grenadines (%)
Place of birth for the foreign-born population - Trinidad and Tobago (%)
Place of birth for the foreign-born population - West Indies (%)
Place of birth for the foreign-born population - Other Caribbean (%)
Place of birth for the foreign-born population - Belize (%)
Place of birth for the foreign-born population - Costa Rica (%)
Place of birth for the foreign-born population - El Salvador (%)
Place of birth for the foreign-born population - Guatemala (%)
Place of birth for the foreign-born population - Honduras (%)
Place of birth for the foreign-born population - Mexico (%)
Place of birth for the foreign-born population - Nicaragua (%)
Place of birth for the foreign-born population - Panama (%)
Place of birth for the foreign-born population - Other Central America (%)
Place of birth for the foreign-born population - Argentina (%)
Place of birth for the foreign-born population - Bolivia (%)
Place of birth for the foreign-born population - Brazil (%)
Place of birth for the foreign-born population - Chile (%)
Place of birth for the foreign-born population - Colombia (%)
Place of birth for the foreign-born population - Ecuador (%)
Place of birth for the foreign-born population - Guyana (%)
Place of birth for the foreign-born population - Peru (%)
Place of birth for the foreign-born population - Uruguay (%)
Place of birth for the foreign-born population - Venezuela (%)
Place of birth for the foreign-born population - Other South America (%)
Place of birth for the foreign-born population - Canada (%)
Place of birth for the foreign-born population - Other Northern America (%)
Place of birth for the foreign-born population - Other (%)
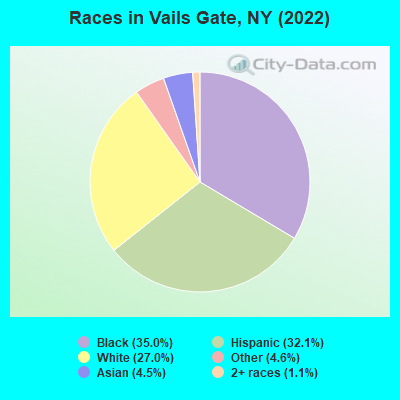
According to 2022 data, the most numerous races in Vails Gate, NY are White alone (788 residents), Hispanic (934 residents), and Black alone (1,021 residents). 63.7% of Vails Gate residents speak English at home. 33.1% of Vails Gate, NY residents are foreign-born (28.0% born in Latin America, 3.5% born in Asia), which is 33.5% greater than the foreign-born rate of 22.0% across the entire state of New York.
Race distribution in Vails Gate
2000 2022
11,760,981 62.0% White alone 2,867,583 15.1% Hispanic 2,812,623 14.8% Black alone 1,035,926 5.5% Asian alone 366,116 1.9% Two or more races 75,499 0.4% Other race alone 52,499 0.3% American Indian alone 5,230 0.03% Native Hawaiian and Other
10,408,933 52.9% White alone 3,867,299 19.7% Hispanic 2,633,840 13.4% Black alone 1,776,286 9.0% Asian alone 732,670 3.7% Two or more races 216,110 1.1% Other race alone 35,082 0.2% American Indian alone 6,931 0.04% Native Hawaiian and Other
Income and house value in Vails Gate Median household income in 2022 $79,166 White non-Hispanic householders$41,691 Some other race householders$102,528 Two or more races householdersMedian 2022 house value $314,565 White Non-Hispanic householders$297,574 Black or African American householders$272,088 Hispanic or Latino householders
Median age by race in Vails Gate
46.5 Median age for White residents46.9 46.9 28.6 Median age for Black or African American residents20.4 37.1 6.0 Median age for American Indian / Alaska Native residents-677,083,332.7 -603,603,603.0 39.5 Median age for Asian residents43.3 42.7 -487,992,314.6 Median age for Native Hawaiian / Pacific Islander residents-477,502,295.2 -497,387,669.3 26.1 Median age for Other race residents25.4 35.3 48.2 Median age for Two or more races residents61.4 32.2 57.9 Median age for White alone residents55.0 58.3 44.2 Median age for Hispanic or Latino residents45.8 35.9
Owner/renter occupied households by race in Vails Gate
House owners and renters - White residents 466 70.8% Owner occupied193 29.2% Renter occupiedHouse owners and renters - Black or African American residents 143 45.7% Owner occupied170 54.3% Renter occupiedHouse owners and renters - American Indian / Alaska Native residents 17 100.0% Renter occupiedHouse owners and renters - Asian residents 46 66.3% Owner occupied23 33.7% Renter occupiedHouse owners and renters - Other race residents 26 17.5% Owner occupied124 82.5% Renter occupiedHouse owners and renters - Two or more races residents 7 4.3% Owner occupied166 95.7% Renter occupiedHouse owners and renters - White alone residents 354 67.7% Owner occupied169 32.3% Renter occupiedHouse owners and renters - Hispanic or Latino residents 173 47.6% Owner occupied190 52.4% Renter occupied
Language usage in Vails Gate
English speakers - Total 63.7% of residents of Vails Gate speak English at home.
25.1% of residents speak Spanish at home 587 83.7% Speak English very well114 16.3% Speak English less than very well10.8% of residents speak other language at home 154 50.8% Speak English very well149 49.2% Speak English less than very well
English speakers - Born in the United States 69.4% of residents of Vails Gate speak English at home.
18.6% of residents speak Spanish at home 62 100.0% Speak English very well11.4% of residents speak other language at home 38 100.0% Speak English very well
English speakers - Native, born elsewhere 47.0% of residents of Vails Gate speak English at home.
47.0% of residents speak Spanish at home 16 29.6% Speak English very well38 70.4% Speak English less than very well
English speakers - Foreign-born 37.0% of residents of Vails Gate speak English at home.
37.8% of residents speak Spanish at home 318 79.9% Speak English very well80 20.1% Speak English less than very well20.1% of residents speak other language at home 90 42.7% Speak English very well121 57.3% Speak English less than very well
White (Caucasian) - Speak another language Native:
13.9% (126)Foreign-born:
84.6% (174)
Black or African American - Speak only English Native:
90.4% (474)Foreign-born:
57.1% (261)
Black or African American - Speak another language Native:
9.3% (49)Foreign-born:
29.3% (134)
American Indian / Alaska Native - Speak another language Native:
100.0% (32)Foreign-born:
100.0% (20)
Asian - Speak another language Native:
62.6% (11)Foreign-born:
90.3% (104)
Other race - Speak only English Native:
72.5% (139)Foreign-born:
100.0% (47)
Two or more races - Speak only English Native:
33.3% (63)Foreign-born:
12.8% (31)
Two or more races - Speak another language Native:
74.4% (140)Foreign-born:
81.7% (199)
White alone - Speak another language Native:
1.0% (8)Foreign-born:
91.5% (20)
Hispanic or Latino - Speak only English Native:
32.1% (139)Foreign-born:
15.0% (75)
Hispanic or Latino - Speak another language Native:
68.4% (297)Foreign-born:
83.1% (418)
Foreign-born residents in Vails Gate 964 residents are foreign born (28.0% Latin America , 3.5% Asia ).
This city:
33.1%New York:
22.6%
Marital status for residents in Vails Gate Marital status - White (Caucasian) population 15 years and over
Males 29.3% Never married38.0% Now married11.8% Separated6.9% Widowed14.0% DivorcedFemales 28.3% Never married34.4% Now married0.0% Separated18.2% Widowed19.2% DivorcedWomen who did not give birth in the past 12 months Now married:
37.6% (112)Unmarried:
62.4% (186)
Marital status - Black or African American population 15 years and over
Males 58.3% Never married34.5% Now married0.0% Separated0.0% Widowed7.1% DivorcedFemales 55.3% Never married30.3% Now married11.8% Separated0.0% Widowed2.6% DivorcedWomen who gave birth in the past 12 months Now married:
100.0% (56)Unmarried:
0.0% (0)
Women who did not give birth in the past 12 months Now married:
15.2% (26)Unmarried:
84.8% (148)
Marital status - American Indian / Alaska Native population 15 years and over
Males 0.0% Never married100.0% Now married0.0% Separated0.0% Widowed0.0% DivorcedFemales 0.0% Never married100.0% Now married0.0% Separated0.0% Widowed0.0% DivorcedWomen who did not give birth in the past 12 months Now married:
100.0% (20)Unmarried:
0.0% (0)
Marital status - Asian population 15 years and over
Males 31.6% Never married29.8% Now married19.3% Separated0.0% Widowed19.3% DivorcedFemales 48.1% Never married25.9% Now married0.0% Separated11.1% Widowed14.8% DivorcedWomen who did not give birth in the past 12 months Now married:
25.7% (10)Unmarried:
74.3% (29)
Marital status - Other race population 15 years and over
Males 89.7% Never married10.3% Now married0.0% Separated0.0% Widowed0.0% DivorcedFemales 57.0% Never married10.5% Now married0.0% Separated8.1% Widowed24.4% DivorcedWomen who did not give birth in the past 12 months Now married:
0.0% (0)Unmarried:
100.0% (78)
Marital status - Two or more races population 15 years and over
Males 53.9% Never married46.1% Now married0.0% Separated0.0% Widowed0.0% DivorcedFemales 27.1% Never married72.9% Now married0.0% Separated0.0% Widowed0.0% DivorcedWomen who did not give birth in the past 12 months Now married:
51.5% (47)Unmarried:
48.5% (44)
Marital status - White alone, not Hispanic / Latino population 15 years and over
Males 28.5% Never married30.0% Now married9.2% Separated10.6% Widowed21.7% DivorcedFemales 19.0% Never married26.7% Now married0.0% Separated27.3% Widowed27.0% DivorcedWomen who did not give birth in the past 12 months Now married:
24.1% (32)Unmarried:
75.9% (100)
Marital status - Hispanic or Latino population 15 years and over
Males 37.8% Never married50.9% Now married11.3% Separated0.0% Widowed0.0% DivorcedFemales 41.6% Never married47.6% Now married0.0% Separated2.9% Widowed7.9% DivorcedWomen who did not give birth in the past 12 months Now married:
42.1% (150)Unmarried:
57.9% (207)
Ancestries in Vails Gate
519 28.4% Jamaican239 13.1% Italian134 7.3% American46 2.5% Haitian31 1.7% Irish28 1.5% Polish19 1.0% Dutch14 0.8% Egyptian13 0.7% Moroccan10 0.5% Ukrainian5 0.3% Hungarian2 0.1% European
Children Nativity (place of birth) in Vails Gate
Children under 6 years - Living with two parents Both parents native 22 100.0% NativeBoth parents foreign-born 77 100.0% NativeOne native, one foreign-born parent 36 100.0% NativeChildren under 6 years - Living with one parent Native parent 23 100.0% NativeForeign-born parent 13 58.7% Native9 41.3% Foreign-bornChildren 6 to 17 years - Living with two parents Both parents foreign-born 206 88.0% Native28 12.0% Foreign-bornOne native, one foreign-born parent 11 100.0% NativeChildren 6 to 17 years - Living with one parent Native parent 122 100.0% NativeForeign-born parent 86 51.7% Native80 48.3% Foreign-born
Grandparents responsible for own grandchildren in Vails Gate
Grandparents (30 to 59 years) Black or African American 6 10.9% Responsible for grandchildren48 89.1% Not responsible for grandchildren
Grandparents (60 years and over)