Races in Somers Point, New Jersey (NJ) Detailed Stats
Data:
Races - White alone (%)
Races - White alone (% change since 2000)
Races - Black alone (%)
Races - Black alone (% change since 2000)
Races - American Indian alone (%)
Races - American Indian alone (% change since 2000)
Races - Asian alone (%)
Races - Asian alone (% change since 2000)
Races - Hispanic (%)
Races - Hispanic (% change since 2000)
Races - Native Hawaiian and Other Pacific Islander alone (%)
Races - Native Hawaiian and Other Pacific Islander alone (% change since 2000)
Races - Two or more races(%)
Races - Two or more races(% change since 2000)
Races - Other race alone (%)
Races - Other race alone (% change since 2000)
Racial diversity
Place of birth - Born in state of residence (%)
Place of birth - Born in state of residence (%) - White
Place of birth - Born in state of residence (%) - Black or African American
Place of birth - Born in state of residence (%) - Asian
Place of birth - Born in state of residence (%) - Hispanic or Latino
Place of birth - Born in state of residence (%) - American Indian and Alaska Native
Place of birth - Born in state of residence (%) - Multirace
Place of birth - Born in state of residence (%) - Other Race
Place of birth - Born in other state (%)
Place of birth - Born in other state (%) - White
Place of birth - Born in other state (%) - Black or African American
Place of birth - Born in other state (%) - Asian
Place of birth - Born in other state (%) - Hispanic or Latino
Place of birth - Born in other state (%) - American Indian and Alaska Native
Place of birth - Born in other state (%) - Multirace
Place of birth - Born in other state (%) - Other Race
Place of birth - Native, outside of US (%)
Place of birth - Native, outside of US (%) - White
Place of birth - Native, outside of US (%) - Black or African American
Place of birth - Native, outside of US (%) - Asian
Place of birth - Native, outside of US (%) - Hispanic or Latino
Place of birth - Native, outside of US (%) - American Indian and Alaska Native
Place of birth - Native, outside of US (%) - Multirace
Place of birth - Native, outside of US (%) - Other Race
Place of birth - Foreign born (%)
Place of birth - Foreign born (%) - White
Place of birth - Foreign born (%) - Black or African American
Place of birth - Foreign born (%) - Asian
Place of birth - Foreign born (%) - Hispanic or Latino
Place of birth - Foreign born (%) - American Indian and Alaska Native
Place of birth - Foreign born (%) - Multirace
Place of birth - Foreign born (%) - Other Race
Residents speaking English at home (%)
Residents speaking English at home - Born in the United States (%)
Residents speaking English at home - Native, born elsewhere (%)
Residents speaking English at home - Foreign born (%)
Residents speaking Spanish at home (%)
Residents speaking Spanish at home - Born in the United States (%)
Residents speaking Spanish at home - Native, born elsewhere (%)
Residents speaking Spanish at home - Foreign born (%)
Residents speaking other language at home (%)
Residents speaking other language at home - Born in the United States (%)
Residents speaking other language at home - Native, born elsewhere (%)
Residents speaking other language at home - Foreign born (%)
Marital status - Never married (%)
Marital status - Now married (%)
Marital status - Separated (%)
Marital status - Widowed (%)
Marital status - Divorced (%)
Ancestries Reported - Arab (%)
Ancestries Reported - Czech (%)
Ancestries Reported - Danish (%)
Ancestries Reported - Dutch (%)
Ancestries Reported - English (%)
Ancestries Reported - French (%)
Ancestries Reported - French Canadian (%)
Ancestries Reported - German (%)
Ancestries Reported - Greek (%)
Ancestries Reported - Hungarian (%)
Ancestries Reported - Irish (%)
Ancestries Reported - Italian (%)
Ancestries Reported - Lithuanian (%)
Ancestries Reported - Norwegian (%)
Ancestries Reported - Polish (%)
Ancestries Reported - Portuguese (%)
Ancestries Reported - Russian (%)
Ancestries Reported - Scotch-Irish (%)
Ancestries Reported - Scottish (%)
Ancestries Reported - Slovak (%)
Ancestries Reported - Subsaharan African (%)
Ancestries Reported - Swedish (%)
Ancestries Reported - Swiss (%)
Ancestries Reported - Ukrainian (%)
Ancestries Reported - United States (%)
Ancestries Reported - Welsh (%)
Ancestries Reported - West Indian (%)
Ancestries Reported - Other (%)
Geographical mobility - Same house 1 year ago (%)
Geographical mobility - Same house 1 year ago (%) - White
Geographical mobility - Same house 1 year ago (%) - Black or African American
Geographical mobility - Same house 1 year ago (%) - Asian
Geographical mobility - Same house 1 year ago (%) - Hispanic or Latino
Geographical mobility - Same house 1 year ago (%) - American Indian and Alaska Native
Geographical mobility - Same house 1 year ago (%) - Multirace
Geographical mobility - Same house 1 year ago (%) - Other Race
Geographical mobility - Moved within same county (%)
Geographical mobility - Moved within same county (%) - White
Geographical mobility - Moved within same county (%) - Black or African American
Geographical mobility - Moved within same county (%) - Asian
Geographical mobility - Moved within same county (%) - Hispanic or Latino
Geographical mobility - Moved within same county (%) - American Indian and Alaska Native
Geographical mobility - Moved within same county (%) - Multirace
Geographical mobility - Moved within same county (%) - Other Race
Geographical mobility - Moved from different county within same state (%)
Geographical mobility - Moved from different county within same state (%) - White
Geographical mobility - Moved from different county within same state (%) - Black or African American
Geographical mobility - Moved from different county within same state (%) - Asian
Geographical mobility - Moved from different county within same state (%) - Hispanic or Latino
Geographical mobility - Moved from different county within same state (%) - American Indian and Alaska Native
Geographical mobility - Moved from different county within same state (%) - Multirace
Geographical mobility - Moved from different county within same state (%) - Other Race
Geographical mobility - Moved from different state (%)
Geographical mobility - Moved from different state (%) - White
Geographical mobility - Moved from different state (%) - Black or African American
Geographical mobility - Moved from different state (%) - Asian
Geographical mobility - Moved from different state (%) - Hispanic or Latino
Geographical mobility - Moved from different state (%) - American Indian and Alaska Native
Geographical mobility - Moved from different state (%) - Multirace
Geographical mobility - Moved from different state (%) - Other Race
Geographical mobility - Moved from abroad (%)
Geographical mobility - Moved from abroad (%) - White
Geographical mobility - Moved from abroad (%) - Black or African American
Geographical mobility - Moved from abroad (%) - Asian
Geographical mobility - Moved from abroad (%) - Hispanic or Latino
Geographical mobility - Moved from abroad (%) - American Indian and Alaska Native
Geographical mobility - Moved from abroad (%) - Multirace
Geographical mobility - Moved from abroad (%) - Other Race
Place of birth for the foreign-born population - Ireland (%)
Place of birth for the foreign-born population - Denmark (%)
Place of birth for the foreign-born population - Norway (%)
Place of birth for the foreign-born population - Sweden (%)
Place of birth for the foreign-born population - United Kingdom (%)
Place of birth for the foreign-born population - England (%)
Place of birth for the foreign-born population - Scotland (%)
Place of birth for the foreign-born population - Other Northern Europe (%)
Place of birth for the foreign-born population - Austria (%)
Place of birth for the foreign-born population - Belgium (%)
Place of birth for the foreign-born population - France (%)
Place of birth for the foreign-born population - Germany (%)
Place of birth for the foreign-born population - Netherlands (%)
Place of birth for the foreign-born population - Switzerland (%)
Place of birth for the foreign-born population - Other Western Europe (%)
Place of birth for the foreign-born population - Greece (%)
Place of birth for the foreign-born population - Italy (%)
Place of birth for the foreign-born population - Portugal (%)
Place of birth for the foreign-born population - Spain (%)
Place of birth for the foreign-born population - Other Southern Europe (%)
Place of birth for the foreign-born population - Albania (%)
Place of birth for the foreign-born population - Belarus (%)
Place of birth for the foreign-born population - Bosnia and Herzegovina (%)
Place of birth for the foreign-born population - Bulgaria (%)
Place of birth for the foreign-born population - Croatia (%)
Place of birth for the foreign-born population - Czechoslovakia (%)
Place of birth for the foreign-born population - Hungary (%)
Place of birth for the foreign-born population - Latvia (%)
Place of birth for the foreign-born population - Lithuania (%)
Place of birth for the foreign-born population - North Macedonia (Macedonia) (%)
Place of birth for the foreign-born population - Moldova (%)
Place of birth for the foreign-born population - Poland (%)
Place of birth for the foreign-born population - Romania (%)
Place of birth for the foreign-born population - Russia (%)
Place of birth for the foreign-born population - Serbia (%)
Place of birth for the foreign-born population - Ukraine (%)
Place of birth for the foreign-born population - Other Eastern Europe (%)
Place of birth for the foreign-born population - China (%)
Place of birth for the foreign-born population - Hong Kong (%)
Place of birth for the foreign-born population - Taiwan (%)
Place of birth for the foreign-born population - Japan (%)
Place of birth for the foreign-born population - Korea (%)
Place of birth for the foreign-born population - Other Eastern Asia (%)
Place of birth for the foreign-born population - Afghanistan (%)
Place of birth for the foreign-born population - Bangladesh (%)
Place of birth for the foreign-born population - India (%)
Place of birth for the foreign-born population - Iran (%)
Place of birth for the foreign-born population - Kazakhstan (%)
Place of birth for the foreign-born population - Nepal (%)
Place of birth for the foreign-born population - Pakistan (%)
Place of birth for the foreign-born population - Sri Lanka (%)
Place of birth for the foreign-born population - Uzbekistan (%)
Place of birth for the foreign-born population - Other South Central Asia (%)
Place of birth for the foreign-born population - Burma (%)
Place of birth for the foreign-born population - Cambodia (%)
Place of birth for the foreign-born population - Indonesia (%)
Place of birth for the foreign-born population - Laos (%)
Place of birth for the foreign-born population - Malaysia (%)
Place of birth for the foreign-born population - Philippines (%)
Place of birth for the foreign-born population - Singapore (%)
Place of birth for the foreign-born population - Thailand (%)
Place of birth for the foreign-born population - Vietnam (%)
Place of birth for the foreign-born population - Other South Eastern Asia (%)
Place of birth for the foreign-born population - Armenia (%)
Place of birth for the foreign-born population - Iraq (%)
Place of birth for the foreign-born population - Israel (%)
Place of birth for the foreign-born population - Jordan (%)
Place of birth for the foreign-born population - Kuwait (%)
Place of birth for the foreign-born population - Lebanon (%)
Place of birth for the foreign-born population - Saudi Arabia (%)
Place of birth for the foreign-born population - Syria (%)
Place of birth for the foreign-born population - Turkey (%)
Place of birth for the foreign-born population - Yemen (%)
Place of birth for the foreign-born population - Other Western Asia (%)
Place of birth for the foreign-born population - Eritrea (%)
Place of birth for the foreign-born population - Ethiopia (%)
Place of birth for the foreign-born population - Kenya (%)
Place of birth for the foreign-born population - Somalia (%)
Place of birth for the foreign-born population - Uganda (%)
Place of birth for the foreign-born population - Zimbabwe (%)
Place of birth for the foreign-born population - Other Eastern Africa (%)
Place of birth for the foreign-born population - Cameroon (%)
Place of birth for the foreign-born population - Congo (%)
Place of birth for the foreign-born population - Democratic Republic of Congo (Zaire) (%)
Place of birth for the foreign-born population - Other Middle Africa (%)
Place of birth for the foreign-born population - Egypt (%)
Place of birth for the foreign-born population - Morocco (%)
Place of birth for the foreign-born population - Sudan (%)
Place of birth for the foreign-born population - Other Northern Africa (%)
Place of birth for the foreign-born population - South Africa (%)
Place of birth for the foreign-born population - Other Southern Africa (%)
Place of birth for the foreign-born population - Cabo Verde (%)
Place of birth for the foreign-born population - Ghana (%)
Place of birth for the foreign-born population - Liberia (%)
Place of birth for the foreign-born population - Nigeria (%)
Place of birth for the foreign-born population - Senegal (%)
Place of birth for the foreign-born population - Sierra Leone (%)
Place of birth for the foreign-born population - Other Western Africa (%)
Place of birth for the foreign-born population - Australia (%)
Place of birth for the foreign-born population - New Zealand (%)
Place of birth for the foreign-born population - Fiji (%)
Place of birth for the foreign-born population - Micronesia (%)
Place of birth for the foreign-born population - Bahamas (%)
Place of birth for the foreign-born population - Barbados (%)
Place of birth for the foreign-born population - Cuba (%)
Place of birth for the foreign-born population - Dominica (%)
Place of birth for the foreign-born population - Dominican Republic (%)
Place of birth for the foreign-born population - Grenada (%)
Place of birth for the foreign-born population - Haiti (%)
Place of birth for the foreign-born population - Jamaica (%)
Place of birth for the foreign-born population - St. Vincent and the Grenadines (%)
Place of birth for the foreign-born population - Trinidad and Tobago (%)
Place of birth for the foreign-born population - West Indies (%)
Place of birth for the foreign-born population - Other Caribbean (%)
Place of birth for the foreign-born population - Belize (%)
Place of birth for the foreign-born population - Costa Rica (%)
Place of birth for the foreign-born population - El Salvador (%)
Place of birth for the foreign-born population - Guatemala (%)
Place of birth for the foreign-born population - Honduras (%)
Place of birth for the foreign-born population - Mexico (%)
Place of birth for the foreign-born population - Nicaragua (%)
Place of birth for the foreign-born population - Panama (%)
Place of birth for the foreign-born population - Other Central America (%)
Place of birth for the foreign-born population - Argentina (%)
Place of birth for the foreign-born population - Bolivia (%)
Place of birth for the foreign-born population - Brazil (%)
Place of birth for the foreign-born population - Chile (%)
Place of birth for the foreign-born population - Colombia (%)
Place of birth for the foreign-born population - Ecuador (%)
Place of birth for the foreign-born population - Guyana (%)
Place of birth for the foreign-born population - Peru (%)
Place of birth for the foreign-born population - Uruguay (%)
Place of birth for the foreign-born population - Venezuela (%)
Place of birth for the foreign-born population - Other South America (%)
Place of birth for the foreign-born population - Canada (%)
Place of birth for the foreign-born population - Other Northern America (%)
Place of birth for the foreign-born population - Other (%)
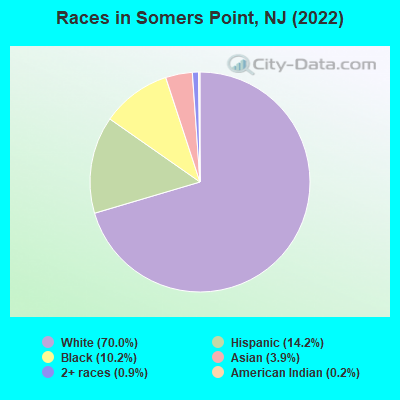
According to 2022 data, the most numerous races in Somers Point, NJ are White alone (7,373 residents), Hispanic (1,493 residents), and Black alone (1,075 residents). 85.8% of Somers Point residents speak English at home. 12.6% of Somers Point, NJ residents are foreign-born (6.5% born in Latin America, 3.5% born in Asia, 1.5% born in Europe), which is 83.1% less than the foreign-born rate of 23.0% across the entire state of New Jersey.
Race distribution in Somers Point
2000 2022
5,557,209 66.0% White alone 1,117,191 13.3% Hispanic 1,096,171 13.0% Black alone 477,012 5.7% Asian alone 133,689 1.6% Two or more races 19,565 0.2% Other race alone 11,338 0.1% American Indian alone 2,175 0.03% Native Hawaiian and Other
4,766,476 51.5% White alone 2,028,470 21.9% Hispanic 1,111,632 12.0% Black alone 923,546 10.0% Asian alone 332,237 3.6% Two or more races 89,847 1.0% Other race alone 8,557 0.09% American Indian alone 934 0.01% Native Hawaiian and Other
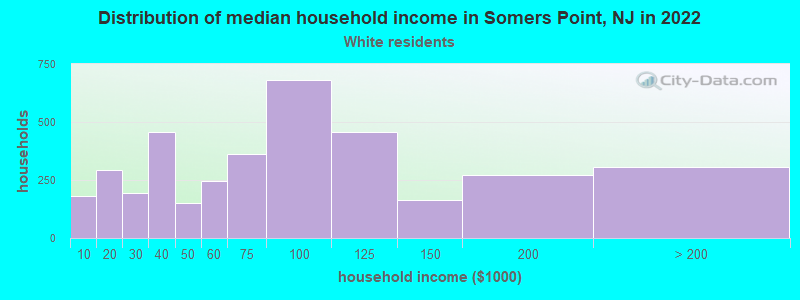
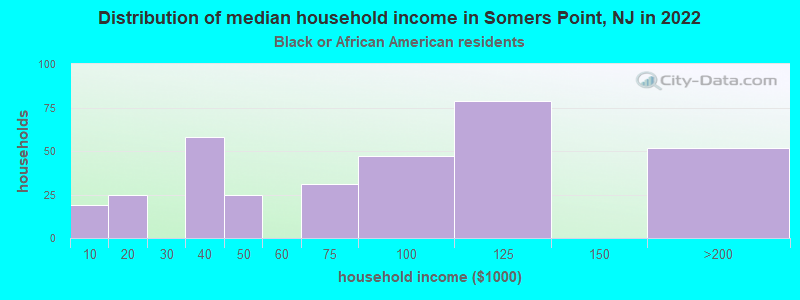
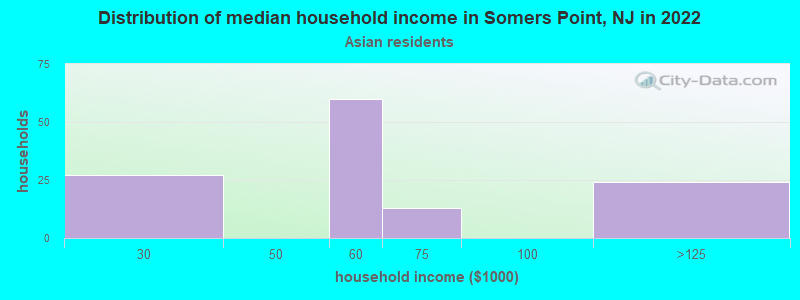
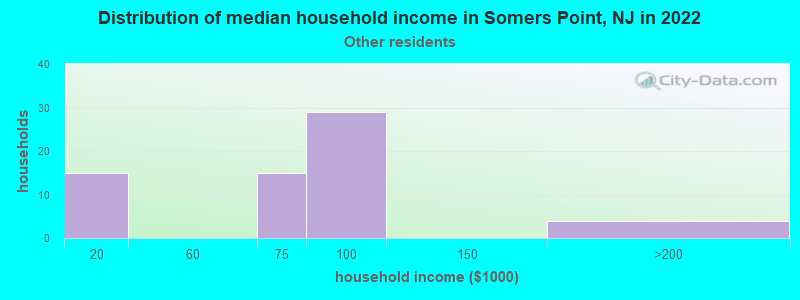
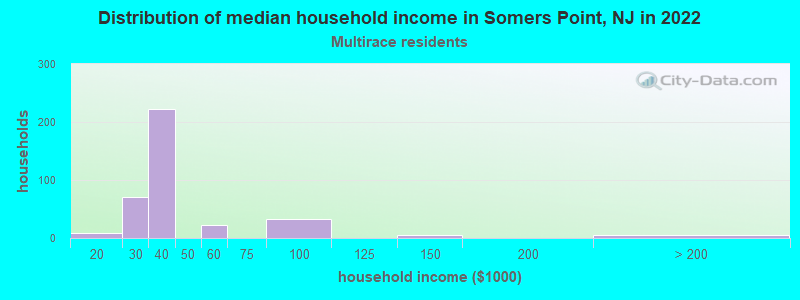
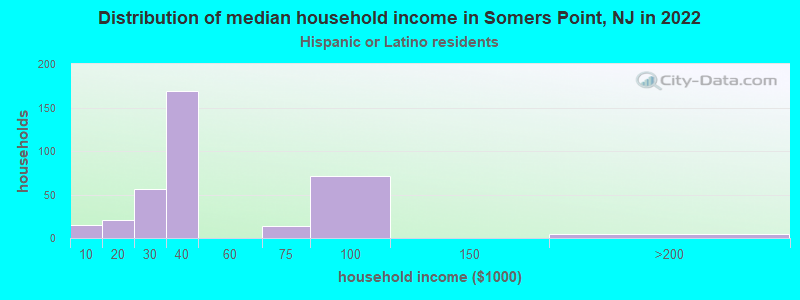
Income and house value in Somers Point Median household income in 2022 $74,468 White non-Hispanic householders$52,279 Asian householders$80,819 Some other race householders$45,771 Two or more races householders$39,600 Hispanic or Latino race householdersMedian 2022 house value $289,234 White Non-Hispanic householders$236,883 Black or African American householders$177,662 American Indian or Alaska Native householders $160,843 Asian householders$325,714 Some other race householders$234,988 Two or more races householders$319,792 Hispanic or Latino householders
Median age by race in Somers Point
49.6 Median age for White residents48.7 50.3 30.6 Median age for Black or African American residents27.0 40.8 58.8 Median age for American Indian / Alaska Native residents-590,299,277.0 -877,192,981.6 44.4 Median age for Asian residents36.0 57.3 -804,177,544.9 Median age for Native Hawaiian / Pacific Islander residents-860,335,194.7 -713,070,378.3 33.0 Median age for Other race residents25.4 58.4 20.5 Median age for Two or more races residents4.9 35.6 50.2 Median age for White alone residents51.9 49.1 17.2 Median age for Hispanic or Latino residents13.6 30.5
Owner/renter occupied households by race in Somers Point
House owners and renters - White residents 2,302 64.5% Owner occupied1,266 35.5% Renter occupiedHouse owners and renters - Black or African American residents 75 19.7% Owner occupied304 80.3% Renter occupiedHouse owners and renters - American Indian / Alaska Native residents 7 100.0% Owner occupiedHouse owners and renters - Asian residents 63 62.3% Owner occupied38 37.7% Renter occupiedHouse owners and renters - Other race residents 6 11.0% Owner occupied51 89.0% Renter occupiedHouse owners and renters - Two or more races residents 26 8.8% Owner occupied270 91.2% Renter occupiedHouse owners and renters - White alone residents 2,348 65.1% Owner occupied1,261 34.9% Renter occupiedHouse owners and renters - Hispanic or Latino residents 5 1.4% Owner occupied362 98.6% Renter occupied
Language usage in Somers Point
English speakers - Total 85.8% of residents of Somers Point speak English at home.
7.5% of residents speak Spanish at home 471 64.1% Speak English very well264 35.9% Speak English less than very well7.0% of residents speak other language at home 427 62.2% Speak English very well260 37.8% Speak English less than very well
English speakers - Born in the United States 99.9% of residents of Somers Point speak English at home.
0.3% of residents speak Spanish at home 10 100.0% Speak English very well1.2% of residents speak other language at home 36 100.0% Speak English very well
English speakers - Native, born elsewhere 62.5% of residents of Somers Point speak English at home.
33.3% of residents speak Spanish at home 8 50.0% Speak English very well8 50.0% Speak English less than very well
English speakers - Foreign-born 23.5% of residents of Somers Point speak English at home.
31.1% of residents speak Spanish at home 212 56.7% Speak English very well162 43.3% Speak English less than very well40.4% of residents speak other language at home 276 56.9% Speak English very well209 43.1% Speak English less than very well
White (Caucasian) - Speak only English Native:
100.0% (6,975)Foreign-born:
38.1% (86)
White (Caucasian) - Speak another language Native:
1.6% (115)Foreign-born:
64.6% (145)
Black or African American - Speak only English Native:
96.8% (712)Foreign-born:
65.1% (134)
Black or African American - Speak another language Native:
3.1% (23)Foreign-born:
32.0% (66)
American Indian / Alaska Native - Speak another language Native:
81.9% (13)Foreign-born:
97.6% (7)
Asian - Speak another language Native:
95.5% (105)Foreign-born:
99.4% (318)
Other race - Speak only English Native:
39.7% (61)Foreign-born:
16.2% (15)
Other race - Speak another language Native:
62.7% (96)Foreign-born:
86.7% (78)
Two or more races - Speak another language Native:
35.0% (73)Foreign-born:
94.7% (265)
White alone - Speak only English Native:
98.5% (6,860)Foreign-born:
39.5% (90)
White alone - Speak another language Native:
1.5% (107)Foreign-born:
53.1% (121)
Hispanic or Latino - Speak only English Native:
55.2% (285)Foreign-born:
3.2% (14)
Hispanic or Latino - Speak another language Native:
48.5% (251)Foreign-born:
96.2% (427)
Foreign-born residents in Somers Point 1,323 residents are foreign born (6.5% Latin America , 3.5% Asia , 1.5% Europe ).
This city:
12.6%New Jersey:
23.2%
Marital status for residents in Somers Point Marital status - White (Caucasian) population 15 years and over
Males 32.5% Never married51.3% Now married0.7% Separated4.1% Widowed11.4% DivorcedFemales 27.9% Never married43.9% Now married1.7% Separated12.1% Widowed14.4% DivorcedWomen who gave birth in the past 12 months Now married:
84.1% (95)Unmarried:
15.9% (18)
Women who did not give birth in the past 12 months Now married:
36.6% (524)Unmarried:
63.4% (908)
Marital status - Black or African American population 15 years and over
Males 65.9% Never married33.8% Now married0.3% Separated0.0% Widowed0.0% DivorcedFemales 64.7% Never married19.4% Now married0.0% Separated3.9% Widowed12.0% DivorcedWomen who gave birth in the past 12 months Now married:
75.5% (33)Unmarried:
24.5% (11)
Women who did not give birth in the past 12 months Now married:
0.0% (0)Unmarried:
100.0% (256)
Marital status - American Indian / Alaska Native population 15 years and over
Males 100.0% Never married0.0% Now married0.0% Separated0.0% Widowed0.0% DivorcedFemales 0.0% Never married44.4% Now married0.0% Separated55.6% Widowed0.0% DivorcedMarital status - Asian population 15 years and over
Males 22.6% Never married77.4% Now married0.0% Separated0.0% Widowed0.0% DivorcedFemales 6.9% Never married81.9% Now married0.0% Separated11.1% Widowed0.0% DivorcedWomen who did not give birth in the past 12 months Now married:
100.0% (48)Unmarried:
0.0% (0)
Marital status - Other race population 15 years and over
Males 63.7% Never married25.3% Now married0.0% Separated0.0% Widowed11.0% DivorcedFemales 26.9% Never married59.1% Now married0.0% Separated14.0% Widowed0.0% DivorcedWomen who did not give birth in the past 12 months Now married:
37.5% (18)Unmarried:
62.5% (31)
Marital status - Two or more races population 15 years and over
Males 38.9% Never married45.2% Now married0.0% Separated6.3% Widowed9.5% DivorcedFemales 11.0% Never married45.1% Now married39.3% Separated0.0% Widowed4.6% DivorcedWomen who did not give birth in the past 12 months Now married:
82.7% (119)Unmarried:
17.3% (25)
Marital status - White alone, not Hispanic / Latino population 15 years and over
Males 32.6% Never married51.9% Now married0.8% Separated4.2% Widowed10.5% DivorcedFemales 26.4% Never married44.6% Now married1.7% Separated12.5% Widowed14.8% DivorcedWomen who gave birth in the past 12 months Now married:
100.0% (93)Unmarried:
0.0% (0)
Women who did not give birth in the past 12 months Now married:
37.2% (555)Unmarried:
62.8% (937)
Marital status - Hispanic or Latino population 15 years and over
Males 43.3% Never married40.0% Now married0.0% Separated3.8% Widowed13.0% DivorcedFemales 36.2% Never married39.7% Now married18.4% Separated3.5% Widowed2.2% DivorcedWomen who gave birth in the past 12 months Now married:
33.3% (10)Unmarried:
66.7% (21)
Women who did not give birth in the past 12 months Now married:
54.4% (121)Unmarried:
45.6% (102)
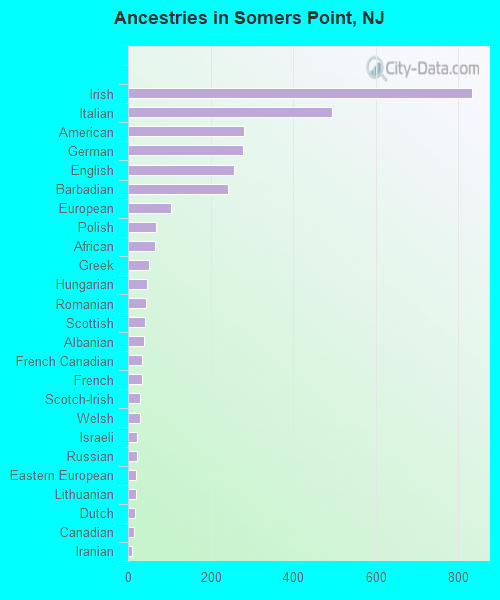
Ancestries in Somers Point
833 16.0% Irish495 9.5% Italian282 5.4% American279 5.4% German257 4.9% English242 4.7% Barbadian104 2.0% European68 1.3% Polish65 1.2% African50 1.0% Greek46 0.9% Hungarian44 0.8% Romanian41 0.8% Scottish39 0.7% Albanian34 0.7% French Canadian33 0.6% French29 0.6% Scotch-Irish28 0.5% Welsh23 0.4% Israeli23 0.4% Russian20 0.4% Eastern European19 0.4% Lithuanian17 0.3% Dutch14 0.3% Canadian10 0.2% Iranian9 0.2% Moroccan6 0.1% Australian6 0.1% Latvian
Children Nativity (place of birth) in Somers Point
Children under 6 years - Living with two parents Both parents native 479 100.0% NativeBoth parents foreign-born 141 100.0% NativeOne native, one foreign-born parent 49 100.0% NativeChildren under 6 years - Living with one parent Native parent 91 100.0% NativeForeign-born parent 54 100.0% NativeChildren 6 to 17 years - Living with two parents Both parents native 699 100.0% NativeBoth parents foreign-born 67 76.5% Native21 23.5% Foreign-bornOne native, one foreign-born parent 36 100.0% NativeChildren 6 to 17 years - Living with one parent Native parent 240 100.0% NativeForeign-born parent 221 46.0% Native260 54.0% Foreign-born
Grandparents responsible for own grandchildren in Somers Point
Grandparents (30 to 59 years) White / Caucasian 25 77.1% Responsible for grandchildren8 22.9% Not responsible for grandchildrenWhite alone, not Hispanic / Latino 30 75.3% Responsible for grandchildren10 24.7% Not responsible for grandchildrenGrandparents (60 years and over) White / Caucasian 55 46.4% Responsible for grandchildren63 53.6% Not responsible for grandchildrenWhite alone, not Hispanic / Latino 62 47.0% Responsible for grandchildren70 53.0% Not responsible for grandchildren