Races in Solvay, New York (NY) Detailed Stats
Data:
Races - White alone (%)
Races - White alone (% change since 2000)
Races - Black alone (%)
Races - Black alone (% change since 2000)
Races - American Indian alone (%)
Races - American Indian alone (% change since 2000)
Races - Asian alone (%)
Races - Asian alone (% change since 2000)
Races - Hispanic (%)
Races - Hispanic (% change since 2000)
Races - Native Hawaiian and Other Pacific Islander alone (%)
Races - Native Hawaiian and Other Pacific Islander alone (% change since 2000)
Races - Two or more races(%)
Races - Two or more races(% change since 2000)
Races - Other race alone (%)
Races - Other race alone (% change since 2000)
Racial diversity
Place of birth - Born in state of residence (%)
Place of birth - Born in state of residence (%) - White
Place of birth - Born in state of residence (%) - Black or African American
Place of birth - Born in state of residence (%) - Asian
Place of birth - Born in state of residence (%) - Hispanic or Latino
Place of birth - Born in state of residence (%) - American Indian and Alaska Native
Place of birth - Born in state of residence (%) - Multirace
Place of birth - Born in state of residence (%) - Other Race
Place of birth - Born in other state (%)
Place of birth - Born in other state (%) - White
Place of birth - Born in other state (%) - Black or African American
Place of birth - Born in other state (%) - Asian
Place of birth - Born in other state (%) - Hispanic or Latino
Place of birth - Born in other state (%) - American Indian and Alaska Native
Place of birth - Born in other state (%) - Multirace
Place of birth - Born in other state (%) - Other Race
Place of birth - Native, outside of US (%)
Place of birth - Native, outside of US (%) - White
Place of birth - Native, outside of US (%) - Black or African American
Place of birth - Native, outside of US (%) - Asian
Place of birth - Native, outside of US (%) - Hispanic or Latino
Place of birth - Native, outside of US (%) - American Indian and Alaska Native
Place of birth - Native, outside of US (%) - Multirace
Place of birth - Native, outside of US (%) - Other Race
Place of birth - Foreign born (%)
Place of birth - Foreign born (%) - White
Place of birth - Foreign born (%) - Black or African American
Place of birth - Foreign born (%) - Asian
Place of birth - Foreign born (%) - Hispanic or Latino
Place of birth - Foreign born (%) - American Indian and Alaska Native
Place of birth - Foreign born (%) - Multirace
Place of birth - Foreign born (%) - Other Race
Residents speaking English at home (%)
Residents speaking English at home - Born in the United States (%)
Residents speaking English at home - Native, born elsewhere (%)
Residents speaking English at home - Foreign born (%)
Residents speaking Spanish at home (%)
Residents speaking Spanish at home - Born in the United States (%)
Residents speaking Spanish at home - Native, born elsewhere (%)
Residents speaking Spanish at home - Foreign born (%)
Residents speaking other language at home (%)
Residents speaking other language at home - Born in the United States (%)
Residents speaking other language at home - Native, born elsewhere (%)
Residents speaking other language at home - Foreign born (%)
Marital status - Never married (%)
Marital status - Now married (%)
Marital status - Separated (%)
Marital status - Widowed (%)
Marital status - Divorced (%)
Ancestries Reported - Arab (%)
Ancestries Reported - Czech (%)
Ancestries Reported - Danish (%)
Ancestries Reported - Dutch (%)
Ancestries Reported - English (%)
Ancestries Reported - French (%)
Ancestries Reported - French Canadian (%)
Ancestries Reported - German (%)
Ancestries Reported - Greek (%)
Ancestries Reported - Hungarian (%)
Ancestries Reported - Irish (%)
Ancestries Reported - Italian (%)
Ancestries Reported - Lithuanian (%)
Ancestries Reported - Norwegian (%)
Ancestries Reported - Polish (%)
Ancestries Reported - Portuguese (%)
Ancestries Reported - Russian (%)
Ancestries Reported - Scotch-Irish (%)
Ancestries Reported - Scottish (%)
Ancestries Reported - Slovak (%)
Ancestries Reported - Subsaharan African (%)
Ancestries Reported - Swedish (%)
Ancestries Reported - Swiss (%)
Ancestries Reported - Ukrainian (%)
Ancestries Reported - United States (%)
Ancestries Reported - Welsh (%)
Ancestries Reported - West Indian (%)
Ancestries Reported - Other (%)
Geographical mobility - Same house 1 year ago (%)
Geographical mobility - Same house 1 year ago (%) - White
Geographical mobility - Same house 1 year ago (%) - Black or African American
Geographical mobility - Same house 1 year ago (%) - Asian
Geographical mobility - Same house 1 year ago (%) - Hispanic or Latino
Geographical mobility - Same house 1 year ago (%) - American Indian and Alaska Native
Geographical mobility - Same house 1 year ago (%) - Multirace
Geographical mobility - Same house 1 year ago (%) - Other Race
Geographical mobility - Moved within same county (%)
Geographical mobility - Moved within same county (%) - White
Geographical mobility - Moved within same county (%) - Black or African American
Geographical mobility - Moved within same county (%) - Asian
Geographical mobility - Moved within same county (%) - Hispanic or Latino
Geographical mobility - Moved within same county (%) - American Indian and Alaska Native
Geographical mobility - Moved within same county (%) - Multirace
Geographical mobility - Moved within same county (%) - Other Race
Geographical mobility - Moved from different county within same state (%)
Geographical mobility - Moved from different county within same state (%) - White
Geographical mobility - Moved from different county within same state (%) - Black or African American
Geographical mobility - Moved from different county within same state (%) - Asian
Geographical mobility - Moved from different county within same state (%) - Hispanic or Latino
Geographical mobility - Moved from different county within same state (%) - American Indian and Alaska Native
Geographical mobility - Moved from different county within same state (%) - Multirace
Geographical mobility - Moved from different county within same state (%) - Other Race
Geographical mobility - Moved from different state (%)
Geographical mobility - Moved from different state (%) - White
Geographical mobility - Moved from different state (%) - Black or African American
Geographical mobility - Moved from different state (%) - Asian
Geographical mobility - Moved from different state (%) - Hispanic or Latino
Geographical mobility - Moved from different state (%) - American Indian and Alaska Native
Geographical mobility - Moved from different state (%) - Multirace
Geographical mobility - Moved from different state (%) - Other Race
Geographical mobility - Moved from abroad (%)
Geographical mobility - Moved from abroad (%) - White
Geographical mobility - Moved from abroad (%) - Black or African American
Geographical mobility - Moved from abroad (%) - Asian
Geographical mobility - Moved from abroad (%) - Hispanic or Latino
Geographical mobility - Moved from abroad (%) - American Indian and Alaska Native
Geographical mobility - Moved from abroad (%) - Multirace
Geographical mobility - Moved from abroad (%) - Other Race
Place of birth for the foreign-born population - Ireland (%)
Place of birth for the foreign-born population - Denmark (%)
Place of birth for the foreign-born population - Norway (%)
Place of birth for the foreign-born population - Sweden (%)
Place of birth for the foreign-born population - United Kingdom (%)
Place of birth for the foreign-born population - England (%)
Place of birth for the foreign-born population - Scotland (%)
Place of birth for the foreign-born population - Other Northern Europe (%)
Place of birth for the foreign-born population - Austria (%)
Place of birth for the foreign-born population - Belgium (%)
Place of birth for the foreign-born population - France (%)
Place of birth for the foreign-born population - Germany (%)
Place of birth for the foreign-born population - Netherlands (%)
Place of birth for the foreign-born population - Switzerland (%)
Place of birth for the foreign-born population - Other Western Europe (%)
Place of birth for the foreign-born population - Greece (%)
Place of birth for the foreign-born population - Italy (%)
Place of birth for the foreign-born population - Portugal (%)
Place of birth for the foreign-born population - Spain (%)
Place of birth for the foreign-born population - Other Southern Europe (%)
Place of birth for the foreign-born population - Albania (%)
Place of birth for the foreign-born population - Belarus (%)
Place of birth for the foreign-born population - Bosnia and Herzegovina (%)
Place of birth for the foreign-born population - Bulgaria (%)
Place of birth for the foreign-born population - Croatia (%)
Place of birth for the foreign-born population - Czechoslovakia (%)
Place of birth for the foreign-born population - Hungary (%)
Place of birth for the foreign-born population - Latvia (%)
Place of birth for the foreign-born population - Lithuania (%)
Place of birth for the foreign-born population - North Macedonia (Macedonia) (%)
Place of birth for the foreign-born population - Moldova (%)
Place of birth for the foreign-born population - Poland (%)
Place of birth for the foreign-born population - Romania (%)
Place of birth for the foreign-born population - Russia (%)
Place of birth for the foreign-born population - Serbia (%)
Place of birth for the foreign-born population - Ukraine (%)
Place of birth for the foreign-born population - Other Eastern Europe (%)
Place of birth for the foreign-born population - China (%)
Place of birth for the foreign-born population - Hong Kong (%)
Place of birth for the foreign-born population - Taiwan (%)
Place of birth for the foreign-born population - Japan (%)
Place of birth for the foreign-born population - Korea (%)
Place of birth for the foreign-born population - Other Eastern Asia (%)
Place of birth for the foreign-born population - Afghanistan (%)
Place of birth for the foreign-born population - Bangladesh (%)
Place of birth for the foreign-born population - India (%)
Place of birth for the foreign-born population - Iran (%)
Place of birth for the foreign-born population - Kazakhstan (%)
Place of birth for the foreign-born population - Nepal (%)
Place of birth for the foreign-born population - Pakistan (%)
Place of birth for the foreign-born population - Sri Lanka (%)
Place of birth for the foreign-born population - Uzbekistan (%)
Place of birth for the foreign-born population - Other South Central Asia (%)
Place of birth for the foreign-born population - Burma (%)
Place of birth for the foreign-born population - Cambodia (%)
Place of birth for the foreign-born population - Indonesia (%)
Place of birth for the foreign-born population - Laos (%)
Place of birth for the foreign-born population - Malaysia (%)
Place of birth for the foreign-born population - Philippines (%)
Place of birth for the foreign-born population - Singapore (%)
Place of birth for the foreign-born population - Thailand (%)
Place of birth for the foreign-born population - Vietnam (%)
Place of birth for the foreign-born population - Other South Eastern Asia (%)
Place of birth for the foreign-born population - Armenia (%)
Place of birth for the foreign-born population - Iraq (%)
Place of birth for the foreign-born population - Israel (%)
Place of birth for the foreign-born population - Jordan (%)
Place of birth for the foreign-born population - Kuwait (%)
Place of birth for the foreign-born population - Lebanon (%)
Place of birth for the foreign-born population - Saudi Arabia (%)
Place of birth for the foreign-born population - Syria (%)
Place of birth for the foreign-born population - Turkey (%)
Place of birth for the foreign-born population - Yemen (%)
Place of birth for the foreign-born population - Other Western Asia (%)
Place of birth for the foreign-born population - Eritrea (%)
Place of birth for the foreign-born population - Ethiopia (%)
Place of birth for the foreign-born population - Kenya (%)
Place of birth for the foreign-born population - Somalia (%)
Place of birth for the foreign-born population - Uganda (%)
Place of birth for the foreign-born population - Zimbabwe (%)
Place of birth for the foreign-born population - Other Eastern Africa (%)
Place of birth for the foreign-born population - Cameroon (%)
Place of birth for the foreign-born population - Congo (%)
Place of birth for the foreign-born population - Democratic Republic of Congo (Zaire) (%)
Place of birth for the foreign-born population - Other Middle Africa (%)
Place of birth for the foreign-born population - Egypt (%)
Place of birth for the foreign-born population - Morocco (%)
Place of birth for the foreign-born population - Sudan (%)
Place of birth for the foreign-born population - Other Northern Africa (%)
Place of birth for the foreign-born population - South Africa (%)
Place of birth for the foreign-born population - Other Southern Africa (%)
Place of birth for the foreign-born population - Cabo Verde (%)
Place of birth for the foreign-born population - Ghana (%)
Place of birth for the foreign-born population - Liberia (%)
Place of birth for the foreign-born population - Nigeria (%)
Place of birth for the foreign-born population - Senegal (%)
Place of birth for the foreign-born population - Sierra Leone (%)
Place of birth for the foreign-born population - Other Western Africa (%)
Place of birth for the foreign-born population - Australia (%)
Place of birth for the foreign-born population - New Zealand (%)
Place of birth for the foreign-born population - Fiji (%)
Place of birth for the foreign-born population - Micronesia (%)
Place of birth for the foreign-born population - Bahamas (%)
Place of birth for the foreign-born population - Barbados (%)
Place of birth for the foreign-born population - Cuba (%)
Place of birth for the foreign-born population - Dominica (%)
Place of birth for the foreign-born population - Dominican Republic (%)
Place of birth for the foreign-born population - Grenada (%)
Place of birth for the foreign-born population - Haiti (%)
Place of birth for the foreign-born population - Jamaica (%)
Place of birth for the foreign-born population - St. Vincent and the Grenadines (%)
Place of birth for the foreign-born population - Trinidad and Tobago (%)
Place of birth for the foreign-born population - West Indies (%)
Place of birth for the foreign-born population - Other Caribbean (%)
Place of birth for the foreign-born population - Belize (%)
Place of birth for the foreign-born population - Costa Rica (%)
Place of birth for the foreign-born population - El Salvador (%)
Place of birth for the foreign-born population - Guatemala (%)
Place of birth for the foreign-born population - Honduras (%)
Place of birth for the foreign-born population - Mexico (%)
Place of birth for the foreign-born population - Nicaragua (%)
Place of birth for the foreign-born population - Panama (%)
Place of birth for the foreign-born population - Other Central America (%)
Place of birth for the foreign-born population - Argentina (%)
Place of birth for the foreign-born population - Bolivia (%)
Place of birth for the foreign-born population - Brazil (%)
Place of birth for the foreign-born population - Chile (%)
Place of birth for the foreign-born population - Colombia (%)
Place of birth for the foreign-born population - Ecuador (%)
Place of birth for the foreign-born population - Guyana (%)
Place of birth for the foreign-born population - Peru (%)
Place of birth for the foreign-born population - Uruguay (%)
Place of birth for the foreign-born population - Venezuela (%)
Place of birth for the foreign-born population - Other South America (%)
Place of birth for the foreign-born population - Canada (%)
Place of birth for the foreign-born population - Other Northern America (%)
Place of birth for the foreign-born population - Other (%)
Latest news about races in Solvay, NY collected exclusively by city-data.com from local newspapers, TV, and radio stations
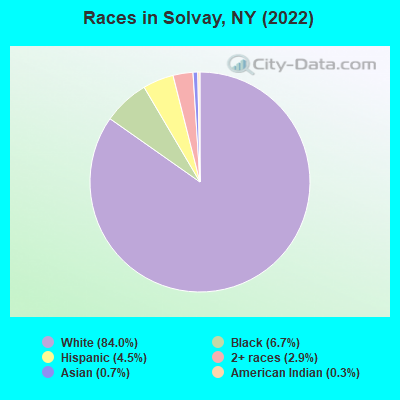
According to 2022 data, the most numerous races in Solvay, NY are White alone (5,499 residents), Hispanic (294 residents), and Black alone (441 residents). 82.2% of Solvay residents speak English at home. 16.2% of Solvay, NY residents are foreign-born (11.0% born in Europe, 4.9% born in Asia), which is 35.6% less than the foreign-born rate of 22.0% across the entire state of New York.
Race distribution in Solvay
2000 2022
11,760,981 62.0% White alone 2,867,583 15.1% Hispanic 2,812,623 14.8% Black alone 1,035,926 5.5% Asian alone 366,116 1.9% Two or more races 75,499 0.4% Other race alone 52,499 0.3% American Indian alone 5,230 0.03% Native Hawaiian and Other
10,408,933 52.9% White alone 3,867,299 19.7% Hispanic 2,633,840 13.4% Black alone 1,776,286 9.0% Asian alone 732,670 3.7% Two or more races 216,110 1.1% Other race alone 35,082 0.2% American Indian alone 6,931 0.04% Native Hawaiian and Other
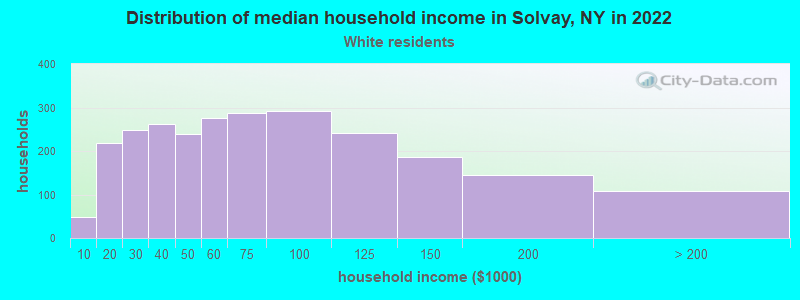
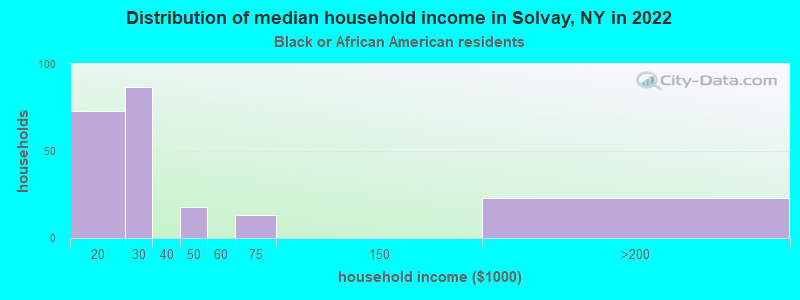
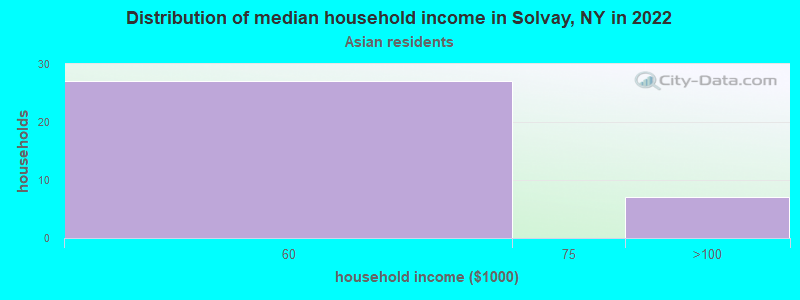
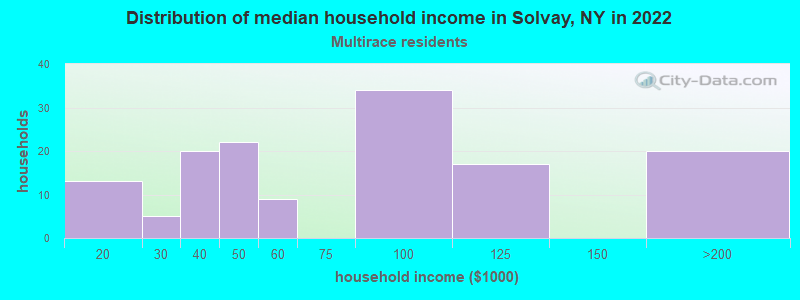
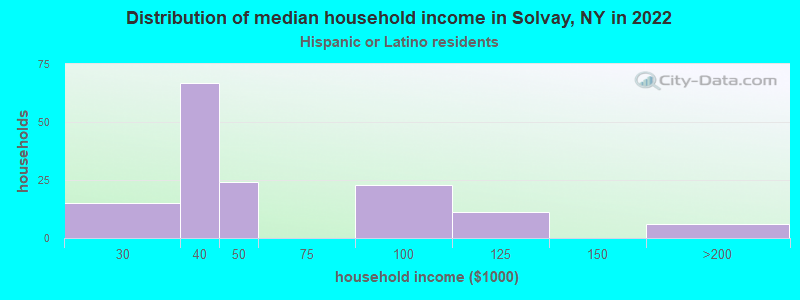
Income and house value in Solvay Median household income in 2022 $57,751 White non-Hispanic householders$21,370 Black householders$55,416 Hispanic or Latino race householdersMedian 2022 house value $148,231 White Non-Hispanic householders$102,550 American Indian or Alaska Native householders $256,375 Asian householders$89,498 Two or more races householders$158,486 Hispanic or Latino householders
Median age by race in Solvay
40.2 Median age for White residents39.4 42.2 30.4 Median age for Black or African American residents31.2 17.6 29.1 Median age for American Indian / Alaska Native residents30.2 -555,555,555.0 44.4 Median age for Asian residents-555,142,502.5 37.2 -487,992,314.6 Median age for Native Hawaiian / Pacific Islander residents-477,502,295.2 -497,387,669.3 -763,218,390.0 Median age for Other race residents-936,446,172.9 -715,231,787.4 31.4 Median age for Two or more races residents22.5 35.7 39.9 Median age for White alone residents39.1 42.1 28.6 Median age for Hispanic or Latino residents46.2 26.7
Owner/renter occupied households by race in Solvay
House owners and renters - White residents 1,443 55.7% Owner occupied1,149 44.3% Renter occupiedHouse owners and renters - Black or African American residents 244 100.0% Renter occupiedHouse owners and renters - Asian residents 7 25.5% Owner occupied22 74.5% Renter occupiedHouse owners and renters - Other race residents 27 100.0% Renter occupiedHouse owners and renters - Two or more races residents 23 17.9% Owner occupied107 82.1% Renter occupiedHouse owners and renters - White alone residents 1,448 55.8% Owner occupied1,145 44.2% Renter occupiedHouse owners and renters - Hispanic or Latino residents 21 15.2% Owner occupied115 84.8% Renter occupied
Language usage in Solvay
English speakers - Total 82.2% of residents of Solvay speak English at home.
1.9% of residents speak Spanish at home 28 24.6% Speak English very well86 75.4% Speak English less than very well14.6% of residents speak other language at home 293 34.2% Speak English very well564 65.8% Speak English less than very well
English speakers - Born in the United States 98.5% of residents of Solvay speak English at home.
English speakers - Native, born elsewhere 51.0% of residents of Solvay speak English at home.
29.8% of residents speak Spanish at home 25 80.6% Speak English very well6 19.4% Speak English less than very well8.7% of residents speak other language at home 9 100.0% Speak English less than very well
English speakers - Foreign-born 14.8% of residents of Solvay speak English at home.
1.7% of residents speak Spanish at home 15 100.0% Speak English less than very well81.3% of residents speak other language at home 179 25.6% Speak English very well519 74.4% Speak English less than very well
White (Caucasian) - Speak only English Native:
97.6% (3,967)Foreign-born:
18.5% (152)
White (Caucasian) - Speak another language Native:
2.4% (99)Foreign-born:
79.8% (658)
Two or more races - Speak another language Native:
9.1% (25)Foreign-born:
94.9% (18)
White alone - Speak only English Native:
97.5% (3,937)Foreign-born:
17.5% (155)
White alone - Speak another language Native:
2.5% (99)Foreign-born:
81.3% (723)
Hispanic or Latino - Speak another language Native:
41.5% (104)Foreign-born:
96.3% (16)
Foreign-born residents in Solvay 1,062 residents are foreign born (11.0% Europe , 4.9% Asia ).
This city:
16.2%New York:
22.6%
Marital status for residents in Solvay Marital status - White (Caucasian) population 15 years and over
Males 42.3% Never married46.4% Now married2.2% Separated2.6% Widowed6.5% DivorcedFemales 29.5% Never married47.7% Now married0.0% Separated9.9% Widowed12.9% DivorcedWomen who gave birth in the past 12 months Now married:
88.9% (91)Unmarried:
11.1% (11)
Women who did not give birth in the past 12 months Now married:
42.2% (405)Unmarried:
57.8% (555)
Marital status - Black or African American population 15 years and over
Males 79.3% Never married9.9% Now married0.0% Separated0.0% Widowed10.8% DivorcedFemales 85.6% Never married0.0% Now married0.0% Separated0.0% Widowed14.4% DivorcedWomen who did not give birth in the past 12 months Now married:
0.0% (0)Unmarried:
100.0% (224)
Marital status - Asian population 15 years and over
Males 0.0% Never married100.0% Now married0.0% Separated0.0% Widowed0.0% DivorcedFemales 31.2% Never married68.8% Now married0.0% Separated0.0% Widowed0.0% DivorcedWomen who did not give birth in the past 12 months Now married:
68.8% (23)Unmarried:
31.3% (10)
Marital status - Two or more races population 15 years and over
Males 29.8% Never married64.9% Now married0.0% Separated0.0% Widowed5.3% DivorcedFemales 73.2% Never married26.8% Now married0.0% Separated0.0% Widowed0.0% DivorcedWomen who did not give birth in the past 12 months Now married:
21.7% (36)Unmarried:
78.3% (131)
Marital status - White alone, not Hispanic / Latino population 15 years and over
Males 42.2% Never married46.5% Now married2.2% Separated2.6% Widowed6.5% DivorcedFemales 29.2% Never married48.1% Now married0.0% Separated10.1% Widowed12.6% DivorcedWomen who gave birth in the past 12 months Now married:
88.9% (92)Unmarried:
11.1% (11)
Women who did not give birth in the past 12 months Now married:
42.8% (407)Unmarried:
57.2% (544)
Marital status - Hispanic or Latino population 15 years and over
Males 42.9% Never married53.6% Now married0.0% Separated0.0% Widowed3.6% DivorcedFemales 59.5% Never married14.7% Now married0.0% Separated0.0% Widowed25.8% DivorcedWomen who did not give birth in the past 12 months Now married:
11.6% (17)Unmarried:
88.4% (131)
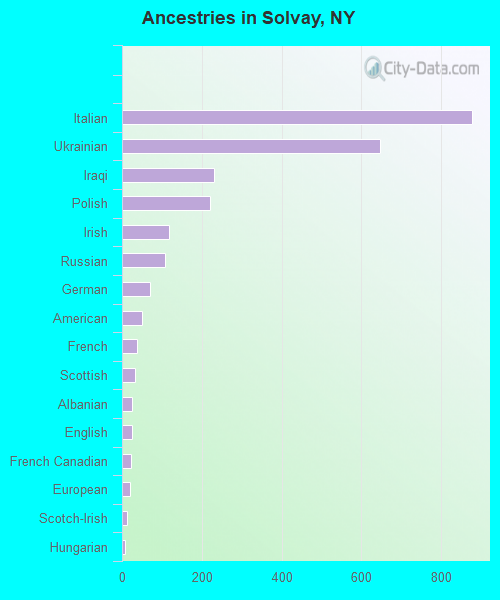
Ancestries in Solvay
876 28.1% Italian646 20.7% Ukrainian230 7.4% Iraqi220 7.1% Polish117 3.8% Irish109 3.5% Russian71 2.3% German49 1.6% American38 1.2% French33 1.1% Scottish26 0.8% Albanian24 0.8% English22 0.7% French Canadian21 0.7% European12 0.4% Scotch-Irish8 0.3% Hungarian7 0.2% Austrian7 0.2% Czechoslovakian
Children Nativity (place of birth) in Solvay
Children under 6 years - Living with two parents Both parents native 234 100.0% NativeBoth parents foreign-born 135 77.1% Native40 22.9% Foreign-bornChildren under 6 years - Living with one parent Native parent 232 100.0% NativeChildren 6 to 17 years - Living with two parents Both parents native 309 96.0% Native13 4.0% Foreign-bornBoth parents foreign-born 17 24.6% Native52 75.4% Foreign-bornChildren 6 to 17 years - Living with one parent Native parent 350 100.0% Native
Grandparents responsible for own grandchildren in Solvay
Grandparents (30 to 59 years) White / Caucasian 17 100.0% Not responsible for grandchildrenTwo or more races 16 100.0% Not responsible for grandchildrenWhite alone, not Hispanic / Latino 18 100.0% Not responsible for grandchildrenHispanic or Latino 11 100.0% Not responsible for grandchildrenGrandparents (60 years and over) White / Caucasian 35 71.0% Responsible for grandchildren14 29.0% Not responsible for grandchildrenWhite alone, not Hispanic / Latino 36 71.0% Responsible for grandchildren15 29.0% Not responsible for grandchildren