Races in Seven Oaks, South Carolina (SC) Detailed Stats
Ancestries, Foreign-born residents, place of birth
Settings
X


Recent posts about races in Seven Oaks, South Carolina on our local forum with over 2,400,000 registered users:
 | Moving to SC - Columbia Area - any recommendations? (41 replies) |
| Moving to Irmo (20 replies) |
| SC's census numbers released (79 replies) |
| Lexington and Irmo (21 replies) |
| Columbia Food that you LOVE (55 replies) |
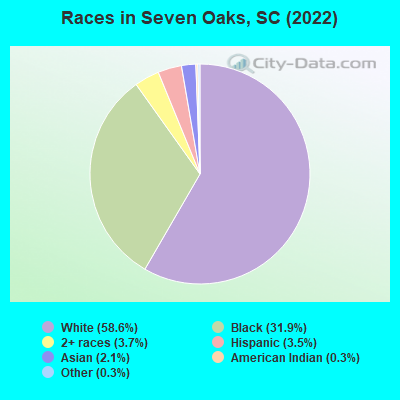
According to 2022 data, the most numerous races in Seven Oaks, SC are White alone (9,555 residents), Black alone (5,201 residents), and Hispanic (566 residents). 87.3% of Seven Oaks residents speak English at home. 8.1% of Seven Oaks, SC residents are foreign-born (4.1% born in Asia, 1.5% born in Europe, 1.4% born in Latin America, 1.1% born in Africa), which is 38.2% greater than the foreign-born rate of 5.0% across the entire state of South Carolina.
Race distribution in Seven Oaks
2000
2022

- 11,41272.4%White alone
- 3,37421.4%Black alone
- 4402.8%Asian alone
- 2981.9%Hispanic
- 1641.0%Two or more races
- 430.3%American Indian alone
- 150.10%Other race alone
- 90.06%Native Hawaiian and Other
Pacific Islander alone

-
- 9,55558.6%White alone
- 5,20131.9%Black alone
- 6053.7%Two or more races
- 5663.5%Hispanic
- 3362.1%Asian alone
- 450.3%Other race alone
- 520.3%American Indian alone
2000
2022
-
- 2,652,29166.1%White alone
- 1,178,48629.4%Black alone
- 95,0762.4%Hispanic
- 35,5680.9%Asian alone
- 33,2900.8%Two or more races
- 12,7650.3%American Indian alone
- 3,2660.08%Other race alone
- 1,2700.03%Native Hawaiian and Other
Pacific Islander alone

-
- 3,301,73962.5%White alone
- 1,313,29024.9%Black alone
- 343,7836.5%Hispanic
- 190,5083.6%Two or more races
- 89,8881.7%Asian alone
- 29,3900.6%Other race alone
- 12,1120.2%American Indian alone
- 1,9240.04%Native Hawaiian and Other
Pacific Islander alone

Income and house value in Seven Oaks
- Median household income in 2022
- $75,416White non-Hispanic householders
- $51,666Black householders
- $62,002Two or more races householders
- Median 2022 house value
- $211,212White Non-Hispanic householders
- $192,044Black or African American householders
- $209,351American Indian or Alaska Native householders
- $253,826Asian householders
- $174,180Hispanic or Latino householders
Household income for White non-Hispanic householders

Household income for Black householders

Household income for American Indian and Alaska Native householders

Household income for Asian householders

Household income for Some other race householders

Household income for Two or more races householders

Household income for Hispanic or Latino race householders

Median age by race in Seven Oaks
- 42.1Median age for White residents
- 42.8Males
- 40.7Females
- 29.4Median age for Black or African American residents
- 28.4Males
- 29.4Females
- 79.7Median age for American Indian / Alaska Native residents
- 63.1Males
- 87.5Females
- 49.0Median age for Asian residents
- 61.6Males
- 37.4Females
- -698,412,697.7Median age for Native Hawaiian / Pacific Islander residents
- -551,574,375.1Males
- -666,666,666.0Females
- 33.2Median age for Other race residents
- -647,342,994.5Males
- 40.3Females
- 30.7Median age for Two or more races residents
- 39.1Males
- 24.8Females
- 42.6Median age for White alone residents
- 43.4Males
- 41.4Females
- 28.6Median age for Hispanic or Latino residents
- 29.9Males
- 27.9Females
Owner/renter occupied households by race in Seven Oaks
- House owners and renters - White residents
- 3,29980.7%Owner occupied
- 78819.3%Renter occupied
- House owners and renters - Black or African American residents
- 89437.4%Owner occupied
- 1,49562.6%Renter occupied
- House owners and renters - American Indian / Alaska Native residents
- 153100.0%Owner occupied
- House owners and renters - Asian residents
- 5349.3%Owner occupied
- 5450.7%Renter occupied
- House owners and renters - Other race residents
- 826.5%Owner occupied
- 2373.5%Renter occupied
- House owners and renters - Two or more races residents
- 8212.9%Owner occupied
- 55087.1%Renter occupied
- House owners and renters - White alone residents
- 3,30481.8%Owner occupied
- 73518.2%Renter occupied
- House owners and renters - Hispanic or Latino residents
- 9631.9%Owner occupied
- 20568.1%Renter occupied
Language usage in Seven Oaks
- English speakers - Total
- 87.3% of residents of Seven Oaks speak English at home.
- 2.3% of residents speak Spanish at home
- 29482.4%Speak English very well
- 6317.6%Speak English less than very well
- 9.8% of residents speak other language at home
- 1,22881.9%Speak English very well
- 27118.1%Speak English less than very well
- English speakers - Born in the United States
- 93.7% of residents of Seven Oaks speak English at home.
- 1.2% of residents speak Spanish at home
- 59100.0%Speak English very well
- 3.5% of residents speak other language at home
- 16495.3%Speak English very well
- 84.7%Speak English less than very well
- English speakers - Native, born elsewhere
- 76.1% of residents of Seven Oaks speak English at home.
- 19.7% of residents speak Spanish at home
- 66100.0%Speak English very well
- English speakers - Foreign-born
- 8.7% of residents of Seven Oaks speak English at home.
- 14.0% of residents speak Spanish at home
- 12768.3%Speak English very well
- 5931.7%Speak English less than very well
- 77.7% of residents speak other language at home
- 80678.1%Speak English very well
- 22621.9%Speak English less than very well
White (Caucasian) - Speak only English
| Native: | 93.5% (8,078) |
| Foreign-born: | 10.9% (52) |
White (Caucasian) - Speak another language
| Native: | 7.0% (606) |
| Foreign-born: | 92.5% (438) |
Black or African American - Speak only English
| Native: | 97.7% (4,452) |
| Foreign-born: | 20.1% (80) |
Black or African American - Speak another language
| Native: | 2.2% (100) |
| Foreign-born: | 82.4% (327) |
Asian - Speak only English
| Native: | 67.7% (71) |
| Foreign-born: | 7.6% (19) |
Asian - Speak another language
| Native: | 25.9% (27) |
| Foreign-born: | 95.4% (234) |
Two or more races - Speak another language
| Native: | 5.4% (35) |
| Foreign-born: | 100.0% (207) |
White alone - Speak only English
| Native: | 94.8% (8,028) |
| Foreign-born: | 13.3% (60) |
White alone - Speak another language
| Native: | 5.5% (467) |
| Foreign-born: | 84.1% (380) |
Hispanic or Latino - Speak another language
| Native: | 31.5% (126) |
| Foreign-born: | 100.0% (154) |
Foreign-born residents in Seven Oaks
1,319 residents are foreign born (4.1% Asia, 1.5% Europe, 1.4% Latin America, 1.1% Africa).
| This city: | 8.1% |
| South Carolina: | 5.3% |


Marital status for residents in Seven Oaks
Marital status - White (Caucasian) population 15 years and over
- Males
- 33.5%Never married
- 52.7%Now married
- 2.1%Separated
- 4.7%Widowed
- 7.0%Divorced
- Females
- 36.3%Never married
- 43.2%Now married
- 0.2%Separated
- 10.5%Widowed
- 9.8%Divorced
Women who gave birth in the past 12 months
| Now married: | 22.1% (76) |
| Unmarried: | 77.9% (269) |
Women who did not give birth in the past 12 months
| Now married: | 36.5% (779) |
| Unmarried: | 63.5% (1,354) |
Marital status - Black or African American population 15 years and over
- Males
- 53.1%Never married
- 33.2%Now married
- 3.0%Separated
- 1.7%Widowed
- 9.0%Divorced
- Females
- 60.4%Never married
- 23.2%Now married
- 1.8%Separated
- 7.7%Widowed
- 6.9%Divorced
Women who gave birth in the past 12 months
| Now married: | 0.0% (0) |
| Unmarried: | 100.0% (86) |
Women who did not give birth in the past 12 months
| Now married: | 15.8% (233) |
| Unmarried: | 84.2% (1,242) |
Marital status - American Indian / Alaska Native population 15 years and over
- Males
- 0.0%Never married
- 5.4%Now married
- 49.5%Separated
- 0.0%Widowed
- 45.0%Divorced
- Females
- 0.0%Never married
- 71.9%Now married
- 0.0%Separated
- 0.0%Widowed
- 28.1%Divorced
Marital status - Asian population 15 years and over
- Males
- 49.7%Never married
- 35.6%Now married
- 3.7%Separated
- 3.1%Widowed
- 8.0%Divorced
- Females
- 23.5%Never married
- 56.4%Now married
- 0.0%Separated
- 0.0%Widowed
- 20.1%Divorced
Women who did not give birth in the past 12 months
| Now married: | 65.7% (74) |
| Unmarried: | 34.3% (39) |
Marital status - Other race population 15 years and over
- Males
- 0.0%Never married
- 100.0%Now married
- 0.0%Separated
- 0.0%Widowed
- 0.0%Divorced
- Females
- 73.0%Never married
- 0.0%Now married
- 0.0%Separated
- 0.0%Widowed
- 27.0%Divorced
Women who did not give birth in the past 12 months
| Now married: | 0.0% (0) |
| Unmarried: | 100.0% (37) |
Marital status - Two or more races population 15 years and over
- Males
- 19.4%Never married
- 63.3%Now married
- 8.7%Separated
- 0.0%Widowed
- 8.7%Divorced
- Females
- 57.4%Never married
- 23.5%Now married
- 6.5%Separated
- 0.0%Widowed
- 12.6%Divorced
Women who did not give birth in the past 12 months
| Now married: | 16.0% (34) |
| Unmarried: | 84.0% (178) |
Marital status - White alone, not Hispanic / Latino population 15 years and over
- Males
- 32.9%Never married
- 53.0%Now married
- 2.1%Separated
- 4.8%Widowed
- 7.1%Divorced
- Females
- 36.0%Never married
- 43.2%Now married
- 0.2%Separated
- 10.5%Widowed
- 10.1%Divorced
Women who gave birth in the past 12 months
| Now married: | 22.1% (76) |
| Unmarried: | 77.9% (268) |
Women who did not give birth in the past 12 months
| Now married: | 35.9% (725) |
| Unmarried: | 64.1% (1,291) |
Marital status - Hispanic or Latino population 15 years and over
- Males
- 19.6%Never married
- 53.4%Now married
- 27.0%Separated
- 0.0%Widowed
- 0.0%Divorced
- Females
- 48.4%Never married
- 28.8%Now married
- 0.0%Separated
- 4.8%Widowed
- 18.0%Divorced
Women who did not give birth in the past 12 months
| Now married: | 25.4% (61) |
| Unmarried: | 74.6% (179) |
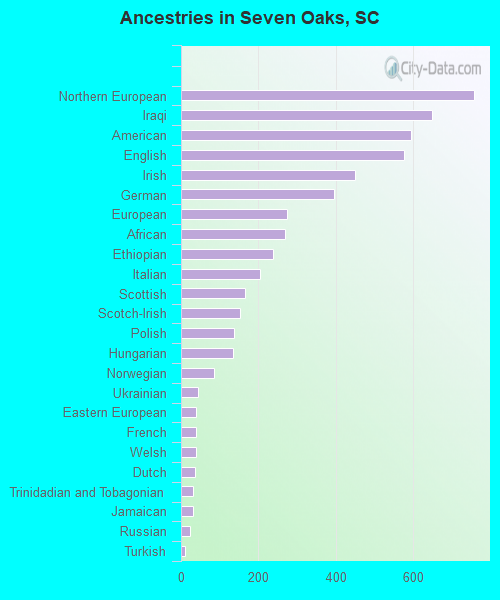
Ancestries in Seven Oaks

- 7578.0%Northern European
- 6496.9%Iraqi
- 5946.3%American
- 5756.1%English
- 4494.8%Irish
- 3954.2%German
- 2742.9%European
- 2682.8%African
- 2382.5%Ethiopian
- 2032.2%Italian
- 1651.7%Scottish
- 1531.6%Scotch-Irish
- 1361.4%Polish
- 1341.4%Hungarian
- 850.9%Norwegian
- 450.5%Ukrainian
- 390.4%Eastern European
- 380.4%French
- 380.4%Welsh
- 360.4%Dutch
- 320.3%Trinidadian and Tobagonian
- 300.3%Jamaican
- 240.3%Russian
- 100.1%Turkish
- 60.06%Slovak
- 50.05%British
Geographical mobility in Seven Oaks

- Same house 1 year ago
- 8,36888.9%White (Caucasian)
- 4,22181.8%Black or African American
- 11661.9%American Indian / Alaska Native
- 26574.5%Asian
- 4289.6%Other race
- 74479.6%Two or more races
- 8,30289.7%White alone, not Hispanic / Latino
- 37567.4%Hispanic or Latino

-
- Moved within same county
- 3183.4%White / Caucasian
- 2524.9%Black or African American
- 2915.5%American Indian / Alaska Native
- 434.7%Two or more races
- 3203.5%White alone, not Hispanic / Latino
- 6712.0%Hispanic or Latino

-
- Moved within same state
- 4474.8%White / Caucasian
- 4809.3%Black or African American
- 919.7%Two or more races
- 4044.4%White alone, not Hispanic / Latino
- 8415.2%Hispanic or Latino

-
- Moved from different state
- 1371.5%White / Caucasian
- 831.6%Black or African American
- 505.3%Two or more races
- 1361.5%White alone, not Hispanic / Latino

-
- Moved from abroad
- 310.3%White
- 5014.1%Asian
- 366.5%Hispanic or Latino

Children Nativity (place of birth) in Seven Oaks
Place of birth for residents in Seven Oaks
![Place of birth for the foreign-born population - Regions]()
- 664Asia
- 436Western Asia
- 247Europe
- 228Americas
- 228Latin America
- 178Africa
- 166Eastern Africa
- 138Caribbean
- 113Western Europe
- 106Eastern Asia
- 92Eastern Europe
- 91South Central Asia
- 59Central America
- 42Northern Europe
- 31South Eastern Asia
- 30South America
- 19China

![Place of birth for the foreign-born population - Countries]()
- 429Iraq
- 128Ethiopia
- 91India
- 83Germany
- 77Hungary
- 59Mexico
- 56Japan
- 46Cuba
- 41Trinidad and Tobago
- 30Korea
- 30Colombia
- 29France
- 29Jamaica
- 26Vietnam
- 22Eritrea
- 21Grenada
- 20Ireland
- 19China
- 14Russia
- 13England
- 9United Kingdom
- 7Turkey
- 5Philippines

Grandparents responsible for own grandchildren in Seven Oaks
Zip codes: 29210.