Races in Prior Lake, Minnesota (MN) Detailed Stats
Data:
Races - White alone (%)
Races - White alone (% change since 2000)
Races - Black alone (%)
Races - Black alone (% change since 2000)
Races - American Indian alone (%)
Races - American Indian alone (% change since 2000)
Races - Asian alone (%)
Races - Asian alone (% change since 2000)
Races - Hispanic (%)
Races - Hispanic (% change since 2000)
Races - Native Hawaiian and Other Pacific Islander alone (%)
Races - Native Hawaiian and Other Pacific Islander alone (% change since 2000)
Races - Two or more races(%)
Races - Two or more races(% change since 2000)
Races - Other race alone (%)
Races - Other race alone (% change since 2000)
Racial diversity
Place of birth - Born in state of residence (%)
Place of birth - Born in state of residence (%) - White
Place of birth - Born in state of residence (%) - Black or African American
Place of birth - Born in state of residence (%) - Asian
Place of birth - Born in state of residence (%) - Hispanic or Latino
Place of birth - Born in state of residence (%) - American Indian and Alaska Native
Place of birth - Born in state of residence (%) - Multirace
Place of birth - Born in state of residence (%) - Other Race
Place of birth - Born in other state (%)
Place of birth - Born in other state (%) - White
Place of birth - Born in other state (%) - Black or African American
Place of birth - Born in other state (%) - Asian
Place of birth - Born in other state (%) - Hispanic or Latino
Place of birth - Born in other state (%) - American Indian and Alaska Native
Place of birth - Born in other state (%) - Multirace
Place of birth - Born in other state (%) - Other Race
Place of birth - Native, outside of US (%)
Place of birth - Native, outside of US (%) - White
Place of birth - Native, outside of US (%) - Black or African American
Place of birth - Native, outside of US (%) - Asian
Place of birth - Native, outside of US (%) - Hispanic or Latino
Place of birth - Native, outside of US (%) - American Indian and Alaska Native
Place of birth - Native, outside of US (%) - Multirace
Place of birth - Native, outside of US (%) - Other Race
Place of birth - Foreign born (%)
Place of birth - Foreign born (%) - White
Place of birth - Foreign born (%) - Black or African American
Place of birth - Foreign born (%) - Asian
Place of birth - Foreign born (%) - Hispanic or Latino
Place of birth - Foreign born (%) - American Indian and Alaska Native
Place of birth - Foreign born (%) - Multirace
Place of birth - Foreign born (%) - Other Race
Residents speaking English at home (%)
Residents speaking English at home - Born in the United States (%)
Residents speaking English at home - Native, born elsewhere (%)
Residents speaking English at home - Foreign born (%)
Residents speaking Spanish at home (%)
Residents speaking Spanish at home - Born in the United States (%)
Residents speaking Spanish at home - Native, born elsewhere (%)
Residents speaking Spanish at home - Foreign born (%)
Residents speaking other language at home (%)
Residents speaking other language at home - Born in the United States (%)
Residents speaking other language at home - Native, born elsewhere (%)
Residents speaking other language at home - Foreign born (%)
Marital status - Never married (%)
Marital status - Now married (%)
Marital status - Separated (%)
Marital status - Widowed (%)
Marital status - Divorced (%)
Ancestries Reported - Arab (%)
Ancestries Reported - Czech (%)
Ancestries Reported - Danish (%)
Ancestries Reported - Dutch (%)
Ancestries Reported - English (%)
Ancestries Reported - French (%)
Ancestries Reported - French Canadian (%)
Ancestries Reported - German (%)
Ancestries Reported - Greek (%)
Ancestries Reported - Hungarian (%)
Ancestries Reported - Irish (%)
Ancestries Reported - Italian (%)
Ancestries Reported - Lithuanian (%)
Ancestries Reported - Norwegian (%)
Ancestries Reported - Polish (%)
Ancestries Reported - Portuguese (%)
Ancestries Reported - Russian (%)
Ancestries Reported - Scotch-Irish (%)
Ancestries Reported - Scottish (%)
Ancestries Reported - Slovak (%)
Ancestries Reported - Subsaharan African (%)
Ancestries Reported - Swedish (%)
Ancestries Reported - Swiss (%)
Ancestries Reported - Ukrainian (%)
Ancestries Reported - United States (%)
Ancestries Reported - Welsh (%)
Ancestries Reported - West Indian (%)
Ancestries Reported - Other (%)
Geographical mobility - Same house 1 year ago (%)
Geographical mobility - Same house 1 year ago (%) - White
Geographical mobility - Same house 1 year ago (%) - Black or African American
Geographical mobility - Same house 1 year ago (%) - Asian
Geographical mobility - Same house 1 year ago (%) - Hispanic or Latino
Geographical mobility - Same house 1 year ago (%) - American Indian and Alaska Native
Geographical mobility - Same house 1 year ago (%) - Multirace
Geographical mobility - Same house 1 year ago (%) - Other Race
Geographical mobility - Moved within same county (%)
Geographical mobility - Moved within same county (%) - White
Geographical mobility - Moved within same county (%) - Black or African American
Geographical mobility - Moved within same county (%) - Asian
Geographical mobility - Moved within same county (%) - Hispanic or Latino
Geographical mobility - Moved within same county (%) - American Indian and Alaska Native
Geographical mobility - Moved within same county (%) - Multirace
Geographical mobility - Moved within same county (%) - Other Race
Geographical mobility - Moved from different county within same state (%)
Geographical mobility - Moved from different county within same state (%) - White
Geographical mobility - Moved from different county within same state (%) - Black or African American
Geographical mobility - Moved from different county within same state (%) - Asian
Geographical mobility - Moved from different county within same state (%) - Hispanic or Latino
Geographical mobility - Moved from different county within same state (%) - American Indian and Alaska Native
Geographical mobility - Moved from different county within same state (%) - Multirace
Geographical mobility - Moved from different county within same state (%) - Other Race
Geographical mobility - Moved from different state (%)
Geographical mobility - Moved from different state (%) - White
Geographical mobility - Moved from different state (%) - Black or African American
Geographical mobility - Moved from different state (%) - Asian
Geographical mobility - Moved from different state (%) - Hispanic or Latino
Geographical mobility - Moved from different state (%) - American Indian and Alaska Native
Geographical mobility - Moved from different state (%) - Multirace
Geographical mobility - Moved from different state (%) - Other Race
Geographical mobility - Moved from abroad (%)
Geographical mobility - Moved from abroad (%) - White
Geographical mobility - Moved from abroad (%) - Black or African American
Geographical mobility - Moved from abroad (%) - Asian
Geographical mobility - Moved from abroad (%) - Hispanic or Latino
Geographical mobility - Moved from abroad (%) - American Indian and Alaska Native
Geographical mobility - Moved from abroad (%) - Multirace
Geographical mobility - Moved from abroad (%) - Other Race
Place of birth for the foreign-born population - Ireland (%)
Place of birth for the foreign-born population - Denmark (%)
Place of birth for the foreign-born population - Norway (%)
Place of birth for the foreign-born population - Sweden (%)
Place of birth for the foreign-born population - United Kingdom (%)
Place of birth for the foreign-born population - England (%)
Place of birth for the foreign-born population - Scotland (%)
Place of birth for the foreign-born population - Other Northern Europe (%)
Place of birth for the foreign-born population - Austria (%)
Place of birth for the foreign-born population - Belgium (%)
Place of birth for the foreign-born population - France (%)
Place of birth for the foreign-born population - Germany (%)
Place of birth for the foreign-born population - Netherlands (%)
Place of birth for the foreign-born population - Switzerland (%)
Place of birth for the foreign-born population - Other Western Europe (%)
Place of birth for the foreign-born population - Greece (%)
Place of birth for the foreign-born population - Italy (%)
Place of birth for the foreign-born population - Portugal (%)
Place of birth for the foreign-born population - Spain (%)
Place of birth for the foreign-born population - Other Southern Europe (%)
Place of birth for the foreign-born population - Albania (%)
Place of birth for the foreign-born population - Belarus (%)
Place of birth for the foreign-born population - Bosnia and Herzegovina (%)
Place of birth for the foreign-born population - Bulgaria (%)
Place of birth for the foreign-born population - Croatia (%)
Place of birth for the foreign-born population - Czechoslovakia (%)
Place of birth for the foreign-born population - Hungary (%)
Place of birth for the foreign-born population - Latvia (%)
Place of birth for the foreign-born population - Lithuania (%)
Place of birth for the foreign-born population - North Macedonia (Macedonia) (%)
Place of birth for the foreign-born population - Moldova (%)
Place of birth for the foreign-born population - Poland (%)
Place of birth for the foreign-born population - Romania (%)
Place of birth for the foreign-born population - Russia (%)
Place of birth for the foreign-born population - Serbia (%)
Place of birth for the foreign-born population - Ukraine (%)
Place of birth for the foreign-born population - Other Eastern Europe (%)
Place of birth for the foreign-born population - China (%)
Place of birth for the foreign-born population - Hong Kong (%)
Place of birth for the foreign-born population - Taiwan (%)
Place of birth for the foreign-born population - Japan (%)
Place of birth for the foreign-born population - Korea (%)
Place of birth for the foreign-born population - Other Eastern Asia (%)
Place of birth for the foreign-born population - Afghanistan (%)
Place of birth for the foreign-born population - Bangladesh (%)
Place of birth for the foreign-born population - India (%)
Place of birth for the foreign-born population - Iran (%)
Place of birth for the foreign-born population - Kazakhstan (%)
Place of birth for the foreign-born population - Nepal (%)
Place of birth for the foreign-born population - Pakistan (%)
Place of birth for the foreign-born population - Sri Lanka (%)
Place of birth for the foreign-born population - Uzbekistan (%)
Place of birth for the foreign-born population - Other South Central Asia (%)
Place of birth for the foreign-born population - Burma (%)
Place of birth for the foreign-born population - Cambodia (%)
Place of birth for the foreign-born population - Indonesia (%)
Place of birth for the foreign-born population - Laos (%)
Place of birth for the foreign-born population - Malaysia (%)
Place of birth for the foreign-born population - Philippines (%)
Place of birth for the foreign-born population - Singapore (%)
Place of birth for the foreign-born population - Thailand (%)
Place of birth for the foreign-born population - Vietnam (%)
Place of birth for the foreign-born population - Other South Eastern Asia (%)
Place of birth for the foreign-born population - Armenia (%)
Place of birth for the foreign-born population - Iraq (%)
Place of birth for the foreign-born population - Israel (%)
Place of birth for the foreign-born population - Jordan (%)
Place of birth for the foreign-born population - Kuwait (%)
Place of birth for the foreign-born population - Lebanon (%)
Place of birth for the foreign-born population - Saudi Arabia (%)
Place of birth for the foreign-born population - Syria (%)
Place of birth for the foreign-born population - Turkey (%)
Place of birth for the foreign-born population - Yemen (%)
Place of birth for the foreign-born population - Other Western Asia (%)
Place of birth for the foreign-born population - Eritrea (%)
Place of birth for the foreign-born population - Ethiopia (%)
Place of birth for the foreign-born population - Kenya (%)
Place of birth for the foreign-born population - Somalia (%)
Place of birth for the foreign-born population - Uganda (%)
Place of birth for the foreign-born population - Zimbabwe (%)
Place of birth for the foreign-born population - Other Eastern Africa (%)
Place of birth for the foreign-born population - Cameroon (%)
Place of birth for the foreign-born population - Congo (%)
Place of birth for the foreign-born population - Democratic Republic of Congo (Zaire) (%)
Place of birth for the foreign-born population - Other Middle Africa (%)
Place of birth for the foreign-born population - Egypt (%)
Place of birth for the foreign-born population - Morocco (%)
Place of birth for the foreign-born population - Sudan (%)
Place of birth for the foreign-born population - Other Northern Africa (%)
Place of birth for the foreign-born population - South Africa (%)
Place of birth for the foreign-born population - Other Southern Africa (%)
Place of birth for the foreign-born population - Cabo Verde (%)
Place of birth for the foreign-born population - Ghana (%)
Place of birth for the foreign-born population - Liberia (%)
Place of birth for the foreign-born population - Nigeria (%)
Place of birth for the foreign-born population - Senegal (%)
Place of birth for the foreign-born population - Sierra Leone (%)
Place of birth for the foreign-born population - Other Western Africa (%)
Place of birth for the foreign-born population - Australia (%)
Place of birth for the foreign-born population - New Zealand (%)
Place of birth for the foreign-born population - Fiji (%)
Place of birth for the foreign-born population - Micronesia (%)
Place of birth for the foreign-born population - Bahamas (%)
Place of birth for the foreign-born population - Barbados (%)
Place of birth for the foreign-born population - Cuba (%)
Place of birth for the foreign-born population - Dominica (%)
Place of birth for the foreign-born population - Dominican Republic (%)
Place of birth for the foreign-born population - Grenada (%)
Place of birth for the foreign-born population - Haiti (%)
Place of birth for the foreign-born population - Jamaica (%)
Place of birth for the foreign-born population - St. Vincent and the Grenadines (%)
Place of birth for the foreign-born population - Trinidad and Tobago (%)
Place of birth for the foreign-born population - West Indies (%)
Place of birth for the foreign-born population - Other Caribbean (%)
Place of birth for the foreign-born population - Belize (%)
Place of birth for the foreign-born population - Costa Rica (%)
Place of birth for the foreign-born population - El Salvador (%)
Place of birth for the foreign-born population - Guatemala (%)
Place of birth for the foreign-born population - Honduras (%)
Place of birth for the foreign-born population - Mexico (%)
Place of birth for the foreign-born population - Nicaragua (%)
Place of birth for the foreign-born population - Panama (%)
Place of birth for the foreign-born population - Other Central America (%)
Place of birth for the foreign-born population - Argentina (%)
Place of birth for the foreign-born population - Bolivia (%)
Place of birth for the foreign-born population - Brazil (%)
Place of birth for the foreign-born population - Chile (%)
Place of birth for the foreign-born population - Colombia (%)
Place of birth for the foreign-born population - Ecuador (%)
Place of birth for the foreign-born population - Guyana (%)
Place of birth for the foreign-born population - Peru (%)
Place of birth for the foreign-born population - Uruguay (%)
Place of birth for the foreign-born population - Venezuela (%)
Place of birth for the foreign-born population - Other South America (%)
Place of birth for the foreign-born population - Canada (%)
Place of birth for the foreign-born population - Other Northern America (%)
Place of birth for the foreign-born population - Other (%)
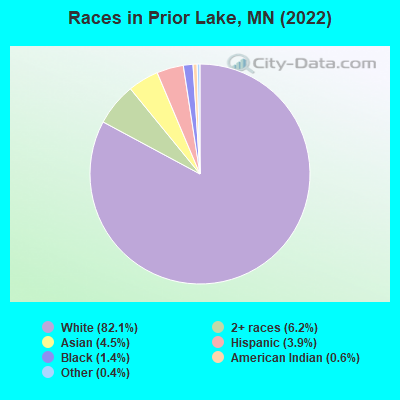
According to 2022 data, the most numerous races in Prior Lake, MN are White alone (23,148 residents), Black alone (384 residents), and Hispanic (1,106 residents). 91.4% of Prior Lake residents speak English at home. 6.6% of Prior Lake, MN residents are foreign-born (3.5% born in Asia, 1.4% born in Europe, 1.3% born in Latin America), which is 21.6% less than the foreign-born rate of 8.0% across the entire state of Minnesota.
Race distribution in Prior Lake
2000 2022
4,337,143 88.2% White alone 168,813 3.4% Black alone 143,382 2.9% Hispanic 141,083 2.9% Asian alone 70,304 1.4% Two or more races 52,009 1.1% American Indian alone 5,031 0.1% Other race alone 1,714 0.03% Native Hawaiian and Other
4,356,347 76.2% White alone 395,179 6.9% Black alone 333,830 5.8% Hispanic 294,800 5.2% Asian alone 259,649 4.5% Two or more races 42,125 0.7% American Indian alone 32,976 0.6% Other race alone 2,278 0.04% Native Hawaiian and Other
Income and house value in Prior Lake Median household income in 2022 $119,115 White non-Hispanic householders$199,746 Black householdersover $200,000 American Indian and Alaska Native householders$198,506 Asian householders$187,619 Two or more races householdersover $200,000 Hispanic or Latino race householdersMedian 2022 house value $417,363 White Non-Hispanic householders$642,907 Black or African American householders$538,147 American Indian or Alaska Native householders $637,884 Asian householders$657,736 Some other race householders$276,488 Two or more races householders$478,353 Hispanic or Latino householders
Median age by race in Prior Lake
41.6 Median age for White residents41.7 41.6 38.0 Median age for Black or African American residents48.5 14.1 50.2 Median age for American Indian / Alaska Native residents44.5 38.4 41.5 Median age for Asian residents50.9 36.6 -744,336,568.8 Median age for Native Hawaiian / Pacific Islander residents-856,799,036.4 -534,959,349.1 34.7 Median age for Other race residents13.9 64.2 16.5 Median age for Two or more races residents17.0 16.3 41.8 Median age for White alone residents41.8 41.7 31.7 Median age for Hispanic or Latino residents18.1 42.9
Owner/renter occupied households by race in Prior Lake
House owners and renters - White residents 7,804 85.0% Owner occupied1,372 15.0% Renter occupiedHouse owners and renters - Black or African American residents 241 93.8% Owner occupied16 6.2% Renter occupiedHouse owners and renters - American Indian / Alaska Native residents 84 83.0% Owner occupied17 17.0% Renter occupiedHouse owners and renters - Asian residents 341 98.2% Owner occupied6 1.8% Renter occupiedHouse owners and renters - Native Hawaiian / Pacific Islander residents 3 100.0% Owner occupiedHouse owners and renters - Other race residents 56 60.0% Owner occupied38 40.0% Renter occupiedHouse owners and renters - Two or more races residents 322 94.2% Owner occupied20 5.8% Renter occupiedHouse owners and renters - White alone residents 7,709 84.3% Owner occupied1,441 15.7% Renter occupiedHouse owners and renters - Hispanic or Latino residents 212 93.5% Owner occupied15 6.5% Renter occupied
Language usage in Prior Lake
English speakers - Total 91.4% of residents of Prior Lake speak English at home.
2.0% of residents speak Spanish at home 331 62.9% Speak English very well195 37.1% Speak English less than very well6.4% of residents speak other language at home 1,138 66.2% Speak English very well582 33.8% Speak English less than very well
English speakers - Born in the United States 97.2% of residents of Prior Lake speak English at home.
3.0% of residents speak Spanish at home 194 92.4% Speak English very well16 7.6% Speak English less than very well0.4% of residents speak other language at home 26 100.0% Speak English very well
English speakers - Native, born elsewhere 53.0% of residents of Prior Lake speak English at home.
7.3% of residents speak Spanish at home 17 100.0% Speak English very well11.2% of residents speak other language at home 9 34.6% Speak English very well17 65.4% Speak English less than very well
English speakers - Foreign-born 23.9% of residents of Prior Lake speak English at home.
9.2% of residents speak Spanish at home 68 39.3% Speak English very well105 60.7% Speak English less than very well65.6% of residents speak other language at home 673 54.4% Speak English very well565 45.6% Speak English less than very well
White (Caucasian) - Speak only English Native:
97.9% (21,270)Foreign-born:
56.5% (343)
White (Caucasian) - Speak another language Native:
2.1% (454)Foreign-born:
54.1% (329)
Black or African American - Speak only English Native:
100.0% (380)Foreign-born:
62.0% (5)
Asian - Speak only English Native:
33.8% (89)Foreign-born:
13.9% (134)
Asian - Speak another language Native:
71.8% (188)Foreign-born:
84.5% (815)
Other race - Speak only English Native:
100.0% (399)Foreign-born:
2.4% (2)
Other race - Speak another language Native:
10.9% (44)Foreign-born:
100.0% (85)
Two or more races - Speak only English Native:
95.4% (1,559)Foreign-born:
35.7% (21)
Two or more races - Speak another language Native:
4.9% (80)Foreign-born:
61.0% (35)
White alone - Speak only English Native:
98.3% (21,076)Foreign-born:
43.4% (260)
White alone - Speak another language Native:
1.7% (373)Foreign-born:
59.1% (354)
Hispanic or Latino - Speak only English Native:
70.8% (599)Foreign-born:
53.7% (132)
Hispanic or Latino - Speak another language Native:
30.4% (257)Foreign-born:
77.6% (191)
Foreign-born residents in Prior Lake 1,855 residents are foreign born (3.5% Asia , 1.4% Europe , 1.3% Latin America ).
This city:
6.6%Minnesota:
8.5%
Marital status for residents in Prior Lake Marital status - White (Caucasian) population 15 years and over
Males 27.1% Never married64.4% Now married0.5% Separated1.2% Widowed6.8% DivorcedFemales 23.3% Never married60.3% Now married0.4% Separated7.9% Widowed8.1% DivorcedWomen who gave birth in the past 12 months Now married:
94.3% (192)Unmarried:
5.7% (12)
Women who did not give birth in the past 12 months Now married:
55.8% (2,870)Unmarried:
44.2% (2,273)
Marital status - Black or African American population 15 years and over
Males 9.0% Never married91.0% Now married0.0% Separated0.0% Widowed0.0% DivorcedFemales 4.3% Never married78.3% Now married0.0% Separated17.4% Widowed0.0% DivorcedWomen who did not give birth in the past 12 months Now married:
94.7% (37)Unmarried:
5.3% (2)
Marital status - American Indian / Alaska Native population 15 years and over
Males 39.1% Never married51.6% Now married0.0% Separated1.6% Widowed7.8% DivorcedFemales 32.3% Never married24.6% Now married16.9% Separated4.6% Widowed21.5% DivorcedWomen who did not give birth in the past 12 months Now married:
52.6% (21)Unmarried:
47.4% (19)
Marital status - Asian population 15 years and over
Males 26.0% Never married65.1% Now married0.0% Separated1.1% Widowed7.8% DivorcedFemales 11.7% Never married70.1% Now married0.0% Separated12.6% Widowed5.5% DivorcedWomen who gave birth in the past 12 months Now married:
0.0% (0)Unmarried:
100.0% (11)
Women who did not give birth in the past 12 months Now married:
76.1% (211)Unmarried:
23.9% (66)
Marital status - Other race population 15 years and over
Males 61.3% Never married21.0% Now married0.0% Separated0.0% Widowed17.7% DivorcedFemales 43.0% Never married57.0% Now married0.0% Separated0.0% Widowed0.0% DivorcedWomen who did not give birth in the past 12 months Now married:
54.9% (117)Unmarried:
45.1% (96)
Marital status - Two or more races population 15 years and over
Males 39.1% Never married54.4% Now married0.0% Separated0.0% Widowed6.5% DivorcedFemales 50.3% Never married42.5% Now married0.0% Separated0.0% Widowed7.2% DivorcedWomen who gave birth in the past 12 months Now married:
100.0% (3)Unmarried:
0.0% (0)
Women who did not give birth in the past 12 months Now married:
28.6% (131)Unmarried:
71.4% (328)
Marital status - White alone, not Hispanic / Latino population 15 years and over
Males 27.0% Never married64.4% Now married0.5% Separated1.3% Widowed6.9% DivorcedFemales 23.4% Never married59.9% Now married0.5% Separated8.0% Widowed8.2% DivorcedWomen who gave birth in the past 12 months Now married:
94.3% (191)Unmarried:
5.7% (12)
Women who did not give birth in the past 12 months Now married:
55.8% (2,829)Unmarried:
44.2% (2,238)
Marital status - Hispanic or Latino population 15 years and over
Males 46.4% Never married53.6% Now married0.0% Separated0.0% Widowed0.0% DivorcedFemales 26.4% Never married73.2% Now married0.0% Separated0.0% Widowed0.4% DivorcedWomen who did not give birth in the past 12 months Now married:
60.2% (155)Unmarried:
39.8% (102)
Ancestries in Prior Lake
3,118 27.8% German1,541 13.7% Norwegian1,029 9.2% American489 4.4% Irish367 3.3% Russian346 3.1% European264 2.4% Polish242 2.2% English241 2.1% Scandinavian184 1.6% Swedish172 1.5% Scottish101 0.9% Czech83 0.7% Northern European82 0.7% Ukrainian77 0.7% Italian67 0.6% Dutch63 0.6% Turkish51 0.5% Hungarian47 0.4% British47 0.4% Finnish33 0.3% Scotch-Irish30 0.3% Czechoslovakian28 0.2% Yugoslavian23 0.2% Eastern European18 0.2% Afghan16 0.1% Danish12 0.1% Slavic11 0.10% Canadian10 0.09% Lebanese9 0.08% Belgian9 0.08% French Canadian9 0.08% Trinidadian and Tobagonian8 0.07% Swiss7 0.06% Romanian6 0.05% French5 0.04% Welsh3 0.03% Estonian2 0.02% Nigerian
Children Nativity (place of birth) in Prior Lake
Children under 6 years - Living with two parents Both parents native 1,286 100.0% NativeBoth parents foreign-born 117 100.0% NativeOne native, one foreign-born parent 76 100.0% NativeChildren under 6 years - Living with one parent Native parent 338 100.0% NativeForeign-born parent 15 100.0% NativeChildren 6 to 17 years - Living with two parents Both parents native 3,620 100.0% NativeBoth parents foreign-born 230 73.1% Native85 26.9% Foreign-bornOne native, one foreign-born parent 392 91.0% Native39 9.0% Foreign-bornChildren 6 to 17 years - Living with one parent Native parent 685 100.0% NativeForeign-born parent 25 50.7% Native24 49.3% Foreign-born
Grandparents responsible for own grandchildren in Prior Lake
Grandparents (30 to 59 years) White / Caucasian 38 25.0% Responsible for grandchildren115 75.0% Not responsible for grandchildrenAmerican Indian / Alaska Native 7 100.0% Responsible for grandchildrenAsian 2 100.0% Responsible for grandchildrenWhite alone, not Hispanic / Latino 38 25.0% Responsible for grandchildren115 75.0% Not responsible for grandchildrenHispanic or Latino 2 100.0% Responsible for grandchildren
Grandparents (60 years and over) White / Caucasian 85 100.0% Not responsible for grandchildrenAsian 60 100.0% Not responsible for grandchildrenWhite alone, not Hispanic / Latino 78 100.0% Not responsible for grandchildrenHispanic or Latino 10 100.0% Not responsible for grandchildren