Races in Pattersonville-Rotterdam Junction, New York (NY) Detailed Stats
Ancestries, Foreign-born residents, place of birth

Discuss Pattersonville-Rotterdam Junction, New York races on our local forum with over 2,400,000 registered users
0.7% of Pattersonville-Rotterdam Junction, NY residents are foreign-born , which is 3266.0% less than the foreign-born rate of 22.0% across the entire state of New York.
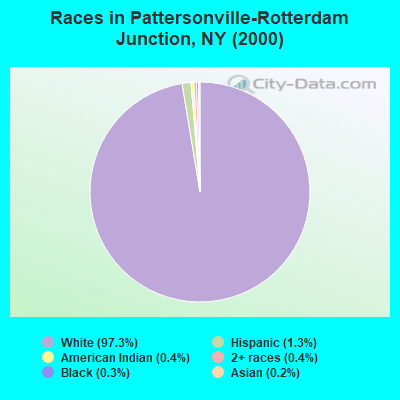
Race distribution in Pattersonville-Rotterdam Junction

- 89397.3%White alone
- 121.3%Hispanic
- 40.4%Two or more races
- 40.4%American Indian alone
- 30.3%Black alone
- 20.2%Asian alone
2000
2022
-
- 11,760,98162.0%White alone
- 2,867,58315.1%Hispanic
- 2,812,62314.8%Black alone
- 1,035,9265.5%Asian alone
- 366,1161.9%Two or more races
- 75,4990.4%Other race alone
- 52,4990.3%American Indian alone
- 5,2300.03%Native Hawaiian and Other
Pacific Islander alone

-
- 10,408,93352.9%White alone
- 3,867,29919.7%Hispanic
- 2,633,84013.4%Black alone
- 1,776,2869.0%Asian alone
- 732,6703.7%Two or more races
- 216,1101.1%Other race alone
- 35,0820.2%American Indian alone
- 6,9310.04%Native Hawaiian and Other
Pacific Islander alone

Income and house value in Pattersonville-Rotterdam Junction
- Median household income in 2022
- $80,467White non-Hispanic householders
- Median 2022 house value
- $256,061White Non-Hispanic householders
Household income for White non-Hispanic householders

Foreign-born residents in Pattersonville-Rotterdam Junction
6 residents are foreign born
| This city: | 0.7% |
| New York: | 20.4% |
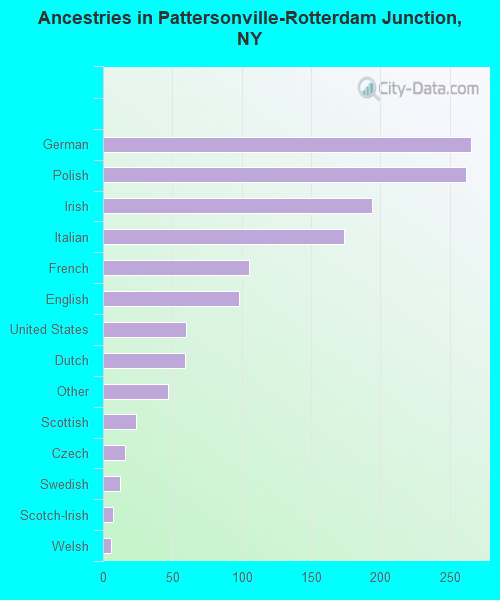
Ancestries in Pattersonville-Rotterdam Junction

- 26519.9%German
- 26219.7%Polish
- 19414.6%Irish
- 17413.1%Italian
- 1057.9%French
- 987.4%English
- 604.5%United States
- 594.4%Dutch
- 473.5%Other
- 241.8%Scottish
- 161.2%Czech
- 120.9%Swedish
- 70.5%Scotch-Irish
- 60.5%Welsh
Zip codes: 12150.