Races in New Baltimore, New York (NY) Detailed Stats
Ancestries, Foreign-born residents, place of birth

Recent posts about races in New Baltimore, New York on our local forum with over 2,400,000 registered users:
 | smaller Upstate NY cities and towns/African American communities (6005 replies) |
3.0% of New Baltimore, NY residents are foreign-born (2.0% born in Europe, 0.6% born in North America), which is 644.3% less than the foreign-born rate of 22.0% across the entire state of New York.
Race distribution in New Baltimore

- 3,29396.4%White alone
- 551.6%Hispanic
- 260.8%Two or more races
- 230.7%Black alone
- 130.4%Asian alone
- 30.09%Other race alone
- 30.09%American Indian alone
- 10.03%Native Hawaiian and Other
Pacific Islander alone

2000
2022
-
- 11,760,98162.0%White alone
- 2,867,58315.1%Hispanic
- 2,812,62314.8%Black alone
- 1,035,9265.5%Asian alone
- 366,1161.9%Two or more races
- 75,4990.4%Other race alone
- 52,4990.3%American Indian alone
- 5,2300.03%Native Hawaiian and Other
Pacific Islander alone

-
- 10,408,93352.9%White alone
- 3,867,29919.7%Hispanic
- 2,633,84013.4%Black alone
- 1,776,2869.0%Asian alone
- 732,6703.7%Two or more races
- 216,1101.1%Other race alone
- 35,0820.2%American Indian alone
- 6,9310.04%Native Hawaiian and Other
Pacific Islander alone

Income and house value in New Baltimore
- Median household income in 2022
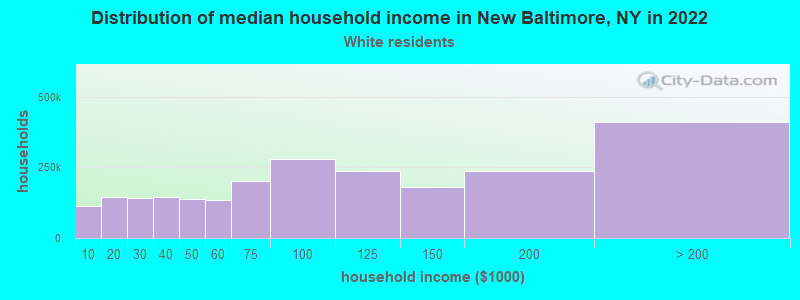
- $86,716White non-Hispanic householders
- $75,892Some other race householders
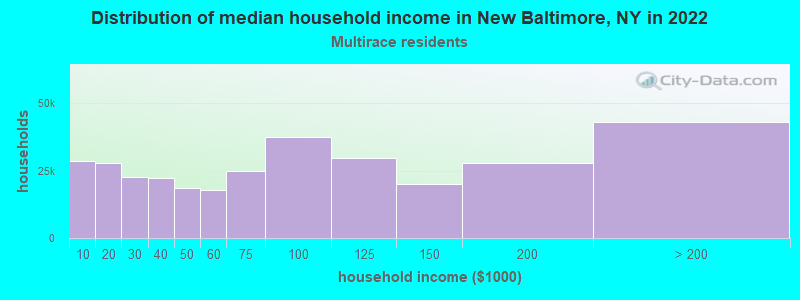
- $68,166Two or more races householders
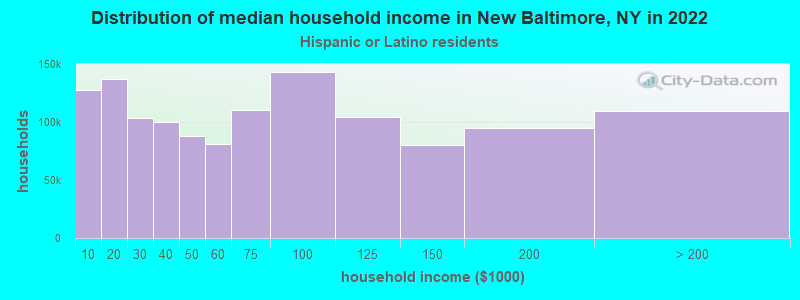
- $120,023Hispanic or Latino race householders
- Median 2022 house value
- $258,243White Non-Hispanic householders
- $117,146Two or more races householders
Household income for White non-Hispanic householders
Household income for Two or more races householders
Household income for Hispanic or Latino race householders
Foreign-born residents in New Baltimore
101 residents are foreign born (2.0% Europe, 0.6% North America).
| This city: | 3.0% |
| New York: | 20.4% |
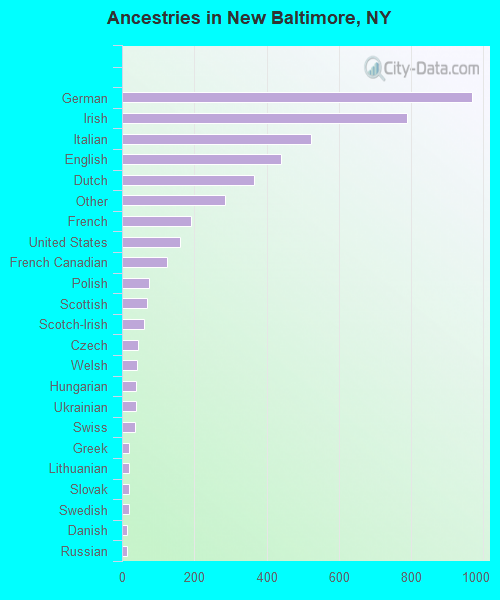
Ancestries in New Baltimore

- 96722.2%German
- 78918.1%Irish
- 52312.0%Italian
- 44010.1%English
- 3658.4%Dutch
- 2846.5%Other
- 1914.4%French
- 1613.7%United States
- 1252.9%French Canadian
- 741.7%Polish
- 681.6%Scottish
- 621.4%Scotch-Irish
- 451.0%Czech
- 421.0%Welsh
- 390.9%Hungarian
- 380.9%Ukrainian
- 370.8%Swiss
- 190.4%Greek
- 180.4%Lithuanian
- 180.4%Slovak
- 180.4%Swedish
- 150.3%Danish
- 140.3%Russian
- 80.2%West Indian
- 50.1%Norwegian
Zip codes: 12087.