Races in Lumberland, New York (NY) Detailed Stats
Ancestries, Foreign-born residents, place of birth
15.2% of Lumberland, NY residents are foreign-born (13.2% born in Europe), which is 44.6% less than the foreign-born rate of 22.0% across the entire state of New York.
Race distribution in Lumberland

- 1,85395.6%White alone
- 371.9%Hispanic
- 180.9%Two or more races
- 160.8%Asian alone
- 60.3%Other race alone
- 40.2%Black alone
- 30.2%Native Hawaiian and Other
Pacific Islander alone - 20.1%American Indian alone

2000
2022
-
- 11,760,98162.0%White alone
- 2,867,58315.1%Hispanic
- 2,812,62314.8%Black alone
- 1,035,9265.5%Asian alone
- 366,1161.9%Two or more races
- 75,4990.4%Other race alone
- 52,4990.3%American Indian alone
- 5,2300.03%Native Hawaiian and Other
Pacific Islander alone

-
- 10,408,93352.9%White alone
- 3,867,29919.7%Hispanic
- 2,633,84013.4%Black alone
- 1,776,2869.0%Asian alone
- 732,6703.7%Two or more races
- 216,1101.1%Other race alone
- 35,0820.2%American Indian alone
- 6,9310.04%Native Hawaiian and Other
Pacific Islander alone

Income and house value in Lumberland
- Median household income in 2022
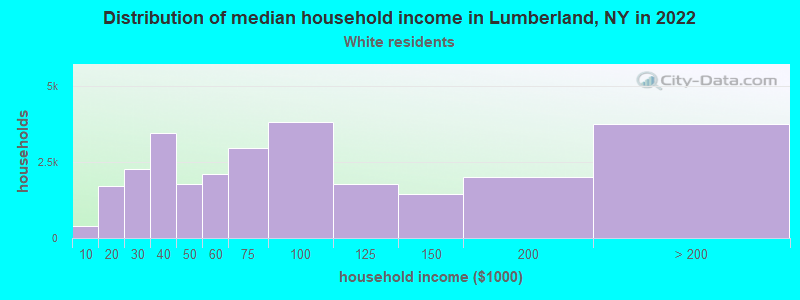
- $75,897White non-Hispanic householders
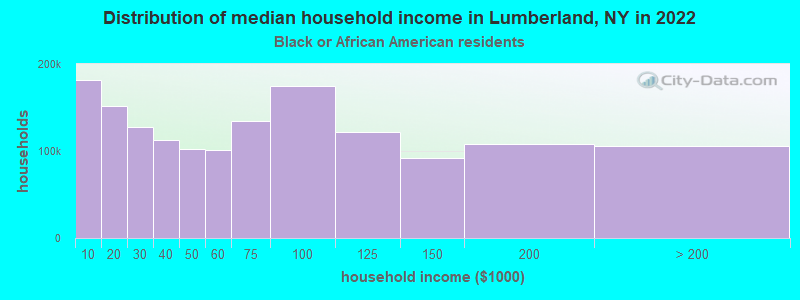
- $154,060Black householders
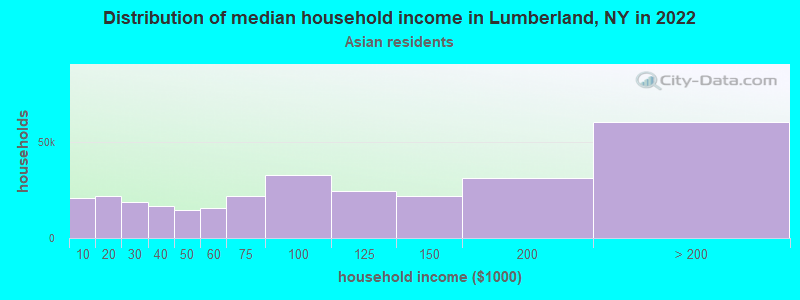
- $69,815Asian householders
- $85,905Some other race householders
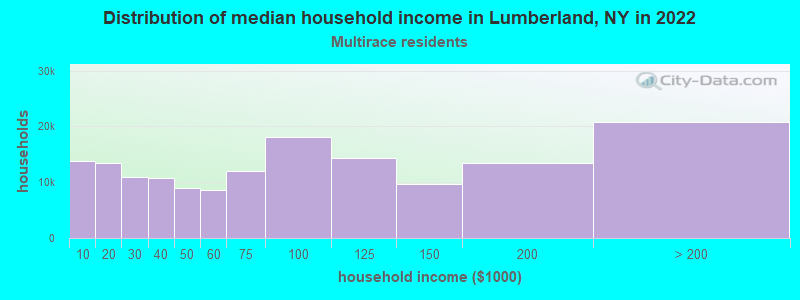
- $22,455Two or more races householders
- $95,046Hispanic or Latino race householders
- Median 2022 house value
- $327,996White Non-Hispanic householders
- $569,966Black or African American householders
- $341,980Asian householders
- $683,960Native Hawaiian and other Pacific Islander householders
- $417,975Some other race householders
- $227,986Two or more races householders
- $311,581Hispanic or Latino householders
Household income for White non-Hispanic householders
Household income for Black householders
Household income for Asian householders
Household income for Native Hawaiian and other Pacific Islander householders

Household income for Two or more races householders
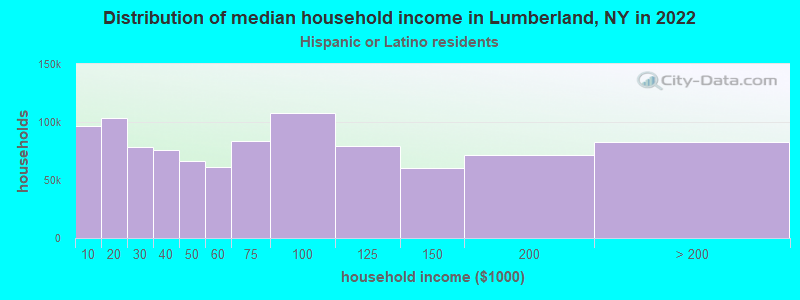
Household income for Hispanic or Latino race householders
Foreign-born residents in Lumberland
295 residents are foreign born (13.2% Europe).
| This city: | 15.2% |
| New York: | 20.4% |
Ancestries in Lumberland

- 47221.4%German
- 37116.8%Irish
- 2199.9%Ukrainian
- 1938.8%Italian
- 1938.8%Other
- 1547.0%English
- 1285.8%Polish
- 833.8%French
- 803.6%Dutch
- 783.5%United States
- 462.1%Russian
- 301.4%Scottish
- 301.4%Welsh
- 271.2%Swedish
- 190.9%French Canadian
- 190.9%Scotch-Irish
- 190.9%Slovak
- 170.8%Hungarian
- 110.5%Czech
- 80.4%Norwegian
- 30.1%Lithuanian
- 20.09%Danish
- 10.05%Swiss

Zip codes: 12737.