Races in Lincklaen, New York (NY) Detailed Stats
Ancestries, Foreign-born residents, place of birth

Recent posts about races in Lincklaen, New York on our local forum with over 2,400,000 registered users:
 | Ideas for the economic growth and quality of life in Syracuse (379 replies) |
| Areas close to Syracuse with lovely downtowns (45 replies) |
| Chittenango and tourism..... (27 replies) |
| Advice for young family relocating from Brooklyn (119 replies) |
| Considering a move to Syracuse (98 replies) |
| Kil Kar or Kin Kar Inn or something like that (3 replies) |
Latest news about races in Lincklaen, NY collected exclusively by city-data.com from local newspapers, TV, and radio stations
Race distribution in Lincklaen

- 40396.9%White alone
- 41.0%Hispanic
- 30.7%Black alone
- 30.7%American Indian alone
- 20.5%Two or more races
- 10.2%Asian alone

2000
2022
-
- 11,760,98162.0%White alone
- 2,867,58315.1%Hispanic
- 2,812,62314.8%Black alone
- 1,035,9265.5%Asian alone
- 366,1161.9%Two or more races
- 75,4990.4%Other race alone
- 52,4990.3%American Indian alone
- 5,2300.03%Native Hawaiian and Other
Pacific Islander alone

-
- 10,408,93352.9%White alone
- 3,867,29919.7%Hispanic
- 2,633,84013.4%Black alone
- 1,776,2869.0%Asian alone
- 732,6703.7%Two or more races
- 216,1101.1%Other race alone
- 35,0820.2%American Indian alone
- 6,9310.04%Native Hawaiian and Other
Pacific Islander alone

Income and house value in Lincklaen
- Median household income in 2022
- $54,891White non-Hispanic householders
- $121,008American Indian and Alaska Native householders
- $33,914Two or more races householders
- Median 2022 house value
- $126,239White Non-Hispanic householders
- $119,093American Indian or Alaska Native householders
Household income for White non-Hispanic householders

Household income for American Indian and Alaska Native householders

Household income for Two or more races householders

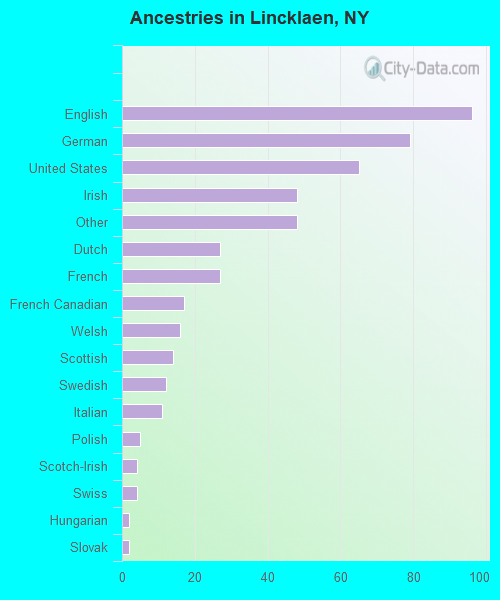
Ancestries in Lincklaen

- 9620.1%English
- 7916.6%German
- 6513.6%United States
- 4810.1%Irish
- 4810.1%Other
- 275.7%Dutch
- 275.7%French
- 173.6%French Canadian
- 163.4%Welsh
- 142.9%Scottish
- 122.5%Swedish
- 112.3%Italian
- 51.0%Polish
- 40.8%Scotch-Irish
- 40.8%Swiss
- 20.4%Hungarian
- 20.4%Slovak
Zip codes: 13052.