Races in Langley Park, Maryland (MD) Detailed Stats
Data:
Races - White alone (%)
Races - White alone (% change since 2000)
Races - Black alone (%)
Races - Black alone (% change since 2000)
Races - American Indian alone (%)
Races - American Indian alone (% change since 2000)
Races - Asian alone (%)
Races - Asian alone (% change since 2000)
Races - Hispanic (%)
Races - Hispanic (% change since 2000)
Races - Native Hawaiian and Other Pacific Islander alone (%)
Races - Native Hawaiian and Other Pacific Islander alone (% change since 2000)
Races - Two or more races(%)
Races - Two or more races(% change since 2000)
Races - Other race alone (%)
Races - Other race alone (% change since 2000)
Racial diversity
Place of birth - Born in state of residence (%)
Place of birth - Born in state of residence (%) - White
Place of birth - Born in state of residence (%) - Black or African American
Place of birth - Born in state of residence (%) - Asian
Place of birth - Born in state of residence (%) - Hispanic or Latino
Place of birth - Born in state of residence (%) - American Indian and Alaska Native
Place of birth - Born in state of residence (%) - Multirace
Place of birth - Born in state of residence (%) - Other Race
Place of birth - Born in other state (%)
Place of birth - Born in other state (%) - White
Place of birth - Born in other state (%) - Black or African American
Place of birth - Born in other state (%) - Asian
Place of birth - Born in other state (%) - Hispanic or Latino
Place of birth - Born in other state (%) - American Indian and Alaska Native
Place of birth - Born in other state (%) - Multirace
Place of birth - Born in other state (%) - Other Race
Place of birth - Native, outside of US (%)
Place of birth - Native, outside of US (%) - White
Place of birth - Native, outside of US (%) - Black or African American
Place of birth - Native, outside of US (%) - Asian
Place of birth - Native, outside of US (%) - Hispanic or Latino
Place of birth - Native, outside of US (%) - American Indian and Alaska Native
Place of birth - Native, outside of US (%) - Multirace
Place of birth - Native, outside of US (%) - Other Race
Place of birth - Foreign born (%)
Place of birth - Foreign born (%) - White
Place of birth - Foreign born (%) - Black or African American
Place of birth - Foreign born (%) - Asian
Place of birth - Foreign born (%) - Hispanic or Latino
Place of birth - Foreign born (%) - American Indian and Alaska Native
Place of birth - Foreign born (%) - Multirace
Place of birth - Foreign born (%) - Other Race
Residents speaking English at home (%)
Residents speaking English at home - Born in the United States (%)
Residents speaking English at home - Native, born elsewhere (%)
Residents speaking English at home - Foreign born (%)
Residents speaking Spanish at home (%)
Residents speaking Spanish at home - Born in the United States (%)
Residents speaking Spanish at home - Native, born elsewhere (%)
Residents speaking Spanish at home - Foreign born (%)
Residents speaking other language at home (%)
Residents speaking other language at home - Born in the United States (%)
Residents speaking other language at home - Native, born elsewhere (%)
Residents speaking other language at home - Foreign born (%)
Marital status - Never married (%)
Marital status - Now married (%)
Marital status - Separated (%)
Marital status - Widowed (%)
Marital status - Divorced (%)
Ancestries Reported - Arab (%)
Ancestries Reported - Czech (%)
Ancestries Reported - Danish (%)
Ancestries Reported - Dutch (%)
Ancestries Reported - English (%)
Ancestries Reported - French (%)
Ancestries Reported - French Canadian (%)
Ancestries Reported - German (%)
Ancestries Reported - Greek (%)
Ancestries Reported - Hungarian (%)
Ancestries Reported - Irish (%)
Ancestries Reported - Italian (%)
Ancestries Reported - Lithuanian (%)
Ancestries Reported - Norwegian (%)
Ancestries Reported - Polish (%)
Ancestries Reported - Portuguese (%)
Ancestries Reported - Russian (%)
Ancestries Reported - Scotch-Irish (%)
Ancestries Reported - Scottish (%)
Ancestries Reported - Slovak (%)
Ancestries Reported - Subsaharan African (%)
Ancestries Reported - Swedish (%)
Ancestries Reported - Swiss (%)
Ancestries Reported - Ukrainian (%)
Ancestries Reported - United States (%)
Ancestries Reported - Welsh (%)
Ancestries Reported - West Indian (%)
Ancestries Reported - Other (%)
Geographical mobility - Same house 1 year ago (%)
Geographical mobility - Same house 1 year ago (%) - White
Geographical mobility - Same house 1 year ago (%) - Black or African American
Geographical mobility - Same house 1 year ago (%) - Asian
Geographical mobility - Same house 1 year ago (%) - Hispanic or Latino
Geographical mobility - Same house 1 year ago (%) - American Indian and Alaska Native
Geographical mobility - Same house 1 year ago (%) - Multirace
Geographical mobility - Same house 1 year ago (%) - Other Race
Geographical mobility - Moved within same county (%)
Geographical mobility - Moved within same county (%) - White
Geographical mobility - Moved within same county (%) - Black or African American
Geographical mobility - Moved within same county (%) - Asian
Geographical mobility - Moved within same county (%) - Hispanic or Latino
Geographical mobility - Moved within same county (%) - American Indian and Alaska Native
Geographical mobility - Moved within same county (%) - Multirace
Geographical mobility - Moved within same county (%) - Other Race
Geographical mobility - Moved from different county within same state (%)
Geographical mobility - Moved from different county within same state (%) - White
Geographical mobility - Moved from different county within same state (%) - Black or African American
Geographical mobility - Moved from different county within same state (%) - Asian
Geographical mobility - Moved from different county within same state (%) - Hispanic or Latino
Geographical mobility - Moved from different county within same state (%) - American Indian and Alaska Native
Geographical mobility - Moved from different county within same state (%) - Multirace
Geographical mobility - Moved from different county within same state (%) - Other Race
Geographical mobility - Moved from different state (%)
Geographical mobility - Moved from different state (%) - White
Geographical mobility - Moved from different state (%) - Black or African American
Geographical mobility - Moved from different state (%) - Asian
Geographical mobility - Moved from different state (%) - Hispanic or Latino
Geographical mobility - Moved from different state (%) - American Indian and Alaska Native
Geographical mobility - Moved from different state (%) - Multirace
Geographical mobility - Moved from different state (%) - Other Race
Geographical mobility - Moved from abroad (%)
Geographical mobility - Moved from abroad (%) - White
Geographical mobility - Moved from abroad (%) - Black or African American
Geographical mobility - Moved from abroad (%) - Asian
Geographical mobility - Moved from abroad (%) - Hispanic or Latino
Geographical mobility - Moved from abroad (%) - American Indian and Alaska Native
Geographical mobility - Moved from abroad (%) - Multirace
Geographical mobility - Moved from abroad (%) - Other Race
Place of birth for the foreign-born population - Ireland (%)
Place of birth for the foreign-born population - Denmark (%)
Place of birth for the foreign-born population - Norway (%)
Place of birth for the foreign-born population - Sweden (%)
Place of birth for the foreign-born population - United Kingdom (%)
Place of birth for the foreign-born population - England (%)
Place of birth for the foreign-born population - Scotland (%)
Place of birth for the foreign-born population - Other Northern Europe (%)
Place of birth for the foreign-born population - Austria (%)
Place of birth for the foreign-born population - Belgium (%)
Place of birth for the foreign-born population - France (%)
Place of birth for the foreign-born population - Germany (%)
Place of birth for the foreign-born population - Netherlands (%)
Place of birth for the foreign-born population - Switzerland (%)
Place of birth for the foreign-born population - Other Western Europe (%)
Place of birth for the foreign-born population - Greece (%)
Place of birth for the foreign-born population - Italy (%)
Place of birth for the foreign-born population - Portugal (%)
Place of birth for the foreign-born population - Spain (%)
Place of birth for the foreign-born population - Other Southern Europe (%)
Place of birth for the foreign-born population - Albania (%)
Place of birth for the foreign-born population - Belarus (%)
Place of birth for the foreign-born population - Bosnia and Herzegovina (%)
Place of birth for the foreign-born population - Bulgaria (%)
Place of birth for the foreign-born population - Croatia (%)
Place of birth for the foreign-born population - Czechoslovakia (%)
Place of birth for the foreign-born population - Hungary (%)
Place of birth for the foreign-born population - Latvia (%)
Place of birth for the foreign-born population - Lithuania (%)
Place of birth for the foreign-born population - North Macedonia (Macedonia) (%)
Place of birth for the foreign-born population - Moldova (%)
Place of birth for the foreign-born population - Poland (%)
Place of birth for the foreign-born population - Romania (%)
Place of birth for the foreign-born population - Russia (%)
Place of birth for the foreign-born population - Serbia (%)
Place of birth for the foreign-born population - Ukraine (%)
Place of birth for the foreign-born population - Other Eastern Europe (%)
Place of birth for the foreign-born population - China (%)
Place of birth for the foreign-born population - Hong Kong (%)
Place of birth for the foreign-born population - Taiwan (%)
Place of birth for the foreign-born population - Japan (%)
Place of birth for the foreign-born population - Korea (%)
Place of birth for the foreign-born population - Other Eastern Asia (%)
Place of birth for the foreign-born population - Afghanistan (%)
Place of birth for the foreign-born population - Bangladesh (%)
Place of birth for the foreign-born population - India (%)
Place of birth for the foreign-born population - Iran (%)
Place of birth for the foreign-born population - Kazakhstan (%)
Place of birth for the foreign-born population - Nepal (%)
Place of birth for the foreign-born population - Pakistan (%)
Place of birth for the foreign-born population - Sri Lanka (%)
Place of birth for the foreign-born population - Uzbekistan (%)
Place of birth for the foreign-born population - Other South Central Asia (%)
Place of birth for the foreign-born population - Burma (%)
Place of birth for the foreign-born population - Cambodia (%)
Place of birth for the foreign-born population - Indonesia (%)
Place of birth for the foreign-born population - Laos (%)
Place of birth for the foreign-born population - Malaysia (%)
Place of birth for the foreign-born population - Philippines (%)
Place of birth for the foreign-born population - Singapore (%)
Place of birth for the foreign-born population - Thailand (%)
Place of birth for the foreign-born population - Vietnam (%)
Place of birth for the foreign-born population - Other South Eastern Asia (%)
Place of birth for the foreign-born population - Armenia (%)
Place of birth for the foreign-born population - Iraq (%)
Place of birth for the foreign-born population - Israel (%)
Place of birth for the foreign-born population - Jordan (%)
Place of birth for the foreign-born population - Kuwait (%)
Place of birth for the foreign-born population - Lebanon (%)
Place of birth for the foreign-born population - Saudi Arabia (%)
Place of birth for the foreign-born population - Syria (%)
Place of birth for the foreign-born population - Turkey (%)
Place of birth for the foreign-born population - Yemen (%)
Place of birth for the foreign-born population - Other Western Asia (%)
Place of birth for the foreign-born population - Eritrea (%)
Place of birth for the foreign-born population - Ethiopia (%)
Place of birth for the foreign-born population - Kenya (%)
Place of birth for the foreign-born population - Somalia (%)
Place of birth for the foreign-born population - Uganda (%)
Place of birth for the foreign-born population - Zimbabwe (%)
Place of birth for the foreign-born population - Other Eastern Africa (%)
Place of birth for the foreign-born population - Cameroon (%)
Place of birth for the foreign-born population - Congo (%)
Place of birth for the foreign-born population - Democratic Republic of Congo (Zaire) (%)
Place of birth for the foreign-born population - Other Middle Africa (%)
Place of birth for the foreign-born population - Egypt (%)
Place of birth for the foreign-born population - Morocco (%)
Place of birth for the foreign-born population - Sudan (%)
Place of birth for the foreign-born population - Other Northern Africa (%)
Place of birth for the foreign-born population - South Africa (%)
Place of birth for the foreign-born population - Other Southern Africa (%)
Place of birth for the foreign-born population - Cabo Verde (%)
Place of birth for the foreign-born population - Ghana (%)
Place of birth for the foreign-born population - Liberia (%)
Place of birth for the foreign-born population - Nigeria (%)
Place of birth for the foreign-born population - Senegal (%)
Place of birth for the foreign-born population - Sierra Leone (%)
Place of birth for the foreign-born population - Other Western Africa (%)
Place of birth for the foreign-born population - Australia (%)
Place of birth for the foreign-born population - New Zealand (%)
Place of birth for the foreign-born population - Fiji (%)
Place of birth for the foreign-born population - Micronesia (%)
Place of birth for the foreign-born population - Bahamas (%)
Place of birth for the foreign-born population - Barbados (%)
Place of birth for the foreign-born population - Cuba (%)
Place of birth for the foreign-born population - Dominica (%)
Place of birth for the foreign-born population - Dominican Republic (%)
Place of birth for the foreign-born population - Grenada (%)
Place of birth for the foreign-born population - Haiti (%)
Place of birth for the foreign-born population - Jamaica (%)
Place of birth for the foreign-born population - St. Vincent and the Grenadines (%)
Place of birth for the foreign-born population - Trinidad and Tobago (%)
Place of birth for the foreign-born population - West Indies (%)
Place of birth for the foreign-born population - Other Caribbean (%)
Place of birth for the foreign-born population - Belize (%)
Place of birth for the foreign-born population - Costa Rica (%)
Place of birth for the foreign-born population - El Salvador (%)
Place of birth for the foreign-born population - Guatemala (%)
Place of birth for the foreign-born population - Honduras (%)
Place of birth for the foreign-born population - Mexico (%)
Place of birth for the foreign-born population - Nicaragua (%)
Place of birth for the foreign-born population - Panama (%)
Place of birth for the foreign-born population - Other Central America (%)
Place of birth for the foreign-born population - Argentina (%)
Place of birth for the foreign-born population - Bolivia (%)
Place of birth for the foreign-born population - Brazil (%)
Place of birth for the foreign-born population - Chile (%)
Place of birth for the foreign-born population - Colombia (%)
Place of birth for the foreign-born population - Ecuador (%)
Place of birth for the foreign-born population - Guyana (%)
Place of birth for the foreign-born population - Peru (%)
Place of birth for the foreign-born population - Uruguay (%)
Place of birth for the foreign-born population - Venezuela (%)
Place of birth for the foreign-born population - Other South America (%)
Place of birth for the foreign-born population - Canada (%)
Place of birth for the foreign-born population - Other Northern America (%)
Place of birth for the foreign-born population - Other (%)
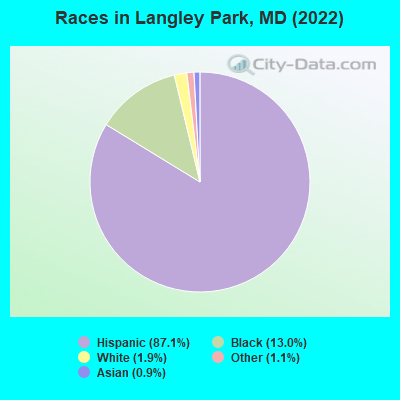
According to 2022 data, the most numerous races in Langley Park, MD are White alone (408 residents), Black alone (2,796 residents), and Hispanic (18,771 residents). 11.9% of Langley Park residents speak English at home. 70.0% of Langley Park, MD residents are foreign-born (58.5% born in Latin America), which is 77.2% greater than the foreign-born rate of 16.0% across the entire state of Maryland.
Race distribution in Langley Park
2000 2022
3,286,547 62.1% White alone 1,464,735 27.7% Black alone 227,916 4.3% Hispanic 209,738 4.0% Asian alone 82,946 1.6% Two or more races 13,312 0.3% American Indian alone 9,379 0.2% Other race alone 1,913 0.04% Native Hawaiian and Other
2,906,492 47.1% White alone 1,800,914 29.2% Black alone 705,842 11.4% Hispanic 401,818 6.5% Asian alone 291,317 4.7% Two or more races 46,930 0.8% Other race alone 8,930 0.1% American Indian alone 2,417 0.04% Native Hawaiian and Other
Income and house value in Langley Park Median household income in 2022 $84,218 White non-Hispanic householders$82,208 Black householders$60,238 Asian householders$67,685 Some other race householders$70,221 Hispanic or Latino race householdersMedian 2022 house value $384,310 White Non-Hispanic householders$374,878 Black or African American householders $370,313 Asian householders$389,787 Some other race householders$385,528 Two or more races householders$383,093 Hispanic or Latino householders
Median age by race in Langley Park
36.5 Median age for White residents33.6 43.0 36.6 Median age for Black or African American residents35.0 41.3 3.3 Median age for American Indian / Alaska Native residents3.6 -689,905,591.2 40.7 Median age for Asian residents39.1 26.3 -571,600,480.8 Median age for Native Hawaiian / Pacific Islander residents-720,061,021.4 -760,942,760.2 26.7 Median age for Other race residents27.4 24.8 20.0 Median age for Two or more races residents17.9 28.8 42.3 Median age for White alone residents32.2 41.8 27.4 Median age for Hispanic or Latino residents28.9 24.7
Owner/renter occupied households by race in Langley Park
House owners and renters - White residents 153 44.5% Owner occupied190 55.5% Renter occupiedHouse owners and renters - Black or African American residents 394 47.0% Owner occupied444 53.0% Renter occupiedHouse owners and renters - Asian residents 64 53.8% Owner occupied55 46.2% Renter occupiedHouse owners and renters - Other race residents 585 13.0% Owner occupied3,908 87.0% Renter occupiedHouse owners and renters - Two or more races residents 42 28.8% Owner occupied102 71.2% Renter occupiedHouse owners and renters - White alone residents 122 57.9% Owner occupied89 42.1% Renter occupiedHouse owners and renters - Hispanic or Latino residents 658 14.1% Owner occupied4,000 85.9% Renter occupied
Language usage in Langley Park
English speakers - Total 11.9% of residents of Langley Park speak English at home.
84.0% of residents speak Spanish at home 3,235 20.1% Speak English very well12,820 79.9% Speak English less than very well8.3% of residents speak other language at home 706 44.6% Speak English very well878 55.4% Speak English less than very well
English speakers - Born in the United States 37.5% of residents of Langley Park speak English at home.
60.6% of residents speak Spanish at home 858 78.2% Speak English very well239 21.8% Speak English less than very well5.2% of residents speak other language at home 32 34.0% Speak English very well62 66.0% Speak English less than very well
English speakers - Native, born elsewhere 31.4% of residents of Langley Park speak English at home.
60.4% of residents speak Spanish at home 6 6.2% Speak English very well90 93.8% Speak English less than very well23.3% of residents speak other language at home 13 35.1% Speak English very well24 64.9% Speak English less than very well
English speakers - Foreign-born 6.3% of residents of Langley Park speak English at home.
82.4% of residents speak Spanish at home 755 6.0% Speak English very well11,743 94.0% Speak English less than very well9.0% of residents speak other language at home 593 43.5% Speak English very well770 56.5% Speak English less than very well
White (Caucasian) - Speak only English Native:
58.4% (258)Foreign-born:
5.9% (16)
White (Caucasian) - Speak another language Native:
38.7% (171)Foreign-born:
87.0% (241)
Black or African American - Speak only English Native:
79.1% (730)Foreign-born:
33.5% (657)
Black or African American - Speak another language Native:
23.4% (216)Foreign-born:
67.0% (1,312)
Asian - Speak only English Native:
25.3% (26)Foreign-born:
11.3% (21)
Asian - Speak another language Native:
83.0% (87)Foreign-born:
88.1% (164)
Other race - Speak only English Native:
5.9% (211)Foreign-born:
1.4% (162)
Other race - Speak another language Native:
92.5% (3,309)Foreign-born:
98.9% (11,848)
Two or more races - Speak only English Native:
92.0% (275)Foreign-born:
7.4% (46)
Two or more races - Speak another language Native:
6.6% (20)Foreign-born:
95.9% (598)
White alone - Speak only English Native:
78.9% (238)Foreign-born:
16.9% (18)
White alone - Speak another language Native:
24.6% (74)Foreign-born:
82.3% (89)
Hispanic or Latino - Speak only English Native:
12.6% (497)Foreign-born:
1.6% (205)
Hispanic or Latino - Speak another language Native:
86.5% (3,409)Foreign-born:
98.8% (12,428)
Foreign-born residents in Langley Park 15,089 residents are foreign born (58.5% Latin America ).
This city:
70.0%Maryland:
15.7%
Marital status for residents in Langley Park Marital status - White (Caucasian) population 15 years and over
Males 52.7% Never married28.6% Now married8.7% Separated0.0% Widowed10.1% DivorcedFemales 39.3% Never married33.5% Now married2.2% Separated12.0% Widowed13.0% DivorcedWomen who did not give birth in the past 12 months Now married:
45.3% (84)Unmarried:
54.7% (101)
Marital status - Black or African American population 15 years and over
Males 52.6% Never married33.5% Now married5.6% Separated1.5% Widowed6.9% DivorcedFemales 39.4% Never married40.8% Now married2.7% Separated9.2% Widowed7.9% DivorcedWomen who gave birth in the past 12 months Now married:
0.0% (0)Unmarried:
100.0% (10)
Women who did not give birth in the past 12 months Now married:
43.8% (230)Unmarried:
56.2% (295)
Marital status - Asian population 15 years and over
Males 53.8% Never married30.4% Now married0.0% Separated0.0% Widowed15.8% DivorcedFemales 47.3% Never married35.7% Now married0.0% Separated17.0% Widowed0.0% DivorcedWomen who did not give birth in the past 12 months Now married:
44.9% (33)Unmarried:
55.1% (41)
Marital status - Other race population 15 years and over
Males 78.6% Never married19.8% Now married0.0% Separated0.0% Widowed1.6% DivorcedFemales 66.6% Never married22.9% Now married2.3% Separated4.1% Widowed4.0% DivorcedWomen who gave birth in the past 12 months Now married:
27.3% (110)Unmarried:
72.7% (293)
Women who did not give birth in the past 12 months Now married:
23.1% (850)Unmarried:
76.9% (2,834)
Marital status - Two or more races population 15 years and over
Males 45.1% Never married47.0% Now married0.0% Separated0.0% Widowed8.0% DivorcedFemales 52.1% Never married41.6% Now married0.0% Separated0.0% Widowed6.4% DivorcedWomen who gave birth in the past 12 months Now married:
100.0% (17)Unmarried:
0.0% (0)
Women who did not give birth in the past 12 months Now married:
16.9% (28)Unmarried:
83.1% (139)
Marital status - White alone, not Hispanic / Latino population 15 years and over
Males 61.9% Never married21.1% Now married1.5% Separated0.0% Widowed15.5% DivorcedFemales 26.9% Never married34.5% Now married0.0% Separated11.2% Widowed27.4% DivorcedWomen who did not give birth in the past 12 months Now married:
43.6% (42)Unmarried:
56.4% (54)
Marital status - Hispanic or Latino population 15 years and over
Males 75.6% Never married21.6% Now married0.4% Separated0.0% Widowed2.4% DivorcedFemales 65.2% Never married24.3% Now married2.3% Separated4.3% Widowed3.9% DivorcedWomen who gave birth in the past 12 months Now married:
30.2% (118)Unmarried:
69.8% (274)
Women who did not give birth in the past 12 months Now married:
23.8% (886)Unmarried:
76.2% (2,830)
Ancestries in Langley Park
328 1.8% Jamaican106 0.6% Ethiopian101 0.5% American100 0.5% Nigerian97 0.5% British West Indian85 0.5% Trinidadian and Tobagonian26 0.1% Moroccan25 0.1% Sierra Leonean16 0.09% Turkish15 0.08% French15 0.08% German12 0.06% Lithuanian12 0.06% Haitian9 0.05% African5 0.03% Barbadian3 0.02% Greek2 0.01% European1 0.01% English1 0.01% Irish
Children Nativity (place of birth) in Langley Park
Children under 6 years - Living with two parents Both parents foreign-born 736 84.9% Native130 15.1% Foreign-bornOne native, one foreign-born parent 46 100.0% NativeChildren under 6 years - Living with one parent Native parent 1 98.9% Foreign-bornForeign-born parent 2,224 89.8% Native253 10.2% Foreign-bornChildren 6 to 17 years - Living with two parents Both parents foreign-born 1,022 58.8% Native716 41.2% Foreign-bornOne native, one foreign-born parent 147 77.0% Native44 23.0% Foreign-bornChildren 6 to 17 years - Living with one parent Foreign-born parent 2,066 60.4% Native1,357 39.6% Foreign-born
Grandparents responsible for own grandchildren in Langley Park
Grandparents (30 to 59 years) White / Caucasian 12 100.0% Not responsible for grandchildrenBlack or African American 21 100.0% Not responsible for grandchildrenOther race 222 63.8% Responsible for grandchildren126 36.2% Not responsible for grandchildrenHispanic or Latino 208 57.2% Responsible for grandchildren156 42.8% Not responsible for grandchildrenGrandparents (60 years and over) White / Caucasian 7 100.0% Not responsible for grandchildrenBlack or African American 59 64.5% Responsible for grandchildren32 35.5% Not responsible for grandchildrenOther race 71 44.7% Responsible for grandchildren88 55.3% Not responsible for grandchildrenHispanic or Latino 62 36.0% Responsible for grandchildren111 64.0% Not responsible for grandchildren