Races in Hillsdale, New York (NY) Detailed Stats
Ancestries, Foreign-born residents, place of birth

Recent posts about races in Hillsdale, New York on our local forum with over 2,400,000 registered users:
 | Why don't we have a Hudson Valley forum? (67 replies) |
| Bought a house years ago, kinda regretting it (40 replies) |
| Traffic Jam Economics (33 replies) |
| Long Island - HELP finding place (10 replies) |
Latest news about races in Hillsdale, NY collected exclusively by city-data.com from local newspapers, TV, and radio stations
6.7% of Hillsdale, NY residents are foreign-born (4.8% born in Europe, 1.0% born in Latin America), which is 230.8% less than the foreign-born rate of 22.0% across the entire state of New York.
Race distribution in Hillsdale

- 1,69096.9%White alone
- 281.6%Hispanic
- 100.6%Black alone
- 80.5%Asian alone
- 60.3%Two or more races
- 20.1%Other race alone
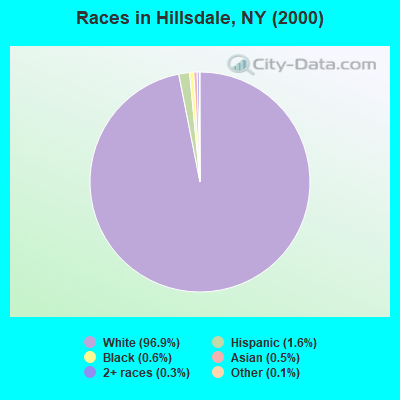
2000
2022
-
- 11,760,98162.0%White alone
- 2,867,58315.1%Hispanic
- 2,812,62314.8%Black alone
- 1,035,9265.5%Asian alone
- 366,1161.9%Two or more races
- 75,4990.4%Other race alone
- 52,4990.3%American Indian alone
- 5,2300.03%Native Hawaiian and Other
Pacific Islander alone

-
- 10,408,93352.9%White alone
- 3,867,29919.7%Hispanic
- 2,633,84013.4%Black alone
- 1,776,2869.0%Asian alone
- 732,6703.7%Two or more races
- 216,1101.1%Other race alone
- 35,0820.2%American Indian alone
- 6,9310.04%Native Hawaiian and Other
Pacific Islander alone

Income and house value in Hillsdale
- Median household income in 2022
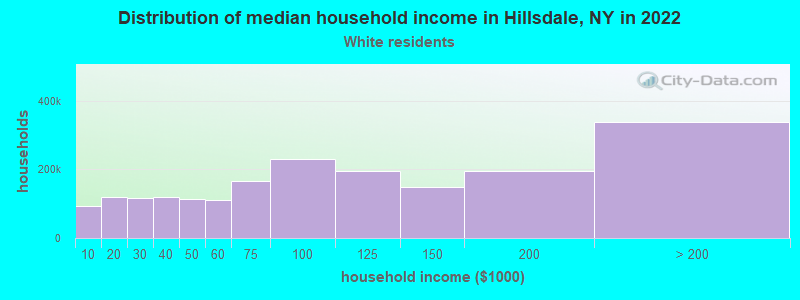
- $70,940White non-Hispanic householders
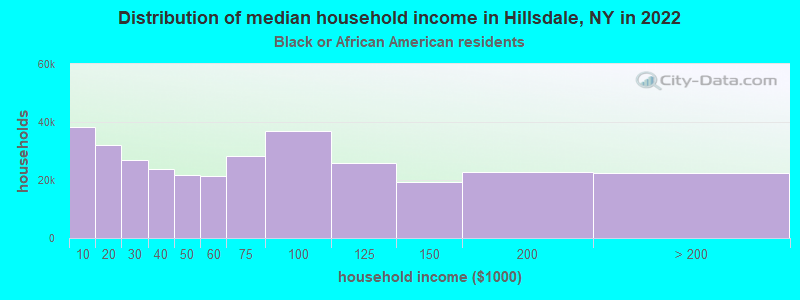
- $40,548Black householders
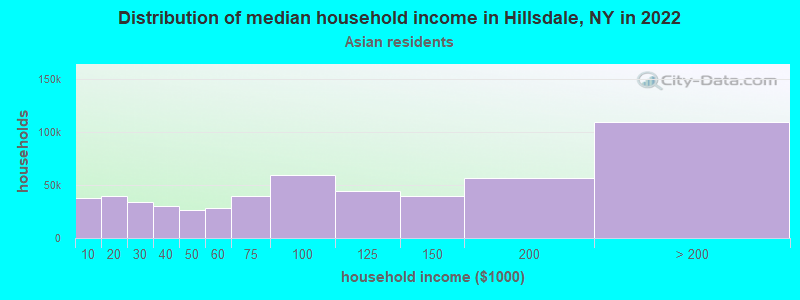
- $125,614Asian householders
- $133,379Some other race householders
- $91,308Two or more races householders
- $97,879Hispanic or Latino race householders
- Median 2022 house value
- $334,568White Non-Hispanic householders
- $432,173Black or African American householders
- $731,369Asian householders
- $432,173Hispanic or Latino householders
Household income for White non-Hispanic householders
Household income for Black householders
Household income for Asian householders
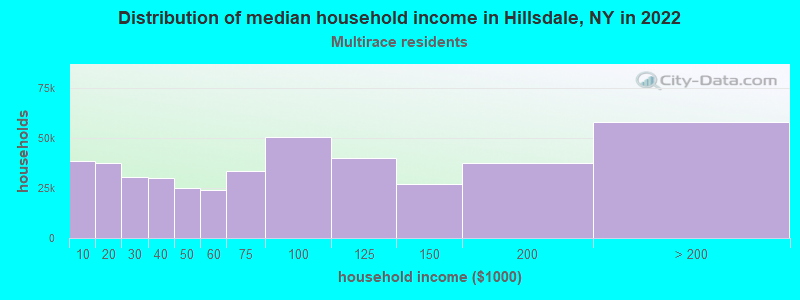
Household income for Two or more races householders
Household income for Hispanic or Latino race householders

Foreign-born residents in Hillsdale
116 residents are foreign born (4.8% Europe, 1.0% Latin America).
| This city: | 6.7% |
| New York: | 20.4% |
Ancestries in Hillsdale

- 33815.5%German
- 30313.9%Irish
- 26612.2%Italian
- 25311.6%English
- 1838.4%Other
- 1386.3%Polish
- 1054.8%Dutch
- 1044.8%French
- 843.8%United States
- 673.1%Scottish
- 592.7%Russian
- 502.3%Scotch-Irish
- 371.7%Swedish
- 331.5%French Canadian
- 321.5%Hungarian
- 311.4%Ukrainian
- 251.1%Norwegian
- 150.7%Swiss
- 130.6%Czech
- 90.4%Lithuanian
- 80.4%Welsh
- 70.3%Arab
- 70.3%Danish
- 70.3%Greek
- 50.2%Portuguese
- 30.1%Subsaharan African
- 20.09%Slovak

Zip codes: 12529.