Races in Hartland, New York (NY) Detailed Stats
Ancestries, Foreign-born residents, place of birth

Recent posts about races in Hartland, New York on our local forum with over 2,400,000 registered users:
 | smaller Upstate NY cities and towns/African American communities (6005 replies) |
1.7% of Hartland, NY residents are foreign-born , which is 1228.0% less than the foreign-born rate of 22.0% across the entire state of New York.
Race distribution in Hartland

- 4,05797.4%White alone
- 370.9%Two or more races
- 300.7%Hispanic
- 190.5%Black alone
- 130.3%American Indian alone
- 60.1%Asian alone
- 20.05%Native Hawaiian and Other
Pacific Islander alone - 10.02%Other race alone

2000
2022
-
- 11,760,98162.0%White alone
- 2,867,58315.1%Hispanic
- 2,812,62314.8%Black alone
- 1,035,9265.5%Asian alone
- 366,1161.9%Two or more races
- 75,4990.4%Other race alone
- 52,4990.3%American Indian alone
- 5,2300.03%Native Hawaiian and Other
Pacific Islander alone

-
- 10,408,93352.9%White alone
- 3,867,29919.7%Hispanic
- 2,633,84013.4%Black alone
- 1,776,2869.0%Asian alone
- 732,6703.7%Two or more races
- 216,1101.1%Other race alone
- 35,0820.2%American Indian alone
- 6,9310.04%Native Hawaiian and Other
Pacific Islander alone

Income and house value in Hartland
- Median household income in 2022
- $66,383White non-Hispanic householders
- $56,883Black householders
- $139,730American Indian and Alaska Native householders
- $110,468Two or more races householders
- $194,724Hispanic or Latino race householders
- Median 2022 house value
- $180,145White Non-Hispanic householders
- $203,621Native Hawaiian and other Pacific Islander householders
- $269,499Hispanic or Latino householders
Household income for White non-Hispanic householders

Household income for Black householders

Household income for American Indian and Alaska Native householders

Household income for Native Hawaiian and other Pacific Islander householders

Household income for Two or more races householders

Household income for Hispanic or Latino race householders

Foreign-born residents in Hartland
69 residents are foreign born
| This city: | 1.7% |
| New York: | 20.4% |
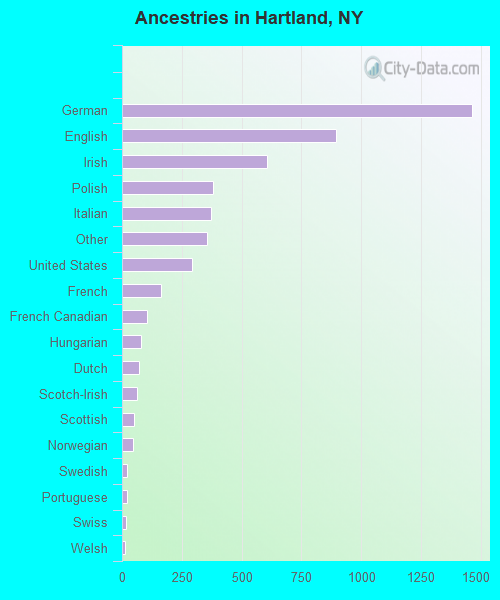
Ancestries in Hartland

- 1,46229.0%German
- 89717.8%English
- 60812.1%Irish
- 3817.6%Polish
- 3717.4%Italian
- 3567.1%Other
- 2925.8%United States
- 1643.3%French
- 1062.1%French Canadian
- 801.6%Hungarian
- 721.4%Dutch
- 631.3%Scotch-Irish
- 511.0%Scottish
- 470.9%Norwegian
- 220.4%Swedish
- 200.4%Portuguese
- 150.3%Swiss
- 140.3%Welsh
- 80.2%Ukrainian
- 70.1%Russian
Zip codes: 14067.