Races in Harriman, New York (NY) Detailed Stats
Data:
Races - White alone (%)
Races - White alone (% change since 2000)
Races - Black alone (%)
Races - Black alone (% change since 2000)
Races - American Indian alone (%)
Races - American Indian alone (% change since 2000)
Races - Asian alone (%)
Races - Asian alone (% change since 2000)
Races - Hispanic (%)
Races - Hispanic (% change since 2000)
Races - Native Hawaiian and Other Pacific Islander alone (%)
Races - Native Hawaiian and Other Pacific Islander alone (% change since 2000)
Races - Two or more races(%)
Races - Two or more races(% change since 2000)
Races - Other race alone (%)
Races - Other race alone (% change since 2000)
Racial diversity
Place of birth - Born in state of residence (%)
Place of birth - Born in state of residence (%) - White
Place of birth - Born in state of residence (%) - Black or African American
Place of birth - Born in state of residence (%) - Asian
Place of birth - Born in state of residence (%) - Hispanic or Latino
Place of birth - Born in state of residence (%) - American Indian and Alaska Native
Place of birth - Born in state of residence (%) - Multirace
Place of birth - Born in state of residence (%) - Other Race
Place of birth - Born in other state (%)
Place of birth - Born in other state (%) - White
Place of birth - Born in other state (%) - Black or African American
Place of birth - Born in other state (%) - Asian
Place of birth - Born in other state (%) - Hispanic or Latino
Place of birth - Born in other state (%) - American Indian and Alaska Native
Place of birth - Born in other state (%) - Multirace
Place of birth - Born in other state (%) - Other Race
Place of birth - Native, outside of US (%)
Place of birth - Native, outside of US (%) - White
Place of birth - Native, outside of US (%) - Black or African American
Place of birth - Native, outside of US (%) - Asian
Place of birth - Native, outside of US (%) - Hispanic or Latino
Place of birth - Native, outside of US (%) - American Indian and Alaska Native
Place of birth - Native, outside of US (%) - Multirace
Place of birth - Native, outside of US (%) - Other Race
Place of birth - Foreign born (%)
Place of birth - Foreign born (%) - White
Place of birth - Foreign born (%) - Black or African American
Place of birth - Foreign born (%) - Asian
Place of birth - Foreign born (%) - Hispanic or Latino
Place of birth - Foreign born (%) - American Indian and Alaska Native
Place of birth - Foreign born (%) - Multirace
Place of birth - Foreign born (%) - Other Race
Residents speaking English at home (%)
Residents speaking English at home - Born in the United States (%)
Residents speaking English at home - Native, born elsewhere (%)
Residents speaking English at home - Foreign born (%)
Residents speaking Spanish at home (%)
Residents speaking Spanish at home - Born in the United States (%)
Residents speaking Spanish at home - Native, born elsewhere (%)
Residents speaking Spanish at home - Foreign born (%)
Residents speaking other language at home (%)
Residents speaking other language at home - Born in the United States (%)
Residents speaking other language at home - Native, born elsewhere (%)
Residents speaking other language at home - Foreign born (%)
Marital status - Never married (%)
Marital status - Now married (%)
Marital status - Separated (%)
Marital status - Widowed (%)
Marital status - Divorced (%)
Ancestries Reported - Arab (%)
Ancestries Reported - Czech (%)
Ancestries Reported - Danish (%)
Ancestries Reported - Dutch (%)
Ancestries Reported - English (%)
Ancestries Reported - French (%)
Ancestries Reported - French Canadian (%)
Ancestries Reported - German (%)
Ancestries Reported - Greek (%)
Ancestries Reported - Hungarian (%)
Ancestries Reported - Irish (%)
Ancestries Reported - Italian (%)
Ancestries Reported - Lithuanian (%)
Ancestries Reported - Norwegian (%)
Ancestries Reported - Polish (%)
Ancestries Reported - Portuguese (%)
Ancestries Reported - Russian (%)
Ancestries Reported - Scotch-Irish (%)
Ancestries Reported - Scottish (%)
Ancestries Reported - Slovak (%)
Ancestries Reported - Subsaharan African (%)
Ancestries Reported - Swedish (%)
Ancestries Reported - Swiss (%)
Ancestries Reported - Ukrainian (%)
Ancestries Reported - United States (%)
Ancestries Reported - Welsh (%)
Ancestries Reported - West Indian (%)
Ancestries Reported - Other (%)
Geographical mobility - Same house 1 year ago (%)
Geographical mobility - Same house 1 year ago (%) - White
Geographical mobility - Same house 1 year ago (%) - Black or African American
Geographical mobility - Same house 1 year ago (%) - Asian
Geographical mobility - Same house 1 year ago (%) - Hispanic or Latino
Geographical mobility - Same house 1 year ago (%) - American Indian and Alaska Native
Geographical mobility - Same house 1 year ago (%) - Multirace
Geographical mobility - Same house 1 year ago (%) - Other Race
Geographical mobility - Moved within same county (%)
Geographical mobility - Moved within same county (%) - White
Geographical mobility - Moved within same county (%) - Black or African American
Geographical mobility - Moved within same county (%) - Asian
Geographical mobility - Moved within same county (%) - Hispanic or Latino
Geographical mobility - Moved within same county (%) - American Indian and Alaska Native
Geographical mobility - Moved within same county (%) - Multirace
Geographical mobility - Moved within same county (%) - Other Race
Geographical mobility - Moved from different county within same state (%)
Geographical mobility - Moved from different county within same state (%) - White
Geographical mobility - Moved from different county within same state (%) - Black or African American
Geographical mobility - Moved from different county within same state (%) - Asian
Geographical mobility - Moved from different county within same state (%) - Hispanic or Latino
Geographical mobility - Moved from different county within same state (%) - American Indian and Alaska Native
Geographical mobility - Moved from different county within same state (%) - Multirace
Geographical mobility - Moved from different county within same state (%) - Other Race
Geographical mobility - Moved from different state (%)
Geographical mobility - Moved from different state (%) - White
Geographical mobility - Moved from different state (%) - Black or African American
Geographical mobility - Moved from different state (%) - Asian
Geographical mobility - Moved from different state (%) - Hispanic or Latino
Geographical mobility - Moved from different state (%) - American Indian and Alaska Native
Geographical mobility - Moved from different state (%) - Multirace
Geographical mobility - Moved from different state (%) - Other Race
Geographical mobility - Moved from abroad (%)
Geographical mobility - Moved from abroad (%) - White
Geographical mobility - Moved from abroad (%) - Black or African American
Geographical mobility - Moved from abroad (%) - Asian
Geographical mobility - Moved from abroad (%) - Hispanic or Latino
Geographical mobility - Moved from abroad (%) - American Indian and Alaska Native
Geographical mobility - Moved from abroad (%) - Multirace
Geographical mobility - Moved from abroad (%) - Other Race
Place of birth for the foreign-born population - Ireland (%)
Place of birth for the foreign-born population - Denmark (%)
Place of birth for the foreign-born population - Norway (%)
Place of birth for the foreign-born population - Sweden (%)
Place of birth for the foreign-born population - United Kingdom (%)
Place of birth for the foreign-born population - England (%)
Place of birth for the foreign-born population - Scotland (%)
Place of birth for the foreign-born population - Other Northern Europe (%)
Place of birth for the foreign-born population - Austria (%)
Place of birth for the foreign-born population - Belgium (%)
Place of birth for the foreign-born population - France (%)
Place of birth for the foreign-born population - Germany (%)
Place of birth for the foreign-born population - Netherlands (%)
Place of birth for the foreign-born population - Switzerland (%)
Place of birth for the foreign-born population - Other Western Europe (%)
Place of birth for the foreign-born population - Greece (%)
Place of birth for the foreign-born population - Italy (%)
Place of birth for the foreign-born population - Portugal (%)
Place of birth for the foreign-born population - Spain (%)
Place of birth for the foreign-born population - Other Southern Europe (%)
Place of birth for the foreign-born population - Albania (%)
Place of birth for the foreign-born population - Belarus (%)
Place of birth for the foreign-born population - Bosnia and Herzegovina (%)
Place of birth for the foreign-born population - Bulgaria (%)
Place of birth for the foreign-born population - Croatia (%)
Place of birth for the foreign-born population - Czechoslovakia (%)
Place of birth for the foreign-born population - Hungary (%)
Place of birth for the foreign-born population - Latvia (%)
Place of birth for the foreign-born population - Lithuania (%)
Place of birth for the foreign-born population - North Macedonia (Macedonia) (%)
Place of birth for the foreign-born population - Moldova (%)
Place of birth for the foreign-born population - Poland (%)
Place of birth for the foreign-born population - Romania (%)
Place of birth for the foreign-born population - Russia (%)
Place of birth for the foreign-born population - Serbia (%)
Place of birth for the foreign-born population - Ukraine (%)
Place of birth for the foreign-born population - Other Eastern Europe (%)
Place of birth for the foreign-born population - China (%)
Place of birth for the foreign-born population - Hong Kong (%)
Place of birth for the foreign-born population - Taiwan (%)
Place of birth for the foreign-born population - Japan (%)
Place of birth for the foreign-born population - Korea (%)
Place of birth for the foreign-born population - Other Eastern Asia (%)
Place of birth for the foreign-born population - Afghanistan (%)
Place of birth for the foreign-born population - Bangladesh (%)
Place of birth for the foreign-born population - India (%)
Place of birth for the foreign-born population - Iran (%)
Place of birth for the foreign-born population - Kazakhstan (%)
Place of birth for the foreign-born population - Nepal (%)
Place of birth for the foreign-born population - Pakistan (%)
Place of birth for the foreign-born population - Sri Lanka (%)
Place of birth for the foreign-born population - Uzbekistan (%)
Place of birth for the foreign-born population - Other South Central Asia (%)
Place of birth for the foreign-born population - Burma (%)
Place of birth for the foreign-born population - Cambodia (%)
Place of birth for the foreign-born population - Indonesia (%)
Place of birth for the foreign-born population - Laos (%)
Place of birth for the foreign-born population - Malaysia (%)
Place of birth for the foreign-born population - Philippines (%)
Place of birth for the foreign-born population - Singapore (%)
Place of birth for the foreign-born population - Thailand (%)
Place of birth for the foreign-born population - Vietnam (%)
Place of birth for the foreign-born population - Other South Eastern Asia (%)
Place of birth for the foreign-born population - Armenia (%)
Place of birth for the foreign-born population - Iraq (%)
Place of birth for the foreign-born population - Israel (%)
Place of birth for the foreign-born population - Jordan (%)
Place of birth for the foreign-born population - Kuwait (%)
Place of birth for the foreign-born population - Lebanon (%)
Place of birth for the foreign-born population - Saudi Arabia (%)
Place of birth for the foreign-born population - Syria (%)
Place of birth for the foreign-born population - Turkey (%)
Place of birth for the foreign-born population - Yemen (%)
Place of birth for the foreign-born population - Other Western Asia (%)
Place of birth for the foreign-born population - Eritrea (%)
Place of birth for the foreign-born population - Ethiopia (%)
Place of birth for the foreign-born population - Kenya (%)
Place of birth for the foreign-born population - Somalia (%)
Place of birth for the foreign-born population - Uganda (%)
Place of birth for the foreign-born population - Zimbabwe (%)
Place of birth for the foreign-born population - Other Eastern Africa (%)
Place of birth for the foreign-born population - Cameroon (%)
Place of birth for the foreign-born population - Congo (%)
Place of birth for the foreign-born population - Democratic Republic of Congo (Zaire) (%)
Place of birth for the foreign-born population - Other Middle Africa (%)
Place of birth for the foreign-born population - Egypt (%)
Place of birth for the foreign-born population - Morocco (%)
Place of birth for the foreign-born population - Sudan (%)
Place of birth for the foreign-born population - Other Northern Africa (%)
Place of birth for the foreign-born population - South Africa (%)
Place of birth for the foreign-born population - Other Southern Africa (%)
Place of birth for the foreign-born population - Cabo Verde (%)
Place of birth for the foreign-born population - Ghana (%)
Place of birth for the foreign-born population - Liberia (%)
Place of birth for the foreign-born population - Nigeria (%)
Place of birth for the foreign-born population - Senegal (%)
Place of birth for the foreign-born population - Sierra Leone (%)
Place of birth for the foreign-born population - Other Western Africa (%)
Place of birth for the foreign-born population - Australia (%)
Place of birth for the foreign-born population - New Zealand (%)
Place of birth for the foreign-born population - Fiji (%)
Place of birth for the foreign-born population - Micronesia (%)
Place of birth for the foreign-born population - Bahamas (%)
Place of birth for the foreign-born population - Barbados (%)
Place of birth for the foreign-born population - Cuba (%)
Place of birth for the foreign-born population - Dominica (%)
Place of birth for the foreign-born population - Dominican Republic (%)
Place of birth for the foreign-born population - Grenada (%)
Place of birth for the foreign-born population - Haiti (%)
Place of birth for the foreign-born population - Jamaica (%)
Place of birth for the foreign-born population - St. Vincent and the Grenadines (%)
Place of birth for the foreign-born population - Trinidad and Tobago (%)
Place of birth for the foreign-born population - West Indies (%)
Place of birth for the foreign-born population - Other Caribbean (%)
Place of birth for the foreign-born population - Belize (%)
Place of birth for the foreign-born population - Costa Rica (%)
Place of birth for the foreign-born population - El Salvador (%)
Place of birth for the foreign-born population - Guatemala (%)
Place of birth for the foreign-born population - Honduras (%)
Place of birth for the foreign-born population - Mexico (%)
Place of birth for the foreign-born population - Nicaragua (%)
Place of birth for the foreign-born population - Panama (%)
Place of birth for the foreign-born population - Other Central America (%)
Place of birth for the foreign-born population - Argentina (%)
Place of birth for the foreign-born population - Bolivia (%)
Place of birth for the foreign-born population - Brazil (%)
Place of birth for the foreign-born population - Chile (%)
Place of birth for the foreign-born population - Colombia (%)
Place of birth for the foreign-born population - Ecuador (%)
Place of birth for the foreign-born population - Guyana (%)
Place of birth for the foreign-born population - Peru (%)
Place of birth for the foreign-born population - Uruguay (%)
Place of birth for the foreign-born population - Venezuela (%)
Place of birth for the foreign-born population - Other South America (%)
Place of birth for the foreign-born population - Canada (%)
Place of birth for the foreign-born population - Other Northern America (%)
Place of birth for the foreign-born population - Other (%)
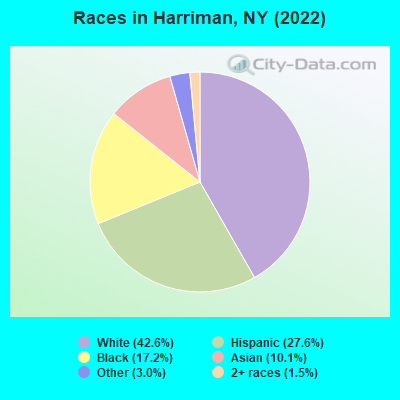
According to 2022 data, the most numerous races in Harriman, NY are White alone (1,272 residents), Hispanic (825 residents), and Black alone (514 residents). 63.5% of Harriman residents speak English at home. 22.7% of Harriman, NY residents are foreign-born (9.1% born in Asia, 8.1% born in Latin America, 3.4% born in Europe, 2.6% born in Africa), which is 3.1% greater than the foreign-born rate of 22.0% across the entire state of New York.
Race distribution in Harriman
2000 2022
11,760,981 62.0% White alone 2,867,583 15.1% Hispanic 2,812,623 14.8% Black alone 1,035,926 5.5% Asian alone 366,116 1.9% Two or more races 75,499 0.4% Other race alone 52,499 0.3% American Indian alone 5,230 0.03% Native Hawaiian and Other
10,408,933 52.9% White alone 3,867,299 19.7% Hispanic 2,633,840 13.4% Black alone 1,776,286 9.0% Asian alone 732,670 3.7% Two or more races 216,110 1.1% Other race alone 35,082 0.2% American Indian alone 6,931 0.04% Native Hawaiian and Other
Income and house value in Harriman Median household income in 2022 $62,997 White non-Hispanic householders$82,187 Some other race householders$144,243 Two or more races householders$103,682 Hispanic or Latino race householdersMedian 2022 house value $293,523 White Non-Hispanic householders$301,358 Black or African American householders$452,037 American Indian or Alaska Native householders $366,451 Asian householders$296,335 Some other race householders$411,856 Two or more races householders$289,504 Hispanic or Latino householders
Median age by race in Harriman
39.8 Median age for White residents40.8 39.8 31.2 Median age for Black or African American residents16.9 37.4 5.8 Median age for American Indian / Alaska Native residents11.9 3.1 56.9 Median age for Asian residents51.5 53.7 -487,992,314.6 Median age for Native Hawaiian / Pacific Islander residents-477,502,295.2 -497,387,669.3 32.2 Median age for Other race residents31.4 36.0 38.1 Median age for Two or more races residents29.9 49.7 42.5 Median age for White alone residents40.5 50.2 22.1 Median age for Hispanic or Latino residents26.1 18.6
Owner/renter occupied households by race in Harriman
House owners and renters - White residents 330 49.8% Owner occupied332 50.2% Renter occupiedHouse owners and renters - Black or African American residents 84 54.8% Owner occupied69 45.2% Renter occupiedHouse owners and renters - American Indian / Alaska Native residents 8 100.0% Owner occupiedHouse owners and renters - Asian residents 50 47.8% Owner occupied54 52.2% Renter occupiedHouse owners and renters - Other race residents 39 30.4% Owner occupied88 69.6% Renter occupiedHouse owners and renters - Two or more races residents 93 53.4% Owner occupied81 46.6% Renter occupiedHouse owners and renters - White alone residents 327 48.9% Owner occupied342 51.1% Renter occupiedHouse owners and renters - Hispanic or Latino residents 109 52.7% Owner occupied98 47.3% Renter occupied
Language usage in Harriman
English speakers - Total 63.5% of residents of Harriman speak English at home.
12.2% of residents speak Spanish at home 252 75.0% Speak English very well84 25.0% Speak English less than very well25.4% of residents speak other language at home 591 84.9% Speak English very well105 15.1% Speak English less than very well
English speakers - Born in the United States 93.2% of residents of Harriman speak English at home.
3.9% of residents speak Spanish at home 12 100.0% Speak English very well2.6% of residents speak other language at home 8 100.0% Speak English very well
English speakers - Native, born elsewhere 8.7% of residents of Harriman speak English at home.
75.4% of residents speak Spanish at home 32 61.5% Speak English very well20 38.5% Speak English less than very well20.3% of residents speak other language at home 14 100.0% Speak English very well
English speakers - Foreign-born 12.9% of residents of Harriman speak English at home.
17.5% of residents speak Spanish at home 62 48.1% Speak English very well67 51.9% Speak English less than very well67.3% of residents speak other language at home 406 81.7% Speak English very well91 18.3% Speak English less than very well
White (Caucasian) - Speak only English Native:
86.5% (1,071)Foreign-born:
49.7% (43)
White (Caucasian) - Speak another language Native:
12.0% (148)Foreign-born:
53.7% (46)
Black or African American - Speak only English Native:
91.5% (307)Foreign-born:
24.5% (42)
Black or African American - Speak another language Native:
7.7% (26)Foreign-born:
97.2% (167)
Asian - Speak only English Native:
13.6% (3)Foreign-born:
0.4% (1)
Asian - Speak another language Native:
55.7% (11)Foreign-born:
99.0% (277)
Other race - Speak another language Native:
55.3% (108)Foreign-born:
97.2% (128)
Two or more races - Speak only English Native:
66.7% (162)Foreign-born:
4.2% (3)
Two or more races - Speak another language Native:
33.9% (82)Foreign-born:
100.0% (74)
White alone - Speak only English Native:
88.7% (982)Foreign-born:
41.3% (42)
White alone - Speak another language Native:
7.9% (87)Foreign-born:
58.1% (60)
Hispanic or Latino - Speak another language Native:
41.3% (226)Foreign-born:
100.0% (131)
Foreign-born residents in Harriman 679 residents are foreign born (9.1% Asia , 8.1% Latin America , 3.4% Europe , 2.6% Africa ).
This city:
22.7%New York:
22.6%
Marital status for residents in Harriman Marital status - White (Caucasian) population 15 years and over
Males 40.8% Never married41.5% Now married2.5% Separated3.1% Widowed12.1% DivorcedFemales 29.3% Never married31.2% Now married0.0% Separated15.3% Widowed24.2% DivorcedWomen who did not give birth in the past 12 months Now married:
33.9% (99)Unmarried:
66.1% (193)
Marital status - Black or African American population 15 years and over
Males 37.3% Never married62.7% Now married0.0% Separated0.0% Widowed0.0% DivorcedFemales 47.4% Never married24.1% Now married18.1% Separated6.5% Widowed3.9% DivorcedWomen who gave birth in the past 12 months Now married:
100.0% (7)Unmarried:
0.0% (0)
Women who did not give birth in the past 12 months Now married:
39.9% (75)Unmarried:
60.1% (113)
Marital status - American Indian / Alaska Native population 15 years and over
Males 0.0% Never married100.0% Now married0.0% Separated0.0% Widowed0.0% DivorcedFemales 0.0% Never married100.0% Now married0.0% Separated0.0% Widowed0.0% DivorcedWomen who gave birth in the past 12 months Now married:
100.0% (9)Unmarried:
0.0% (0)
Marital status - Asian population 15 years and over
Males 36.1% Never married62.9% Now married0.0% Separated1.0% Widowed0.0% DivorcedFemales 8.6% Never married91.4% Now married0.0% Separated0.0% Widowed0.0% DivorcedWomen who gave birth in the past 12 months Now married:
100.0% (1)Unmarried:
0.0% (0)
Women who did not give birth in the past 12 months Now married:
0.0% (0)Unmarried:
100.0% (18)
Marital status - Other race population 15 years and over
Males 52.0% Never married48.0% Now married0.0% Separated0.0% Widowed0.0% DivorcedFemales 7.7% Never married47.3% Now married0.0% Separated0.0% Widowed45.1% DivorcedWomen who did not give birth in the past 12 months Now married:
86.0% (57)Unmarried:
14.0% (9)
Marital status - Two or more races population 15 years and over
Males 56.9% Never married36.1% Now married0.0% Separated0.0% Widowed6.9% DivorcedFemales 40.6% Never married49.3% Now married0.0% Separated0.0% Widowed10.1% DivorcedWomen who did not give birth in the past 12 months Now married:
41.6% (44)Unmarried:
58.4% (62)
Marital status - White alone, not Hispanic / Latino population 15 years and over
Males 39.2% Never married42.4% Now married2.6% Separated3.2% Widowed12.7% DivorcedFemales 22.4% Never married33.9% Now married0.0% Separated17.4% Widowed26.3% DivorcedWomen who did not give birth in the past 12 months Now married:
41.3% (102)Unmarried:
58.7% (145)
Marital status - Hispanic or Latino population 15 years and over
Males 49.2% Never married48.0% Now married0.0% Separated0.0% Widowed2.8% DivorcedFemales 44.2% Never married45.3% Now married0.0% Separated0.0% Widowed10.6% DivorcedWomen who gave birth in the past 12 months Now married:
100.0% (6)Unmarried:
0.0% (0)
Women who did not give birth in the past 12 months Now married:
39.5% (84)Unmarried:
60.5% (128)
Ancestries in Harriman
236 13.3% Italian179 10.1% American81 4.6% Moroccan70 3.9% English66 3.7% African62 3.5% Haitian57 3.2% Irish38 2.1% Pennsylvania German31 1.7% Brazilian20 1.1% German19 1.1% Scottish18 1.0% Russian12 0.7% Portuguese11 0.6% Greek10 0.6% West Indian8 0.5% Polish7 0.4% European6 0.3% Jamaican
Children Nativity (place of birth) in Harriman
Children under 6 years - Living with two parents Both parents native 64 100.0% NativeBoth parents foreign-born 37 72.4% Native14 27.6% Foreign-bornOne native, one foreign-born parent 127 100.0% NativeChildren under 6 years - Living with one parent Native parent 48 100.0% NativeChildren 6 to 17 years - Living with two parents Both parents native 140 100.0% NativeBoth parents foreign-born 31 100.0% NativeOne native, one foreign-born parent 90 100.0% NativeChildren 6 to 17 years - Living with one parent Native parent 317 100.0% NativeForeign-born parent 41 51.7% Native38 48.3% Foreign-born