Races in Frankfort, Kentucky (KY) Detailed Stats
Data:
Races - White alone (%)
Races - White alone (% change since 2000)
Races - Black alone (%)
Races - Black alone (% change since 2000)
Races - American Indian alone (%)
Races - American Indian alone (% change since 2000)
Races - Asian alone (%)
Races - Asian alone (% change since 2000)
Races - Hispanic (%)
Races - Hispanic (% change since 2000)
Races - Native Hawaiian and Other Pacific Islander alone (%)
Races - Native Hawaiian and Other Pacific Islander alone (% change since 2000)
Races - Two or more races(%)
Races - Two or more races(% change since 2000)
Races - Other race alone (%)
Races - Other race alone (% change since 2000)
Racial diversity
Place of birth - Born in state of residence (%)
Place of birth - Born in state of residence (%) - White
Place of birth - Born in state of residence (%) - Black or African American
Place of birth - Born in state of residence (%) - Asian
Place of birth - Born in state of residence (%) - Hispanic or Latino
Place of birth - Born in state of residence (%) - American Indian and Alaska Native
Place of birth - Born in state of residence (%) - Multirace
Place of birth - Born in state of residence (%) - Other Race
Place of birth - Born in other state (%)
Place of birth - Born in other state (%) - White
Place of birth - Born in other state (%) - Black or African American
Place of birth - Born in other state (%) - Asian
Place of birth - Born in other state (%) - Hispanic or Latino
Place of birth - Born in other state (%) - American Indian and Alaska Native
Place of birth - Born in other state (%) - Multirace
Place of birth - Born in other state (%) - Other Race
Place of birth - Native, outside of US (%)
Place of birth - Native, outside of US (%) - White
Place of birth - Native, outside of US (%) - Black or African American
Place of birth - Native, outside of US (%) - Asian
Place of birth - Native, outside of US (%) - Hispanic or Latino
Place of birth - Native, outside of US (%) - American Indian and Alaska Native
Place of birth - Native, outside of US (%) - Multirace
Place of birth - Native, outside of US (%) - Other Race
Place of birth - Foreign born (%)
Place of birth - Foreign born (%) - White
Place of birth - Foreign born (%) - Black or African American
Place of birth - Foreign born (%) - Asian
Place of birth - Foreign born (%) - Hispanic or Latino
Place of birth - Foreign born (%) - American Indian and Alaska Native
Place of birth - Foreign born (%) - Multirace
Place of birth - Foreign born (%) - Other Race
Residents speaking English at home (%)
Residents speaking English at home - Born in the United States (%)
Residents speaking English at home - Native, born elsewhere (%)
Residents speaking English at home - Foreign born (%)
Residents speaking Spanish at home (%)
Residents speaking Spanish at home - Born in the United States (%)
Residents speaking Spanish at home - Native, born elsewhere (%)
Residents speaking Spanish at home - Foreign born (%)
Residents speaking other language at home (%)
Residents speaking other language at home - Born in the United States (%)
Residents speaking other language at home - Native, born elsewhere (%)
Residents speaking other language at home - Foreign born (%)
Marital status - Never married (%)
Marital status - Now married (%)
Marital status - Separated (%)
Marital status - Widowed (%)
Marital status - Divorced (%)
Ancestries Reported - Arab (%)
Ancestries Reported - Czech (%)
Ancestries Reported - Danish (%)
Ancestries Reported - Dutch (%)
Ancestries Reported - English (%)
Ancestries Reported - French (%)
Ancestries Reported - French Canadian (%)
Ancestries Reported - German (%)
Ancestries Reported - Greek (%)
Ancestries Reported - Hungarian (%)
Ancestries Reported - Irish (%)
Ancestries Reported - Italian (%)
Ancestries Reported - Lithuanian (%)
Ancestries Reported - Norwegian (%)
Ancestries Reported - Polish (%)
Ancestries Reported - Portuguese (%)
Ancestries Reported - Russian (%)
Ancestries Reported - Scotch-Irish (%)
Ancestries Reported - Scottish (%)
Ancestries Reported - Slovak (%)
Ancestries Reported - Subsaharan African (%)
Ancestries Reported - Swedish (%)
Ancestries Reported - Swiss (%)
Ancestries Reported - Ukrainian (%)
Ancestries Reported - United States (%)
Ancestries Reported - Welsh (%)
Ancestries Reported - West Indian (%)
Ancestries Reported - Other (%)
Geographical mobility - Same house 1 year ago (%)
Geographical mobility - Same house 1 year ago (%) - White
Geographical mobility - Same house 1 year ago (%) - Black or African American
Geographical mobility - Same house 1 year ago (%) - Asian
Geographical mobility - Same house 1 year ago (%) - Hispanic or Latino
Geographical mobility - Same house 1 year ago (%) - American Indian and Alaska Native
Geographical mobility - Same house 1 year ago (%) - Multirace
Geographical mobility - Same house 1 year ago (%) - Other Race
Geographical mobility - Moved within same county (%)
Geographical mobility - Moved within same county (%) - White
Geographical mobility - Moved within same county (%) - Black or African American
Geographical mobility - Moved within same county (%) - Asian
Geographical mobility - Moved within same county (%) - Hispanic or Latino
Geographical mobility - Moved within same county (%) - American Indian and Alaska Native
Geographical mobility - Moved within same county (%) - Multirace
Geographical mobility - Moved within same county (%) - Other Race
Geographical mobility - Moved from different county within same state (%)
Geographical mobility - Moved from different county within same state (%) - White
Geographical mobility - Moved from different county within same state (%) - Black or African American
Geographical mobility - Moved from different county within same state (%) - Asian
Geographical mobility - Moved from different county within same state (%) - Hispanic or Latino
Geographical mobility - Moved from different county within same state (%) - American Indian and Alaska Native
Geographical mobility - Moved from different county within same state (%) - Multirace
Geographical mobility - Moved from different county within same state (%) - Other Race
Geographical mobility - Moved from different state (%)
Geographical mobility - Moved from different state (%) - White
Geographical mobility - Moved from different state (%) - Black or African American
Geographical mobility - Moved from different state (%) - Asian
Geographical mobility - Moved from different state (%) - Hispanic or Latino
Geographical mobility - Moved from different state (%) - American Indian and Alaska Native
Geographical mobility - Moved from different state (%) - Multirace
Geographical mobility - Moved from different state (%) - Other Race
Geographical mobility - Moved from abroad (%)
Geographical mobility - Moved from abroad (%) - White
Geographical mobility - Moved from abroad (%) - Black or African American
Geographical mobility - Moved from abroad (%) - Asian
Geographical mobility - Moved from abroad (%) - Hispanic or Latino
Geographical mobility - Moved from abroad (%) - American Indian and Alaska Native
Geographical mobility - Moved from abroad (%) - Multirace
Geographical mobility - Moved from abroad (%) - Other Race
Place of birth for the foreign-born population - Ireland (%)
Place of birth for the foreign-born population - Denmark (%)
Place of birth for the foreign-born population - Norway (%)
Place of birth for the foreign-born population - Sweden (%)
Place of birth for the foreign-born population - United Kingdom (%)
Place of birth for the foreign-born population - England (%)
Place of birth for the foreign-born population - Scotland (%)
Place of birth for the foreign-born population - Other Northern Europe (%)
Place of birth for the foreign-born population - Austria (%)
Place of birth for the foreign-born population - Belgium (%)
Place of birth for the foreign-born population - France (%)
Place of birth for the foreign-born population - Germany (%)
Place of birth for the foreign-born population - Netherlands (%)
Place of birth for the foreign-born population - Switzerland (%)
Place of birth for the foreign-born population - Other Western Europe (%)
Place of birth for the foreign-born population - Greece (%)
Place of birth for the foreign-born population - Italy (%)
Place of birth for the foreign-born population - Portugal (%)
Place of birth for the foreign-born population - Spain (%)
Place of birth for the foreign-born population - Other Southern Europe (%)
Place of birth for the foreign-born population - Albania (%)
Place of birth for the foreign-born population - Belarus (%)
Place of birth for the foreign-born population - Bosnia and Herzegovina (%)
Place of birth for the foreign-born population - Bulgaria (%)
Place of birth for the foreign-born population - Croatia (%)
Place of birth for the foreign-born population - Czechoslovakia (%)
Place of birth for the foreign-born population - Hungary (%)
Place of birth for the foreign-born population - Latvia (%)
Place of birth for the foreign-born population - Lithuania (%)
Place of birth for the foreign-born population - North Macedonia (Macedonia) (%)
Place of birth for the foreign-born population - Moldova (%)
Place of birth for the foreign-born population - Poland (%)
Place of birth for the foreign-born population - Romania (%)
Place of birth for the foreign-born population - Russia (%)
Place of birth for the foreign-born population - Serbia (%)
Place of birth for the foreign-born population - Ukraine (%)
Place of birth for the foreign-born population - Other Eastern Europe (%)
Place of birth for the foreign-born population - China (%)
Place of birth for the foreign-born population - Hong Kong (%)
Place of birth for the foreign-born population - Taiwan (%)
Place of birth for the foreign-born population - Japan (%)
Place of birth for the foreign-born population - Korea (%)
Place of birth for the foreign-born population - Other Eastern Asia (%)
Place of birth for the foreign-born population - Afghanistan (%)
Place of birth for the foreign-born population - Bangladesh (%)
Place of birth for the foreign-born population - India (%)
Place of birth for the foreign-born population - Iran (%)
Place of birth for the foreign-born population - Kazakhstan (%)
Place of birth for the foreign-born population - Nepal (%)
Place of birth for the foreign-born population - Pakistan (%)
Place of birth for the foreign-born population - Sri Lanka (%)
Place of birth for the foreign-born population - Uzbekistan (%)
Place of birth for the foreign-born population - Other South Central Asia (%)
Place of birth for the foreign-born population - Burma (%)
Place of birth for the foreign-born population - Cambodia (%)
Place of birth for the foreign-born population - Indonesia (%)
Place of birth for the foreign-born population - Laos (%)
Place of birth for the foreign-born population - Malaysia (%)
Place of birth for the foreign-born population - Philippines (%)
Place of birth for the foreign-born population - Singapore (%)
Place of birth for the foreign-born population - Thailand (%)
Place of birth for the foreign-born population - Vietnam (%)
Place of birth for the foreign-born population - Other South Eastern Asia (%)
Place of birth for the foreign-born population - Armenia (%)
Place of birth for the foreign-born population - Iraq (%)
Place of birth for the foreign-born population - Israel (%)
Place of birth for the foreign-born population - Jordan (%)
Place of birth for the foreign-born population - Kuwait (%)
Place of birth for the foreign-born population - Lebanon (%)
Place of birth for the foreign-born population - Saudi Arabia (%)
Place of birth for the foreign-born population - Syria (%)
Place of birth for the foreign-born population - Turkey (%)
Place of birth for the foreign-born population - Yemen (%)
Place of birth for the foreign-born population - Other Western Asia (%)
Place of birth for the foreign-born population - Eritrea (%)
Place of birth for the foreign-born population - Ethiopia (%)
Place of birth for the foreign-born population - Kenya (%)
Place of birth for the foreign-born population - Somalia (%)
Place of birth for the foreign-born population - Uganda (%)
Place of birth for the foreign-born population - Zimbabwe (%)
Place of birth for the foreign-born population - Other Eastern Africa (%)
Place of birth for the foreign-born population - Cameroon (%)
Place of birth for the foreign-born population - Congo (%)
Place of birth for the foreign-born population - Democratic Republic of Congo (Zaire) (%)
Place of birth for the foreign-born population - Other Middle Africa (%)
Place of birth for the foreign-born population - Egypt (%)
Place of birth for the foreign-born population - Morocco (%)
Place of birth for the foreign-born population - Sudan (%)
Place of birth for the foreign-born population - Other Northern Africa (%)
Place of birth for the foreign-born population - South Africa (%)
Place of birth for the foreign-born population - Other Southern Africa (%)
Place of birth for the foreign-born population - Cabo Verde (%)
Place of birth for the foreign-born population - Ghana (%)
Place of birth for the foreign-born population - Liberia (%)
Place of birth for the foreign-born population - Nigeria (%)
Place of birth for the foreign-born population - Senegal (%)
Place of birth for the foreign-born population - Sierra Leone (%)
Place of birth for the foreign-born population - Other Western Africa (%)
Place of birth for the foreign-born population - Australia (%)
Place of birth for the foreign-born population - New Zealand (%)
Place of birth for the foreign-born population - Fiji (%)
Place of birth for the foreign-born population - Micronesia (%)
Place of birth for the foreign-born population - Bahamas (%)
Place of birth for the foreign-born population - Barbados (%)
Place of birth for the foreign-born population - Cuba (%)
Place of birth for the foreign-born population - Dominica (%)
Place of birth for the foreign-born population - Dominican Republic (%)
Place of birth for the foreign-born population - Grenada (%)
Place of birth for the foreign-born population - Haiti (%)
Place of birth for the foreign-born population - Jamaica (%)
Place of birth for the foreign-born population - St. Vincent and the Grenadines (%)
Place of birth for the foreign-born population - Trinidad and Tobago (%)
Place of birth for the foreign-born population - West Indies (%)
Place of birth for the foreign-born population - Other Caribbean (%)
Place of birth for the foreign-born population - Belize (%)
Place of birth for the foreign-born population - Costa Rica (%)
Place of birth for the foreign-born population - El Salvador (%)
Place of birth for the foreign-born population - Guatemala (%)
Place of birth for the foreign-born population - Honduras (%)
Place of birth for the foreign-born population - Mexico (%)
Place of birth for the foreign-born population - Nicaragua (%)
Place of birth for the foreign-born population - Panama (%)
Place of birth for the foreign-born population - Other Central America (%)
Place of birth for the foreign-born population - Argentina (%)
Place of birth for the foreign-born population - Bolivia (%)
Place of birth for the foreign-born population - Brazil (%)
Place of birth for the foreign-born population - Chile (%)
Place of birth for the foreign-born population - Colombia (%)
Place of birth for the foreign-born population - Ecuador (%)
Place of birth for the foreign-born population - Guyana (%)
Place of birth for the foreign-born population - Peru (%)
Place of birth for the foreign-born population - Uruguay (%)
Place of birth for the foreign-born population - Venezuela (%)
Place of birth for the foreign-born population - Other South America (%)
Place of birth for the foreign-born population - Canada (%)
Place of birth for the foreign-born population - Other Northern America (%)
Place of birth for the foreign-born population - Other (%)
Latest news about races in Frankfort, KY collected exclusively by city-data.com from local newspapers, TV, and radio stations
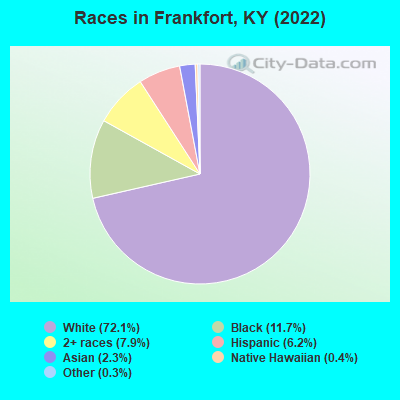
According to 2022 data, the most numerous races in Frankfort, KY are White alone (20,576 residents), Black alone (3,347 residents), and Hispanic (1,765 residents). 91.5% of Frankfort residents speak English at home. 5.8% of Frankfort, KY residents are foreign-born (2.9% born in Latin America, 2.2% born in Asia), which is 30.9% greater than the foreign-born rate of 4.0% across the entire state of Kentucky.
Race distribution in Frankfort
2000 2022
3,608,013 89.3% White alone 293,639 7.3% Black alone 59,939 1.5% Hispanic 37,750 0.9% Two or more races 29,368 0.7% Asian alone 7,939 0.2% American Indian alone 3,846 0.10% Other race alone 1,275 0.03% Native Hawaiian and Other
3,710,998 82.2% White alone 343,194 7.6% Black alone 187,483 4.2% Hispanic 187,394 4.2% Two or more races 62,240 1.4% Asian alone 13,529 0.3% Other race alone 4,302 0.10% American Indian alone 3,170 0.07% Native Hawaiian and Other
Income and house value in Frankfort Median household income in 2022 $55,737 White non-Hispanic householders$38,962 Black householders$89,997 Asian householders$74,090 Some other race householders$41,703 Two or more races householders$49,246 Hispanic or Latino race householdersMedian 2022 house value $176,443 White Non-Hispanic householders$159,515 Black or African American householders$142,190 American Indian or Alaska Native householders $315,248 Asian householders$177,837 Some other race householders$184,210 Two or more races householders$177,837 Hispanic or Latino householders
Median age by race in Frankfort
38.7 Median age for White residents38.1 40.0 31.4 Median age for Black or African American residents31.4 33.9 15.6 Median age for American Indian / Alaska Native residents-607,449,856.1 -630,065,358.8 33.1 Median age for Asian residents30.9 33.9 33.0 Median age for Native Hawaiian / Pacific Islander residents3.8 -853,801,168.7 23.9 Median age for Other race residents25.7 19.6 21.7 Median age for Two or more races residents27.4 20.0 39.0 Median age for White alone residents38.4 41.0 24.5 Median age for Hispanic or Latino residents23.2 26.1
Owner/renter occupied households by race in Frankfort
House owners and renters - White residents 5,567 55.4% Owner occupied4,485 44.6% Renter occupiedHouse owners and renters - Black or African American residents 397 27.0% Owner occupied1,073 73.0% Renter occupiedHouse owners and renters - Asian residents 1 0.4% Owner occupied254 99.6% Renter occupiedHouse owners and renters - Native Hawaiian / Pacific Islander residents 26 100.0% Renter occupiedHouse owners and renters - Other race residents 19 8.3% Owner occupied214 91.7% Renter occupiedHouse owners and renters - Two or more races residents 431 39.8% Owner occupied652 60.2% Renter occupiedHouse owners and renters - White alone residents 5,571 55.5% Owner occupied4,472 44.5% Renter occupiedHouse owners and renters - Hispanic or Latino residents 136 27.4% Owner occupied362 72.6% Renter occupied
Language usage in Frankfort
English speakers - Total 91.5% of residents of Frankfort speak English at home.
4.4% of residents speak Spanish at home 447 38.2% Speak English very well722 61.8% Speak English less than very well4.1% of residents speak other language at home 701 63.6% Speak English very well402 36.4% Speak English less than very well
English speakers - Born in the United States 94.7% of residents of Frankfort speak English at home.
2.1% of residents speak Spanish at home 139 97.9% Speak English very well3 2.1% Speak English less than very well3.3% of residents speak other language at home 215 95.1% Speak English very well11 4.9% Speak English less than very well
English speakers - Native, born elsewhere 60.1% of residents of Frankfort speak English at home.
32.8% of residents speak Spanish at home 83 100.0% Speak English less than very well10.7% of residents speak other language at home 11 40.7% Speak English very well16 59.3% Speak English less than very well
English speakers - Foreign-born 5.4% of residents of Frankfort speak English at home.
49.3% of residents speak Spanish at home 122 15.8% Speak English very well650 84.2% Speak English less than very well45.4% of residents speak other language at home 336 47.3% Speak English very well375 52.7% Speak English less than very well
White (Caucasian) - Speak only English Native:
98.8% (19,192)Foreign-born:
14.7% (22)
White (Caucasian) - Speak another language Native:
1.3% (243)Foreign-born:
79.4% (116)
Black or African American - Speak only English Native:
95.0% (3,004)Foreign-born:
80.2% (36)
Black or African American - Speak another language Native:
4.4% (141)Foreign-born:
26.7% (12)
American Indian / Alaska Native - Speak only English Native:
90.3% (14)Foreign-born:
100.0% (9)
Asian - Speak only English Native:
8.9% (4)Foreign-born:
2.7% (14)
Asian - Speak another language Native:
92.7% (38)Foreign-born:
98.0% (511)
Other race - Speak only English Native:
33.3% (139)Foreign-born:
0.7% (4)
Other race - Speak another language Native:
61.9% (258)Foreign-born:
98.0% (587)
Two or more races - Speak only English Native:
97.2% (2,137)Foreign-born:
0.8% (3)
Two or more races - Speak another language Native:
2.0% (44)Foreign-born:
98.1% (405)
White alone - Speak only English Native:
98.8% (19,093)Foreign-born:
15.1% (23)
White alone - Speak another language Native:
1.2% (230)Foreign-born:
81.5% (124)
Hispanic or Latino - Speak only English Native:
60.8% (455)Foreign-born:
1.2% (10)
Hispanic or Latino - Speak another language Native:
39.3% (294)Foreign-born:
99.0% (758)
Foreign-born residents in Frankfort 1,651 residents are foreign born (2.9% Latin America , 2.2% Asia ).
This city:
5.8%Kentucky:
4.1%
Marital status for residents in Frankfort Marital status - White (Caucasian) population 15 years and over
Males 34.6% Never married42.7% Now married2.1% Separated4.6% Widowed16.0% DivorcedFemales 29.8% Never married37.6% Now married1.4% Separated9.9% Widowed21.3% DivorcedWomen who gave birth in the past 12 months Now married:
64.7% (131)Unmarried:
35.3% (71)
Women who did not give birth in the past 12 months Now married:
34.7% (1,644)Unmarried:
65.3% (3,089)
Marital status - Black or African American population 15 years and over
Males 54.2% Never married29.8% Now married1.6% Separated4.8% Widowed9.6% DivorcedFemales 57.3% Never married21.5% Now married1.1% Separated3.2% Widowed16.8% DivorcedWomen who gave birth in the past 12 months Now married:
86.1% (88)Unmarried:
13.9% (14)
Women who did not give birth in the past 12 months Now married:
14.3% (127)Unmarried:
85.7% (763)
Marital status - American Indian / Alaska Native population 15 years and over
Males 28.6% Never married71.4% Now married0.0% Separated0.0% Widowed0.0% DivorcedFemales 100.0% Never married0.0% Now married0.0% Separated0.0% Widowed0.0% DivorcedWomen who did not give birth in the past 12 months Now married:
0.0% (0)Unmarried:
100.0% (9)
Marital status - Asian population 15 years and over
Males 46.0% Never married54.0% Now married0.0% Separated0.0% Widowed0.0% DivorcedFemales 14.2% Never married85.8% Now married0.0% Separated0.0% Widowed0.0% DivorcedWomen who did not give birth in the past 12 months Now married:
81.4% (172)Unmarried:
18.6% (39)
Marital status - Native Hawaiian / Pacific Islander population 15 years and over
Males 0.0% Never married100.0% Now married0.0% Separated0.0% Widowed0.0% DivorcedFemales 0.0% Never married100.0% Now married0.0% Separated0.0% Widowed0.0% DivorcedWomen who gave birth in the past 12 months Now married:
100.0% (39)Unmarried:
0.0% (0)
Marital status - Other race population 15 years and over
Males 56.3% Never married41.7% Now married0.0% Separated0.0% Widowed2.0% DivorcedFemales 63.8% Never married26.3% Now married10.0% Separated0.0% Widowed0.0% DivorcedWomen who did not give birth in the past 12 months Now married:
29.2% (83)Unmarried:
70.8% (201)
Marital status - Two or more races population 15 years and over
Males 62.8% Never married19.9% Now married1.3% Separated0.0% Widowed16.0% DivorcedFemales 49.2% Never married33.4% Now married1.7% Separated3.6% Widowed12.1% DivorcedWomen who gave birth in the past 12 months Now married:
77.8% (30)Unmarried:
22.2% (9)
Women who did not give birth in the past 12 months Now married:
28.4% (205)Unmarried:
71.6% (517)
Marital status - White alone, not Hispanic / Latino population 15 years and over
Males 34.6% Never married42.6% Now married2.1% Separated4.6% Widowed16.0% DivorcedFemales 29.0% Never married37.9% Now married1.5% Separated10.0% Widowed21.6% DivorcedWomen who gave birth in the past 12 months Now married:
64.7% (132)Unmarried:
35.3% (72)
Women who did not give birth in the past 12 months Now married:
35.2% (1,639)Unmarried:
64.8% (3,016)
Marital status - Hispanic or Latino population 15 years and over
Males 58.8% Never married40.1% Now married0.0% Separated0.0% Widowed1.1% DivorcedFemales 61.7% Never married20.2% Now married4.7% Separated0.0% Widowed13.4% DivorcedWomen who gave birth in the past 12 months Now married:
100.0% (23)Unmarried:
0.0% (0)
Women who did not give birth in the past 12 months Now married:
20.1% (90)Unmarried:
79.9% (358)
Ancestries in Frankfort
4,493 28.4% American1,952 12.4% English1,244 7.9% Irish893 5.7% German355 2.2% Scottish336 2.1% European258 1.6% Italian203 1.3% Haitian147 0.9% Scotch-Irish103 0.7% British75 0.5% French50 0.3% African41 0.3% Dutch31 0.2% Finnish26 0.2% Polish20 0.1% South African18 0.1% Portuguese13 0.08% Danish13 0.08% Swedish10 0.06% Russian8 0.05% Greek8 0.05% Welsh7 0.04% Iranian3 0.02% Belizean
Geographical mobility in Frankfort Same house 1 year ago 16,721 81.8% White (Caucasian)2,080 62.7% Black or African American13 50.0% American Indian / Alaska Native401 60.9% Asian870 80.7% Other race2,262 74.4% Two or more races16,711 82.2% White alone, not Hispanic / Latino1,310 75.4% Hispanic or LatinoMoved within same county 1,856 9.1% White / Caucasian758 22.9% Black or African American77 11.7% Asian60 5.5% Other race608 20.0% Two or more races1,882 9.3% White alone, not Hispanic / Latino110 6.3% Hispanic or LatinoMoved within same state 1,447 7.1% White / Caucasian204 6.2% Black or African American77 2.5% Two or more races1,308 6.4% White alone, not Hispanic / Latino164 9.5% Hispanic or LatinoMoved from different state 267 1.3% White / Caucasian173 5.2% Black or African American10 41.0% American Indian / Alaska Native115 17.5% Asian94 99.3% Native Hawaiian / Pacific Islander37 3.5% Other race66 2.2% Two or more races272 1.3% White alone, not Hispanic / Latino46 2.6% Hispanic or LatinoMoved from abroad 13 0.1% White86 13.0% Asian131 12.2% Other race14 0.1% White alone, not Hispanic / Latino124 7.2% Hispanic or Latino
Children Nativity (place of birth) in Frankfort
Children under 6 years - Living with two parents Both parents native 1,058 100.0% NativeBoth parents foreign-born 95 65.7% Native49 34.3% Foreign-bornOne native, one foreign-born parent 33 100.0% NativeChildren under 6 years - Living with one parent Native parent 785 100.0% NativeForeign-born parent 91 100.0% NativeChildren 6 to 17 years - Living with two parents Both parents native 1,541 100.0% NativeBoth parents foreign-born 36 60.8% Native23 39.2% Foreign-bornOne native, one foreign-born parent 27 100.0% NativeChildren 6 to 17 years - Living with one parent Native parent 1,869 100.0% NativeForeign-born parent 273 61.6% Native170 38.4% Foreign-born
Grandparents responsible for own grandchildren in Frankfort
Grandparents (30 to 59 years) White / Caucasian 183 60.4% Responsible for grandchildren120 39.6% Not responsible for grandchildrenBlack or African American 13 44.1% Responsible for grandchildren17 55.9% Not responsible for grandchildrenOther race 27 100.0% Not responsible for grandchildrenTwo or more races 40 95.3% Responsible for grandchildren2 4.7% Not responsible for grandchildrenWhite alone, not Hispanic / Latino 184 60.0% Responsible for grandchildren122 40.0% Not responsible for grandchildrenHispanic or Latino 21 58.2% Responsible for grandchildren15 41.8% Not responsible for grandchildrenGrandparents (60 years and over) White / Caucasian 268 81.5% Responsible for grandchildren61 18.5% Not responsible for grandchildrenBlack or African American 20 52.6% Responsible for grandchildren18 47.4% Not responsible for grandchildrenTwo or more races 19 100.0% Responsible for grandchildrenWhite alone, not Hispanic / Latino 269 81.4% Responsible for grandchildren62 18.6% Not responsible for grandchildren