Races in Elmsford, New York (NY) Detailed Stats
Data:
Races - White alone (%)
Races - White alone (% change since 2000)
Races - Black alone (%)
Races - Black alone (% change since 2000)
Races - American Indian alone (%)
Races - American Indian alone (% change since 2000)
Races - Asian alone (%)
Races - Asian alone (% change since 2000)
Races - Hispanic (%)
Races - Hispanic (% change since 2000)
Races - Native Hawaiian and Other Pacific Islander alone (%)
Races - Native Hawaiian and Other Pacific Islander alone (% change since 2000)
Races - Two or more races(%)
Races - Two or more races(% change since 2000)
Races - Other race alone (%)
Races - Other race alone (% change since 2000)
Racial diversity
Place of birth - Born in state of residence (%)
Place of birth - Born in state of residence (%) - White
Place of birth - Born in state of residence (%) - Black or African American
Place of birth - Born in state of residence (%) - Asian
Place of birth - Born in state of residence (%) - Hispanic or Latino
Place of birth - Born in state of residence (%) - American Indian and Alaska Native
Place of birth - Born in state of residence (%) - Multirace
Place of birth - Born in state of residence (%) - Other Race
Place of birth - Born in other state (%)
Place of birth - Born in other state (%) - White
Place of birth - Born in other state (%) - Black or African American
Place of birth - Born in other state (%) - Asian
Place of birth - Born in other state (%) - Hispanic or Latino
Place of birth - Born in other state (%) - American Indian and Alaska Native
Place of birth - Born in other state (%) - Multirace
Place of birth - Born in other state (%) - Other Race
Place of birth - Native, outside of US (%)
Place of birth - Native, outside of US (%) - White
Place of birth - Native, outside of US (%) - Black or African American
Place of birth - Native, outside of US (%) - Asian
Place of birth - Native, outside of US (%) - Hispanic or Latino
Place of birth - Native, outside of US (%) - American Indian and Alaska Native
Place of birth - Native, outside of US (%) - Multirace
Place of birth - Native, outside of US (%) - Other Race
Place of birth - Foreign born (%)
Place of birth - Foreign born (%) - White
Place of birth - Foreign born (%) - Black or African American
Place of birth - Foreign born (%) - Asian
Place of birth - Foreign born (%) - Hispanic or Latino
Place of birth - Foreign born (%) - American Indian and Alaska Native
Place of birth - Foreign born (%) - Multirace
Place of birth - Foreign born (%) - Other Race
Residents speaking English at home (%)
Residents speaking English at home - Born in the United States (%)
Residents speaking English at home - Native, born elsewhere (%)
Residents speaking English at home - Foreign born (%)
Residents speaking Spanish at home (%)
Residents speaking Spanish at home - Born in the United States (%)
Residents speaking Spanish at home - Native, born elsewhere (%)
Residents speaking Spanish at home - Foreign born (%)
Residents speaking other language at home (%)
Residents speaking other language at home - Born in the United States (%)
Residents speaking other language at home - Native, born elsewhere (%)
Residents speaking other language at home - Foreign born (%)
Marital status - Never married (%)
Marital status - Now married (%)
Marital status - Separated (%)
Marital status - Widowed (%)
Marital status - Divorced (%)
Ancestries Reported - Arab (%)
Ancestries Reported - Czech (%)
Ancestries Reported - Danish (%)
Ancestries Reported - Dutch (%)
Ancestries Reported - English (%)
Ancestries Reported - French (%)
Ancestries Reported - French Canadian (%)
Ancestries Reported - German (%)
Ancestries Reported - Greek (%)
Ancestries Reported - Hungarian (%)
Ancestries Reported - Irish (%)
Ancestries Reported - Italian (%)
Ancestries Reported - Lithuanian (%)
Ancestries Reported - Norwegian (%)
Ancestries Reported - Polish (%)
Ancestries Reported - Portuguese (%)
Ancestries Reported - Russian (%)
Ancestries Reported - Scotch-Irish (%)
Ancestries Reported - Scottish (%)
Ancestries Reported - Slovak (%)
Ancestries Reported - Subsaharan African (%)
Ancestries Reported - Swedish (%)
Ancestries Reported - Swiss (%)
Ancestries Reported - Ukrainian (%)
Ancestries Reported - United States (%)
Ancestries Reported - Welsh (%)
Ancestries Reported - West Indian (%)
Ancestries Reported - Other (%)
Geographical mobility - Same house 1 year ago (%)
Geographical mobility - Same house 1 year ago (%) - White
Geographical mobility - Same house 1 year ago (%) - Black or African American
Geographical mobility - Same house 1 year ago (%) - Asian
Geographical mobility - Same house 1 year ago (%) - Hispanic or Latino
Geographical mobility - Same house 1 year ago (%) - American Indian and Alaska Native
Geographical mobility - Same house 1 year ago (%) - Multirace
Geographical mobility - Same house 1 year ago (%) - Other Race
Geographical mobility - Moved within same county (%)
Geographical mobility - Moved within same county (%) - White
Geographical mobility - Moved within same county (%) - Black or African American
Geographical mobility - Moved within same county (%) - Asian
Geographical mobility - Moved within same county (%) - Hispanic or Latino
Geographical mobility - Moved within same county (%) - American Indian and Alaska Native
Geographical mobility - Moved within same county (%) - Multirace
Geographical mobility - Moved within same county (%) - Other Race
Geographical mobility - Moved from different county within same state (%)
Geographical mobility - Moved from different county within same state (%) - White
Geographical mobility - Moved from different county within same state (%) - Black or African American
Geographical mobility - Moved from different county within same state (%) - Asian
Geographical mobility - Moved from different county within same state (%) - Hispanic or Latino
Geographical mobility - Moved from different county within same state (%) - American Indian and Alaska Native
Geographical mobility - Moved from different county within same state (%) - Multirace
Geographical mobility - Moved from different county within same state (%) - Other Race
Geographical mobility - Moved from different state (%)
Geographical mobility - Moved from different state (%) - White
Geographical mobility - Moved from different state (%) - Black or African American
Geographical mobility - Moved from different state (%) - Asian
Geographical mobility - Moved from different state (%) - Hispanic or Latino
Geographical mobility - Moved from different state (%) - American Indian and Alaska Native
Geographical mobility - Moved from different state (%) - Multirace
Geographical mobility - Moved from different state (%) - Other Race
Geographical mobility - Moved from abroad (%)
Geographical mobility - Moved from abroad (%) - White
Geographical mobility - Moved from abroad (%) - Black or African American
Geographical mobility - Moved from abroad (%) - Asian
Geographical mobility - Moved from abroad (%) - Hispanic or Latino
Geographical mobility - Moved from abroad (%) - American Indian and Alaska Native
Geographical mobility - Moved from abroad (%) - Multirace
Geographical mobility - Moved from abroad (%) - Other Race
Place of birth for the foreign-born population - Ireland (%)
Place of birth for the foreign-born population - Denmark (%)
Place of birth for the foreign-born population - Norway (%)
Place of birth for the foreign-born population - Sweden (%)
Place of birth for the foreign-born population - United Kingdom (%)
Place of birth for the foreign-born population - England (%)
Place of birth for the foreign-born population - Scotland (%)
Place of birth for the foreign-born population - Other Northern Europe (%)
Place of birth for the foreign-born population - Austria (%)
Place of birth for the foreign-born population - Belgium (%)
Place of birth for the foreign-born population - France (%)
Place of birth for the foreign-born population - Germany (%)
Place of birth for the foreign-born population - Netherlands (%)
Place of birth for the foreign-born population - Switzerland (%)
Place of birth for the foreign-born population - Other Western Europe (%)
Place of birth for the foreign-born population - Greece (%)
Place of birth for the foreign-born population - Italy (%)
Place of birth for the foreign-born population - Portugal (%)
Place of birth for the foreign-born population - Spain (%)
Place of birth for the foreign-born population - Other Southern Europe (%)
Place of birth for the foreign-born population - Albania (%)
Place of birth for the foreign-born population - Belarus (%)
Place of birth for the foreign-born population - Bosnia and Herzegovina (%)
Place of birth for the foreign-born population - Bulgaria (%)
Place of birth for the foreign-born population - Croatia (%)
Place of birth for the foreign-born population - Czechoslovakia (%)
Place of birth for the foreign-born population - Hungary (%)
Place of birth for the foreign-born population - Latvia (%)
Place of birth for the foreign-born population - Lithuania (%)
Place of birth for the foreign-born population - North Macedonia (Macedonia) (%)
Place of birth for the foreign-born population - Moldova (%)
Place of birth for the foreign-born population - Poland (%)
Place of birth for the foreign-born population - Romania (%)
Place of birth for the foreign-born population - Russia (%)
Place of birth for the foreign-born population - Serbia (%)
Place of birth for the foreign-born population - Ukraine (%)
Place of birth for the foreign-born population - Other Eastern Europe (%)
Place of birth for the foreign-born population - China (%)
Place of birth for the foreign-born population - Hong Kong (%)
Place of birth for the foreign-born population - Taiwan (%)
Place of birth for the foreign-born population - Japan (%)
Place of birth for the foreign-born population - Korea (%)
Place of birth for the foreign-born population - Other Eastern Asia (%)
Place of birth for the foreign-born population - Afghanistan (%)
Place of birth for the foreign-born population - Bangladesh (%)
Place of birth for the foreign-born population - India (%)
Place of birth for the foreign-born population - Iran (%)
Place of birth for the foreign-born population - Kazakhstan (%)
Place of birth for the foreign-born population - Nepal (%)
Place of birth for the foreign-born population - Pakistan (%)
Place of birth for the foreign-born population - Sri Lanka (%)
Place of birth for the foreign-born population - Uzbekistan (%)
Place of birth for the foreign-born population - Other South Central Asia (%)
Place of birth for the foreign-born population - Burma (%)
Place of birth for the foreign-born population - Cambodia (%)
Place of birth for the foreign-born population - Indonesia (%)
Place of birth for the foreign-born population - Laos (%)
Place of birth for the foreign-born population - Malaysia (%)
Place of birth for the foreign-born population - Philippines (%)
Place of birth for the foreign-born population - Singapore (%)
Place of birth for the foreign-born population - Thailand (%)
Place of birth for the foreign-born population - Vietnam (%)
Place of birth for the foreign-born population - Other South Eastern Asia (%)
Place of birth for the foreign-born population - Armenia (%)
Place of birth for the foreign-born population - Iraq (%)
Place of birth for the foreign-born population - Israel (%)
Place of birth for the foreign-born population - Jordan (%)
Place of birth for the foreign-born population - Kuwait (%)
Place of birth for the foreign-born population - Lebanon (%)
Place of birth for the foreign-born population - Saudi Arabia (%)
Place of birth for the foreign-born population - Syria (%)
Place of birth for the foreign-born population - Turkey (%)
Place of birth for the foreign-born population - Yemen (%)
Place of birth for the foreign-born population - Other Western Asia (%)
Place of birth for the foreign-born population - Eritrea (%)
Place of birth for the foreign-born population - Ethiopia (%)
Place of birth for the foreign-born population - Kenya (%)
Place of birth for the foreign-born population - Somalia (%)
Place of birth for the foreign-born population - Uganda (%)
Place of birth for the foreign-born population - Zimbabwe (%)
Place of birth for the foreign-born population - Other Eastern Africa (%)
Place of birth for the foreign-born population - Cameroon (%)
Place of birth for the foreign-born population - Congo (%)
Place of birth for the foreign-born population - Democratic Republic of Congo (Zaire) (%)
Place of birth for the foreign-born population - Other Middle Africa (%)
Place of birth for the foreign-born population - Egypt (%)
Place of birth for the foreign-born population - Morocco (%)
Place of birth for the foreign-born population - Sudan (%)
Place of birth for the foreign-born population - Other Northern Africa (%)
Place of birth for the foreign-born population - South Africa (%)
Place of birth for the foreign-born population - Other Southern Africa (%)
Place of birth for the foreign-born population - Cabo Verde (%)
Place of birth for the foreign-born population - Ghana (%)
Place of birth for the foreign-born population - Liberia (%)
Place of birth for the foreign-born population - Nigeria (%)
Place of birth for the foreign-born population - Senegal (%)
Place of birth for the foreign-born population - Sierra Leone (%)
Place of birth for the foreign-born population - Other Western Africa (%)
Place of birth for the foreign-born population - Australia (%)
Place of birth for the foreign-born population - New Zealand (%)
Place of birth for the foreign-born population - Fiji (%)
Place of birth for the foreign-born population - Micronesia (%)
Place of birth for the foreign-born population - Bahamas (%)
Place of birth for the foreign-born population - Barbados (%)
Place of birth for the foreign-born population - Cuba (%)
Place of birth for the foreign-born population - Dominica (%)
Place of birth for the foreign-born population - Dominican Republic (%)
Place of birth for the foreign-born population - Grenada (%)
Place of birth for the foreign-born population - Haiti (%)
Place of birth for the foreign-born population - Jamaica (%)
Place of birth for the foreign-born population - St. Vincent and the Grenadines (%)
Place of birth for the foreign-born population - Trinidad and Tobago (%)
Place of birth for the foreign-born population - West Indies (%)
Place of birth for the foreign-born population - Other Caribbean (%)
Place of birth for the foreign-born population - Belize (%)
Place of birth for the foreign-born population - Costa Rica (%)
Place of birth for the foreign-born population - El Salvador (%)
Place of birth for the foreign-born population - Guatemala (%)
Place of birth for the foreign-born population - Honduras (%)
Place of birth for the foreign-born population - Mexico (%)
Place of birth for the foreign-born population - Nicaragua (%)
Place of birth for the foreign-born population - Panama (%)
Place of birth for the foreign-born population - Other Central America (%)
Place of birth for the foreign-born population - Argentina (%)
Place of birth for the foreign-born population - Bolivia (%)
Place of birth for the foreign-born population - Brazil (%)
Place of birth for the foreign-born population - Chile (%)
Place of birth for the foreign-born population - Colombia (%)
Place of birth for the foreign-born population - Ecuador (%)
Place of birth for the foreign-born population - Guyana (%)
Place of birth for the foreign-born population - Peru (%)
Place of birth for the foreign-born population - Uruguay (%)
Place of birth for the foreign-born population - Venezuela (%)
Place of birth for the foreign-born population - Other South America (%)
Place of birth for the foreign-born population - Canada (%)
Place of birth for the foreign-born population - Other Northern America (%)
Place of birth for the foreign-born population - Other (%)
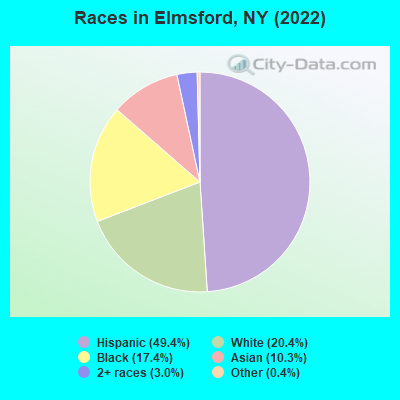
According to 2022 data, the most numerous races in Elmsford, NY are White alone (1,050 residents), Hispanic (2,545 residents), and Black alone (898 residents). 51.8% of Elmsford residents speak English at home. 34.3% of Elmsford, NY residents are foreign-born (24.5% born in Latin America, 7.3% born in Asia), which is 35.8% greater than the foreign-born rate of 22.0% across the entire state of New York.
Race distribution in Elmsford
2000 2022
11,760,981 62.0% White alone 2,867,583 15.1% Hispanic 2,812,623 14.8% Black alone 1,035,926 5.5% Asian alone 366,116 1.9% Two or more races 75,499 0.4% Other race alone 52,499 0.3% American Indian alone 5,230 0.03% Native Hawaiian and Other
10,408,933 52.9% White alone 3,867,299 19.7% Hispanic 2,633,840 13.4% Black alone 1,776,286 9.0% Asian alone 732,670 3.7% Two or more races 216,110 1.1% Other race alone 35,082 0.2% American Indian alone 6,931 0.04% Native Hawaiian and Other
Income and house value in Elmsford Median household income in 2022 $114,794 White non-Hispanic householders$117,463 Black householders$156,934 Asian householders$85,938 Some other race householders$82,942 Hispanic or Latino race householdersMedian 2022 house value $553,279 White Non-Hispanic householders$449,483 Black or African American householders $684,026 Asian householders$417,632 Some other race householders$417,632 Two or more races householders$521,650 Hispanic or Latino householders
Median age by race in Elmsford
47.9 Median age for White residents47.3 50.3 34.5 Median age for Black or African American residents26.1 35.5 37.0 Median age for American Indian / Alaska Native residents-664,804,468.6 -554,999,999.4 36.3 Median age for Asian residents38.4 32.6 -487,992,314.6 Median age for Native Hawaiian / Pacific Islander residents-477,502,295.2 -666,666,666.0 31.6 Median age for Other race residents31.7 31.2 16.0 Median age for Two or more races residents22.8 12.5 53.2 Median age for White alone residents52.6 56.4 30.5 Median age for Hispanic or Latino residents32.6 23.1
Owner/renter occupied households by race in Elmsford
House owners and renters - White residents 448 68.3% Owner occupied208 31.7% Renter occupiedHouse owners and renters - Black or African American residents 179 48.1% Owner occupied193 51.9% Renter occupiedHouse owners and renters - American Indian / Alaska Native residents 23 100.0% Renter occupiedHouse owners and renters - Asian residents 101 50.7% Owner occupied99 49.3% Renter occupiedHouse owners and renters - Other race residents 272 69.9% Owner occupied117 30.1% Renter occupiedHouse owners and renters - Two or more races residents 28 36.5% Owner occupied49 63.5% Renter occupiedHouse owners and renters - White alone residents 351 67.4% Owner occupied170 32.6% Renter occupiedHouse owners and renters - Hispanic or Latino residents 328 56.7% Owner occupied251 43.3% Renter occupied
Language usage in Elmsford
English speakers - Total 51.8% of residents of Elmsford speak English at home.
35.1% of residents speak Spanish at home 901 53.9% Speak English very well770 46.1% Speak English less than very well13.0% of residents speak other language at home 526 84.7% Speak English very well95 15.3% Speak English less than very well
English speakers - Born in the United States 84.4% of residents of Elmsford speak English at home.
13.2% of residents speak Spanish at home 34 100.0% Speak English very well1.2% of residents speak other language at home 3 100.0% Speak English very well
English speakers - Native, born elsewhere 30.4% of residents of Elmsford speak English at home.
69.6% of residents speak Spanish at home 32 100.0% Speak English less than very well
English speakers - Foreign-born 18.2% of residents of Elmsford speak English at home.
57.5% of residents speak Spanish at home 338 32.8% Speak English very well691 67.2% Speak English less than very well23.1% of residents speak other language at home 320 77.5% Speak English very well93 22.5% Speak English less than very well
White (Caucasian) - Speak only English Native:
80.6% (1,091)Foreign-born:
10.7% (26)
White (Caucasian) - Speak another language Native:
16.7% (226)Foreign-born:
80.2% (193)
Black or African American - Speak only English Native:
69.9% (449)Foreign-born:
77.4% (254)
Black or African American - Speak another language Native:
24.9% (160)Foreign-born:
23.8% (78)
American Indian / Alaska Native - Speak another language Native:
100.0% (22)Foreign-born:
100.0% (45)
Asian - Speak only English Native:
73.5% (85)Foreign-born:
6.6% (24)
Asian - Speak another language Native:
26.3% (30)Foreign-born:
92.6% (341)
Other race - Speak another language Native:
44.1% (264)Foreign-born:
96.8% (734)
Two or more races - Speak only English Native:
83.5% (252)Foreign-born:
34.5% (28)
Two or more races - Speak another language Native:
17.5% (53)Foreign-born:
63.2% (52)
White alone - Speak only English Native:
100.0% (1,006)Foreign-born:
63.9% (26)
White alone - Speak another language Native:
0.4% (4)Foreign-born:
40.4% (17)
Hispanic or Latino - Speak another language Native:
51.5% (648)Foreign-born:
98.3% (1,034)
Foreign-born residents in Elmsford 1,767 residents are foreign born (24.5% Latin America , 7.3% Asia ).
This city:
34.3%New York:
22.6%
Marital status for residents in Elmsford Marital status - White (Caucasian) population 15 years and over
Males 45.5% Never married49.7% Now married0.0% Separated1.4% Widowed3.4% DivorcedFemales 31.8% Never married41.3% Now married0.0% Separated15.0% Widowed11.9% DivorcedWomen who did not give birth in the past 12 months Now married:
23.1% (81)Unmarried:
76.9% (269)
Marital status - Black or African American population 15 years and over
Males 64.2% Never married35.8% Now married0.0% Separated0.0% Widowed0.0% DivorcedFemales 49.2% Never married33.8% Now married0.0% Separated5.0% Widowed12.0% DivorcedWomen who gave birth in the past 12 months Now married:
100.0% (13)Unmarried:
0.0% (0)
Women who did not give birth in the past 12 months Now married:
33.0% (83)Unmarried:
67.0% (169)
Marital status - American Indian / Alaska Native population 15 years and over
Males 100.0% Never married0.0% Now married0.0% Separated0.0% Widowed0.0% DivorcedFemales 100.0% Never married0.0% Now married0.0% Separated0.0% Widowed0.0% DivorcedWomen who did not give birth in the past 12 months Now married:
0.0% (0)Unmarried:
100.0% (16)
Marital status - Asian population 15 years and over
Males 13.8% Never married81.0% Now married1.7% Separated3.4% Widowed0.0% DivorcedFemales 43.4% Never married54.8% Now married0.0% Separated1.8% Widowed0.0% DivorcedWomen who gave birth in the past 12 months Now married:
48.1% (13)Unmarried:
51.9% (14)
Women who did not give birth in the past 12 months Now married:
40.0% (61)Unmarried:
60.0% (91)
Marital status - Other race population 15 years and over
Males 36.0% Never married55.4% Now married0.0% Separated0.0% Widowed8.6% DivorcedFemales 22.3% Never married58.5% Now married0.0% Separated0.0% Widowed19.2% DivorcedWomen who did not give birth in the past 12 months Now married:
63.2% (208)Unmarried:
36.8% (121)
Marital status - Two or more races population 15 years and over
Males 57.0% Never married20.4% Now married0.0% Separated0.0% Widowed22.6% DivorcedFemales 31.6% Never married47.4% Now married0.0% Separated0.0% Widowed21.1% DivorcedWomen who did not give birth in the past 12 months Now married:
48.2% (34)Unmarried:
51.8% (37)
Marital status - White alone, not Hispanic / Latino population 15 years and over
Males 35.4% Never married57.5% Now married0.0% Separated2.1% Widowed5.1% DivorcedFemales 15.5% Never married48.1% Now married0.0% Separated23.3% Widowed13.2% DivorcedWomen who did not give birth in the past 12 months Now married:
44.6% (75)Unmarried:
55.4% (93)
Marital status - Hispanic or Latino population 15 years and over
Males 47.5% Never married47.0% Now married0.0% Separated0.0% Widowed5.6% DivorcedFemales 43.6% Never married40.2% Now married0.0% Separated0.0% Widowed16.2% DivorcedWomen who did not give birth in the past 12 months Now married:
33.3% (223)Unmarried:
66.7% (446)
Ancestries in Elmsford
301 9.3% Irish205 6.4% Ghanaian198 6.1% Italian130 4.0% Jamaican77 2.4% West Indian57 1.8% Guyanese52 1.6% American41 1.3% Bahamian21 0.7% German12 0.4% African9 0.3% Latvian3 0.09% European1 0.03% Alsatian
Children Nativity (place of birth) in Elmsford
Children under 6 years - Living with two parents Both parents native 44 100.0% NativeBoth parents foreign-born 177 100.0% NativeOne native, one foreign-born parent 73 100.0% NativeChildren under 6 years - Living with one parent Native parent 123 100.0% NativeForeign-born parent 37 100.0% NativeChildren 6 to 17 years - Living with two parents Both parents native 124 100.0% NativeBoth parents foreign-born 187 100.0% NativeOne native, one foreign-born parent 17 100.0% NativeChildren 6 to 17 years - Living with one parent Native parent 145 100.0% NativeForeign-born parent 129 51.2% Native123 48.8% Foreign-born
Grandparents responsible for own grandchildren in Elmsford
Grandparents (30 to 59 years) Asian 9 100.0% Not responsible for grandchildren
Grandparents (60 years and over) Asian 17 100.0% Not responsible for grandchildren