Races in Danby, New York (NY) Detailed Stats
Ancestries, Foreign-born residents, place of birth

Recent posts about races in Danby, New York on our local forum with over 2,400,000 registered users:
 | Draining a basement humidifier (32 replies) |
| Ithaca, NY homes (17 replies) |
| Danby the Sunshine School in Ithaca NY (1 reply) |
| Ithaca, New York? (150 replies) |
| Dehumidifier for the basement. So many brands, any suggestions? (6 replies) |
| Retiring to Ithaca (4 replies) |
3.4% of Danby, NY residents are foreign-born (2.4% born in Europe, 0.7% born in North America), which is 548.6% less than the foreign-born rate of 22.0% across the entire state of New York.
Race distribution in Danby

- 2,78892.7%White alone
- 792.6%Black alone
- 511.7%Hispanic
- 521.7%Two or more races
- 280.9%Asian alone
- 50.2%American Indian alone
- 40.1%Other race alone

2000
2022
-
- 11,760,98162.0%White alone
- 2,867,58315.1%Hispanic
- 2,812,62314.8%Black alone
- 1,035,9265.5%Asian alone
- 366,1161.9%Two or more races
- 75,4990.4%Other race alone
- 52,4990.3%American Indian alone
- 5,2300.03%Native Hawaiian and Other
Pacific Islander alone

-
- 10,408,93352.9%White alone
- 3,867,29919.7%Hispanic
- 2,633,84013.4%Black alone
- 1,776,2869.0%Asian alone
- 732,6703.7%Two or more races
- 216,1101.1%Other race alone
- 35,0820.2%American Indian alone
- 6,9310.04%Native Hawaiian and Other
Pacific Islander alone

Income and house value in Danby
- Median household income in 2022
- $96,784White non-Hispanic householders
- $58,848Black householders
- $80,872Two or more races householders
- Median 2022 house value
- $287,114White Non-Hispanic householders
- $220,404Black or African American householders
Household income for White non-Hispanic householders

Household income for Black householders

Household income for Two or more races householders

Foreign-born residents in Danby
102 residents are foreign born (2.4% Europe, 0.7% North America).
| This city: | 3.4% |
| New York: | 20.4% |
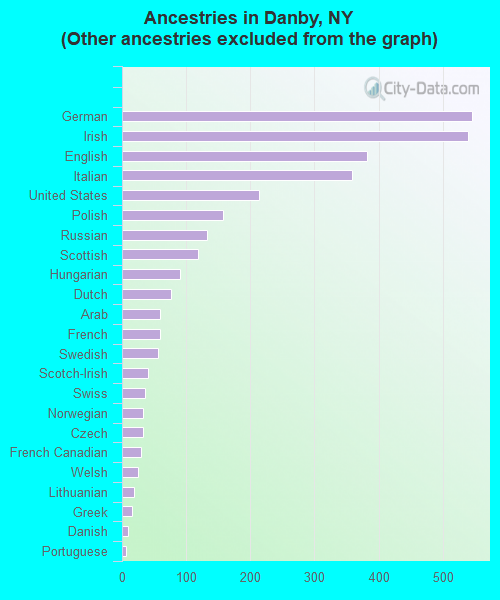
Ancestries in Danby

- 65617.8%Other
- 54514.8%German
- 53914.6%Irish
- 38210.4%English
- 3589.7%Italian
- 2135.8%United States
- 1574.3%Polish
- 1333.6%Russian
- 1193.2%Scottish
- 902.4%Hungarian
- 762.1%Dutch
- 591.6%Arab
- 591.6%French
- 561.5%Swedish
- 401.1%Scotch-Irish
- 361.0%Swiss
- 330.9%Norwegian
- 320.9%Czech
- 300.8%French Canadian
- 250.7%Welsh
- 180.5%Lithuanian
- 150.4%Greek
- 100.3%Danish
- 60.2%Portuguese
Zip codes: 14850.