Races in Canaan, New York (NY) Detailed Stats
Ancestries, Foreign-born residents, place of birth

Recent posts about races in Canaan, New York on our local forum with over 2,400,000 registered users:
 | Mineola Pro Palestine/Anti Israel Rally (39 replies) |
| Thoughts on Rye, Scarsdale, Purchase, Harrison, Armonk and Larchmont (100 replies) |
| Parking at Purdy's, Goldens Bridge, and Katonah stations (8 replies) |
| Fieldston (Riverdale) vs. Connecticut suburbs (14 replies) |
| Bedford Unified Schools (6 replies) |
| Why do people hate Staten Island? (326 replies) |
2.3% of Canaan, NY residents are foreign-born (1.3% born in Europe, 0.5% born in Latin America, 0.3% born in Asia), which is 853.3% less than the foreign-born rate of 22.0% across the entire state of New York.
Race distribution in Canaan

- 1,58487.0%White alone
- 1538.4%Black alone
- 412.3%Hispanic
- 191.0%Two or more races
- 120.7%Asian alone
- 50.3%Other race alone
- 60.3%American Indian alone

2000
2022
-
- 11,760,98162.0%White alone
- 2,867,58315.1%Hispanic
- 2,812,62314.8%Black alone
- 1,035,9265.5%Asian alone
- 366,1161.9%Two or more races
- 75,4990.4%Other race alone
- 52,4990.3%American Indian alone
- 5,2300.03%Native Hawaiian and Other
Pacific Islander alone

-
- 10,408,93352.9%White alone
- 3,867,29919.7%Hispanic
- 2,633,84013.4%Black alone
- 1,776,2869.0%Asian alone
- 732,6703.7%Two or more races
- 216,1101.1%Other race alone
- 35,0820.2%American Indian alone
- 6,9310.04%Native Hawaiian and Other
Pacific Islander alone

Income and house value in Canaan
- Median household income in 2022
- $93,151White non-Hispanic householders
- $51,361Black householders
- $55,376American Indian and Alaska Native householders
- $64,596Asian householders
- over $200,000Two or more races householders
- over $200,000Hispanic or Latino race householders
- Median 2022 house value
- $382,705White Non-Hispanic householders
- $299,196Black or African American householders
- $498,661Two or more races householders
- $498,661Hispanic or Latino householders
Household income for White non-Hispanic householders

Household income for Black householders

Household income for American Indian and Alaska Native householders

Household income for Asian householders

Household income for Two or more races householders

Household income for Hispanic or Latino race householders

Foreign-born residents in Canaan
42 residents are foreign born (1.3% Europe, 0.5% Latin America, 0.3% Asia).
| This city: | 2.3% |
| New York: | 20.4% |
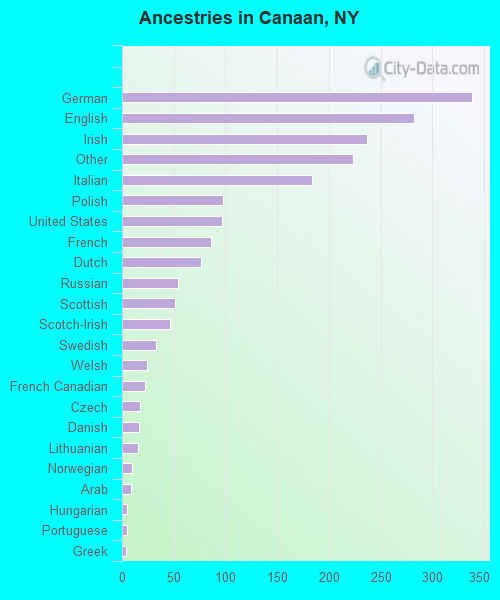
Ancestries in Canaan

- 33817.5%German
- 28214.6%English
- 23712.2%Irish
- 22311.5%Other
- 1849.5%Italian
- 985.1%Polish
- 975.0%United States
- 864.4%French
- 763.9%Dutch
- 542.8%Russian
- 512.6%Scottish
- 462.4%Scotch-Irish
- 331.7%Swedish
- 241.2%Welsh
- 221.1%French Canadian
- 170.9%Czech
- 160.8%Danish
- 150.8%Lithuanian
- 100.5%Norwegian
- 90.5%Arab
- 50.3%Hungarian
- 50.3%Portuguese
- 40.2%Greek
- 20.1%Swiss
- 10.05%Ukrainian
- 10.05%West Indian
Zip codes: 12029.