Races in Burke, Virginia (VA) Detailed Stats
Data:
Races - White alone (%)
Races - White alone (% change since 2000)
Races - Black alone (%)
Races - Black alone (% change since 2000)
Races - American Indian alone (%)
Races - American Indian alone (% change since 2000)
Races - Asian alone (%)
Races - Asian alone (% change since 2000)
Races - Hispanic (%)
Races - Hispanic (% change since 2000)
Races - Native Hawaiian and Other Pacific Islander alone (%)
Races - Native Hawaiian and Other Pacific Islander alone (% change since 2000)
Races - Two or more races(%)
Races - Two or more races(% change since 2000)
Races - Other race alone (%)
Races - Other race alone (% change since 2000)
Racial diversity
Place of birth - Born in state of residence (%)
Place of birth - Born in state of residence (%) - White
Place of birth - Born in state of residence (%) - Black or African American
Place of birth - Born in state of residence (%) - Asian
Place of birth - Born in state of residence (%) - Hispanic or Latino
Place of birth - Born in state of residence (%) - American Indian and Alaska Native
Place of birth - Born in state of residence (%) - Multirace
Place of birth - Born in state of residence (%) - Other Race
Place of birth - Born in other state (%)
Place of birth - Born in other state (%) - White
Place of birth - Born in other state (%) - Black or African American
Place of birth - Born in other state (%) - Asian
Place of birth - Born in other state (%) - Hispanic or Latino
Place of birth - Born in other state (%) - American Indian and Alaska Native
Place of birth - Born in other state (%) - Multirace
Place of birth - Born in other state (%) - Other Race
Place of birth - Native, outside of US (%)
Place of birth - Native, outside of US (%) - White
Place of birth - Native, outside of US (%) - Black or African American
Place of birth - Native, outside of US (%) - Asian
Place of birth - Native, outside of US (%) - Hispanic or Latino
Place of birth - Native, outside of US (%) - American Indian and Alaska Native
Place of birth - Native, outside of US (%) - Multirace
Place of birth - Native, outside of US (%) - Other Race
Place of birth - Foreign born (%)
Place of birth - Foreign born (%) - White
Place of birth - Foreign born (%) - Black or African American
Place of birth - Foreign born (%) - Asian
Place of birth - Foreign born (%) - Hispanic or Latino
Place of birth - Foreign born (%) - American Indian and Alaska Native
Place of birth - Foreign born (%) - Multirace
Place of birth - Foreign born (%) - Other Race
Residents speaking English at home (%)
Residents speaking English at home - Born in the United States (%)
Residents speaking English at home - Native, born elsewhere (%)
Residents speaking English at home - Foreign born (%)
Residents speaking Spanish at home (%)
Residents speaking Spanish at home - Born in the United States (%)
Residents speaking Spanish at home - Native, born elsewhere (%)
Residents speaking Spanish at home - Foreign born (%)
Residents speaking other language at home (%)
Residents speaking other language at home - Born in the United States (%)
Residents speaking other language at home - Native, born elsewhere (%)
Residents speaking other language at home - Foreign born (%)
Marital status - Never married (%)
Marital status - Now married (%)
Marital status - Separated (%)
Marital status - Widowed (%)
Marital status - Divorced (%)
Ancestries Reported - Arab (%)
Ancestries Reported - Czech (%)
Ancestries Reported - Danish (%)
Ancestries Reported - Dutch (%)
Ancestries Reported - English (%)
Ancestries Reported - French (%)
Ancestries Reported - French Canadian (%)
Ancestries Reported - German (%)
Ancestries Reported - Greek (%)
Ancestries Reported - Hungarian (%)
Ancestries Reported - Irish (%)
Ancestries Reported - Italian (%)
Ancestries Reported - Lithuanian (%)
Ancestries Reported - Norwegian (%)
Ancestries Reported - Polish (%)
Ancestries Reported - Portuguese (%)
Ancestries Reported - Russian (%)
Ancestries Reported - Scotch-Irish (%)
Ancestries Reported - Scottish (%)
Ancestries Reported - Slovak (%)
Ancestries Reported - Subsaharan African (%)
Ancestries Reported - Swedish (%)
Ancestries Reported - Swiss (%)
Ancestries Reported - Ukrainian (%)
Ancestries Reported - United States (%)
Ancestries Reported - Welsh (%)
Ancestries Reported - West Indian (%)
Ancestries Reported - Other (%)
Geographical mobility - Same house 1 year ago (%)
Geographical mobility - Same house 1 year ago (%) - White
Geographical mobility - Same house 1 year ago (%) - Black or African American
Geographical mobility - Same house 1 year ago (%) - Asian
Geographical mobility - Same house 1 year ago (%) - Hispanic or Latino
Geographical mobility - Same house 1 year ago (%) - American Indian and Alaska Native
Geographical mobility - Same house 1 year ago (%) - Multirace
Geographical mobility - Same house 1 year ago (%) - Other Race
Geographical mobility - Moved within same county (%)
Geographical mobility - Moved within same county (%) - White
Geographical mobility - Moved within same county (%) - Black or African American
Geographical mobility - Moved within same county (%) - Asian
Geographical mobility - Moved within same county (%) - Hispanic or Latino
Geographical mobility - Moved within same county (%) - American Indian and Alaska Native
Geographical mobility - Moved within same county (%) - Multirace
Geographical mobility - Moved within same county (%) - Other Race
Geographical mobility - Moved from different county within same state (%)
Geographical mobility - Moved from different county within same state (%) - White
Geographical mobility - Moved from different county within same state (%) - Black or African American
Geographical mobility - Moved from different county within same state (%) - Asian
Geographical mobility - Moved from different county within same state (%) - Hispanic or Latino
Geographical mobility - Moved from different county within same state (%) - American Indian and Alaska Native
Geographical mobility - Moved from different county within same state (%) - Multirace
Geographical mobility - Moved from different county within same state (%) - Other Race
Geographical mobility - Moved from different state (%)
Geographical mobility - Moved from different state (%) - White
Geographical mobility - Moved from different state (%) - Black or African American
Geographical mobility - Moved from different state (%) - Asian
Geographical mobility - Moved from different state (%) - Hispanic or Latino
Geographical mobility - Moved from different state (%) - American Indian and Alaska Native
Geographical mobility - Moved from different state (%) - Multirace
Geographical mobility - Moved from different state (%) - Other Race
Geographical mobility - Moved from abroad (%)
Geographical mobility - Moved from abroad (%) - White
Geographical mobility - Moved from abroad (%) - Black or African American
Geographical mobility - Moved from abroad (%) - Asian
Geographical mobility - Moved from abroad (%) - Hispanic or Latino
Geographical mobility - Moved from abroad (%) - American Indian and Alaska Native
Geographical mobility - Moved from abroad (%) - Multirace
Geographical mobility - Moved from abroad (%) - Other Race
Place of birth for the foreign-born population - Ireland (%)
Place of birth for the foreign-born population - Denmark (%)
Place of birth for the foreign-born population - Norway (%)
Place of birth for the foreign-born population - Sweden (%)
Place of birth for the foreign-born population - United Kingdom (%)
Place of birth for the foreign-born population - England (%)
Place of birth for the foreign-born population - Scotland (%)
Place of birth for the foreign-born population - Other Northern Europe (%)
Place of birth for the foreign-born population - Austria (%)
Place of birth for the foreign-born population - Belgium (%)
Place of birth for the foreign-born population - France (%)
Place of birth for the foreign-born population - Germany (%)
Place of birth for the foreign-born population - Netherlands (%)
Place of birth for the foreign-born population - Switzerland (%)
Place of birth for the foreign-born population - Other Western Europe (%)
Place of birth for the foreign-born population - Greece (%)
Place of birth for the foreign-born population - Italy (%)
Place of birth for the foreign-born population - Portugal (%)
Place of birth for the foreign-born population - Spain (%)
Place of birth for the foreign-born population - Other Southern Europe (%)
Place of birth for the foreign-born population - Albania (%)
Place of birth for the foreign-born population - Belarus (%)
Place of birth for the foreign-born population - Bosnia and Herzegovina (%)
Place of birth for the foreign-born population - Bulgaria (%)
Place of birth for the foreign-born population - Croatia (%)
Place of birth for the foreign-born population - Czechoslovakia (%)
Place of birth for the foreign-born population - Hungary (%)
Place of birth for the foreign-born population - Latvia (%)
Place of birth for the foreign-born population - Lithuania (%)
Place of birth for the foreign-born population - North Macedonia (Macedonia) (%)
Place of birth for the foreign-born population - Moldova (%)
Place of birth for the foreign-born population - Poland (%)
Place of birth for the foreign-born population - Romania (%)
Place of birth for the foreign-born population - Russia (%)
Place of birth for the foreign-born population - Serbia (%)
Place of birth for the foreign-born population - Ukraine (%)
Place of birth for the foreign-born population - Other Eastern Europe (%)
Place of birth for the foreign-born population - China (%)
Place of birth for the foreign-born population - Hong Kong (%)
Place of birth for the foreign-born population - Taiwan (%)
Place of birth for the foreign-born population - Japan (%)
Place of birth for the foreign-born population - Korea (%)
Place of birth for the foreign-born population - Other Eastern Asia (%)
Place of birth for the foreign-born population - Afghanistan (%)
Place of birth for the foreign-born population - Bangladesh (%)
Place of birth for the foreign-born population - India (%)
Place of birth for the foreign-born population - Iran (%)
Place of birth for the foreign-born population - Kazakhstan (%)
Place of birth for the foreign-born population - Nepal (%)
Place of birth for the foreign-born population - Pakistan (%)
Place of birth for the foreign-born population - Sri Lanka (%)
Place of birth for the foreign-born population - Uzbekistan (%)
Place of birth for the foreign-born population - Other South Central Asia (%)
Place of birth for the foreign-born population - Burma (%)
Place of birth for the foreign-born population - Cambodia (%)
Place of birth for the foreign-born population - Indonesia (%)
Place of birth for the foreign-born population - Laos (%)
Place of birth for the foreign-born population - Malaysia (%)
Place of birth for the foreign-born population - Philippines (%)
Place of birth for the foreign-born population - Singapore (%)
Place of birth for the foreign-born population - Thailand (%)
Place of birth for the foreign-born population - Vietnam (%)
Place of birth for the foreign-born population - Other South Eastern Asia (%)
Place of birth for the foreign-born population - Armenia (%)
Place of birth for the foreign-born population - Iraq (%)
Place of birth for the foreign-born population - Israel (%)
Place of birth for the foreign-born population - Jordan (%)
Place of birth for the foreign-born population - Kuwait (%)
Place of birth for the foreign-born population - Lebanon (%)
Place of birth for the foreign-born population - Saudi Arabia (%)
Place of birth for the foreign-born population - Syria (%)
Place of birth for the foreign-born population - Turkey (%)
Place of birth for the foreign-born population - Yemen (%)
Place of birth for the foreign-born population - Other Western Asia (%)
Place of birth for the foreign-born population - Eritrea (%)
Place of birth for the foreign-born population - Ethiopia (%)
Place of birth for the foreign-born population - Kenya (%)
Place of birth for the foreign-born population - Somalia (%)
Place of birth for the foreign-born population - Uganda (%)
Place of birth for the foreign-born population - Zimbabwe (%)
Place of birth for the foreign-born population - Other Eastern Africa (%)
Place of birth for the foreign-born population - Cameroon (%)
Place of birth for the foreign-born population - Congo (%)
Place of birth for the foreign-born population - Democratic Republic of Congo (Zaire) (%)
Place of birth for the foreign-born population - Other Middle Africa (%)
Place of birth for the foreign-born population - Egypt (%)
Place of birth for the foreign-born population - Morocco (%)
Place of birth for the foreign-born population - Sudan (%)
Place of birth for the foreign-born population - Other Northern Africa (%)
Place of birth for the foreign-born population - South Africa (%)
Place of birth for the foreign-born population - Other Southern Africa (%)
Place of birth for the foreign-born population - Cabo Verde (%)
Place of birth for the foreign-born population - Ghana (%)
Place of birth for the foreign-born population - Liberia (%)
Place of birth for the foreign-born population - Nigeria (%)
Place of birth for the foreign-born population - Senegal (%)
Place of birth for the foreign-born population - Sierra Leone (%)
Place of birth for the foreign-born population - Other Western Africa (%)
Place of birth for the foreign-born population - Australia (%)
Place of birth for the foreign-born population - New Zealand (%)
Place of birth for the foreign-born population - Fiji (%)
Place of birth for the foreign-born population - Micronesia (%)
Place of birth for the foreign-born population - Bahamas (%)
Place of birth for the foreign-born population - Barbados (%)
Place of birth for the foreign-born population - Cuba (%)
Place of birth for the foreign-born population - Dominica (%)
Place of birth for the foreign-born population - Dominican Republic (%)
Place of birth for the foreign-born population - Grenada (%)
Place of birth for the foreign-born population - Haiti (%)
Place of birth for the foreign-born population - Jamaica (%)
Place of birth for the foreign-born population - St. Vincent and the Grenadines (%)
Place of birth for the foreign-born population - Trinidad and Tobago (%)
Place of birth for the foreign-born population - West Indies (%)
Place of birth for the foreign-born population - Other Caribbean (%)
Place of birth for the foreign-born population - Belize (%)
Place of birth for the foreign-born population - Costa Rica (%)
Place of birth for the foreign-born population - El Salvador (%)
Place of birth for the foreign-born population - Guatemala (%)
Place of birth for the foreign-born population - Honduras (%)
Place of birth for the foreign-born population - Mexico (%)
Place of birth for the foreign-born population - Nicaragua (%)
Place of birth for the foreign-born population - Panama (%)
Place of birth for the foreign-born population - Other Central America (%)
Place of birth for the foreign-born population - Argentina (%)
Place of birth for the foreign-born population - Bolivia (%)
Place of birth for the foreign-born population - Brazil (%)
Place of birth for the foreign-born population - Chile (%)
Place of birth for the foreign-born population - Colombia (%)
Place of birth for the foreign-born population - Ecuador (%)
Place of birth for the foreign-born population - Guyana (%)
Place of birth for the foreign-born population - Peru (%)
Place of birth for the foreign-born population - Uruguay (%)
Place of birth for the foreign-born population - Venezuela (%)
Place of birth for the foreign-born population - Other South America (%)
Place of birth for the foreign-born population - Canada (%)
Place of birth for the foreign-born population - Other Northern America (%)
Place of birth for the foreign-born population - Other (%)
Latest news about races in Burke, VA collected exclusively by city-data.com from local newspapers, TV, and radio stations
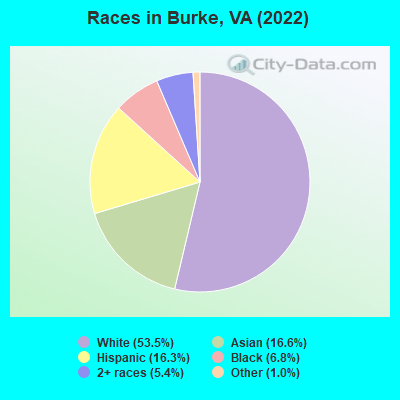
According to 2022 data, the most numerous races in Burke, VA are White alone (23,512 residents), Black alone (3,004 residents), and Hispanic (7,166 residents). 65.8% of Burke residents speak English at home. 25.3% of Burke, VA residents are foreign-born (13.6% born in Asia, 7.7% born in Latin America), which is 52.6% greater than the foreign-born rate of 12.0% across the entire state of Virginia.
Race distribution in Burke
2000 2022
40,354 69.9% White alone 8,443 14.6% Asian alone 4,291 7.4% Hispanic 2,856 4.9% Black alone 1,513 2.6% Two or more races 141 0.2% Other race alone 95 0.2% American Indian alone 44 0.08% Native Hawaiian and Other
23,512 53.5% White alone 7,317 16.6% Asian alone 7,166 16.3% Hispanic 3,004 6.8% Black alone 2,379 5.4% Two or more races 439 1.0% Other race alone 14 0.03% American Indian alone 11 0.03% Native Hawaiian and Other
2000 2022
4,965,637 70.2% White alone 1,376,378 19.4% Black alone 329,540 4.7% Hispanic 259,277 3.7% Asian alone 114,022 1.6% Two or more races 18,596 0.3% American Indian alone 11,685 0.2% Other race alone 3,380 0.05% Native Hawaiian and Other
5,095,130 58.7% White alone 1,594,785 18.4% Black alone 905,750 10.4% Hispanic 602,881 6.9% Asian alone 406,047 4.7% Two or more races 60,419 0.7% Other race alone 11,738 0.1% American Indian alone 6,869 0.08% Native Hawaiian and Other
Income and house value in Burke Median household income in 2022 $180,395 White non-Hispanic householders$160,126 Black householders$128,209 Asian householders$107,228 Some other race householders$195,872 Two or more races householders$132,693 Hispanic or Latino race householdersMedian 2022 house value $707,283 White Non-Hispanic householders$606,878 Black or African American householdersover $1,000,000 American Indian or Alaska Native householders $609,738 Asian householders$487,409 Some other race householders$553,181 Two or more races householders$516,959 Hispanic or Latino householders
Median age by race in Burke
42.0 Median age for White residents40.5 43.3 38.9 Median age for Black or African American residents35.9 40.5 62.4 Median age for American Indian / Alaska Native residents-964,539,006.1 -669,005,847.3 47.7 Median age for Asian residents44.1 50.3 45.5 Median age for Native Hawaiian / Pacific Islander residents-558,791,801.0 -584,518,166.9 28.2 Median age for Other race residents28.2 33.0 27.2 Median age for Two or more races residents27.8 26.6 42.5 Median age for White alone residents41.0 43.2 35.8 Median age for Hispanic or Latino residents33.0 38.2
Owner/renter occupied households by race in Burke
House owners and renters - White residents 7,987 89.6% Owner occupied922 10.4% Renter occupiedHouse owners and renters - Black or African American residents 641 79.8% Owner occupied162 20.2% Renter occupiedHouse owners and renters - American Indian / Alaska Native residents 16 50.2% Owner occupied16 49.8% Renter occupiedHouse owners and renters - Asian residents 2,119 90.3% Owner occupied226 9.7% Renter occupiedHouse owners and renters - Native Hawaiian / Pacific Islander residents 3 100.0% Owner occupiedHouse owners and renters - Other race residents 421 81.2% Owner occupied97 18.8% Renter occupiedHouse owners and renters - Two or more races residents 1,008 81.5% Owner occupied229 18.5% Renter occupiedHouse owners and renters - White alone residents 7,863 91.3% Owner occupied749 8.7% Renter occupiedHouse owners and renters - Hispanic or Latino residents 1,151 71.9% Owner occupied451 28.1% Renter occupied
Language usage in Burke
English speakers - Total 65.8% of residents of Burke speak English at home.
11.7% of residents speak Spanish at home 3,138 64.6% Speak English very well1,719 35.4% Speak English less than very well22.5% of residents speak other language at home 5,735 61.7% Speak English very well3,557 38.3% Speak English less than very well
English speakers - Born in the United States 90.5% of residents of Burke speak English at home.
4.8% of residents speak Spanish at home 780 91.9% Speak English very well69 8.1% Speak English less than very well4.6% of residents speak other language at home 690 83.7% Speak English very well134 16.3% Speak English less than very well
English speakers - Native, born elsewhere 67.0% of residents of Burke speak English at home.
15.3% of residents speak Spanish at home 163 80.3% Speak English very well40 19.7% Speak English less than very well17.0% of residents speak other language at home 208 92.4% Speak English very well17 7.6% Speak English less than very well
English speakers - Foreign-born 10.6% of residents of Burke speak English at home.
26.7% of residents speak Spanish at home 1,454 49.0% Speak English very well1,515 51.0% Speak English less than very well62.0% of residents speak other language at home 3,646 53.0% Speak English very well3,231 47.0% Speak English less than very well
White (Caucasian) - Speak only English Native:
91.9% (19,882)Foreign-born:
20.9% (389)
White (Caucasian) - Speak another language Native:
7.6% (1,654)Foreign-born:
77.4% (1,441)
Black or African American - Speak only English Native:
82.3% (1,551)Foreign-born:
10.9% (100)
Black or African American - Speak another language Native:
18.9% (357)Foreign-born:
86.1% (794)
Asian - Speak only English Native:
50.4% (953)Foreign-born:
9.5% (500)
Asian - Speak another language Native:
49.5% (936)Foreign-born:
90.0% (4,729)
Other race - Speak only English Native:
69.1% (764)Foreign-born:
8.4% (82)
Other race - Speak another language Native:
38.7% (428)Foreign-born:
91.7% (903)
Two or more races - Speak only English Native:
80.3% (2,898)Foreign-born:
3.7% (82)
Two or more races - Speak another language Native:
19.2% (693)Foreign-born:
96.3% (2,097)
White alone - Speak only English Native:
93.2% (19,367)Foreign-born:
24.7% (343)
White alone - Speak another language Native:
6.6% (1,376)Foreign-born:
74.8% (1,036)
Hispanic or Latino - Speak only English Native:
59.5% (2,093)Foreign-born:
4.3% (142)
Hispanic or Latino - Speak another language Native:
42.8% (1,505)Foreign-born:
95.7% (3,173)
Foreign-born residents in Burke 11,127 residents are foreign born (13.6% Asia , 7.7% Latin America ).
This city:
25.3%Virginia:
12.6%
Marital status for residents in Burke Marital status - White (Caucasian) population 15 years and over
Males 26.8% Never married65.8% Now married0.3% Separated2.1% Widowed5.1% DivorcedFemales 21.7% Never married64.8% Now married0.5% Separated5.3% Widowed7.7% DivorcedWomen who gave birth in the past 12 months Now married:
93.3% (198)Unmarried:
6.7% (14)
Women who did not give birth in the past 12 months Now married:
57.5% (2,851)Unmarried:
42.5% (2,104)
Marital status - Black or African American population 15 years and over
Males 39.2% Never married55.2% Now married1.4% Separated3.0% Widowed1.2% DivorcedFemales 26.8% Never married57.0% Now married0.0% Separated3.7% Widowed12.5% DivorcedWomen who gave birth in the past 12 months Now married:
100.0% (46)Unmarried:
0.0% (0)
Women who did not give birth in the past 12 months Now married:
47.3% (275)Unmarried:
52.7% (306)
Marital status - American Indian / Alaska Native population 15 years and over
Males 0.0% Never married47.8% Now married0.0% Separated0.0% Widowed52.2% DivorcedFemales 0.0% Never married100.0% Now married0.0% Separated0.0% Widowed0.0% DivorcedWomen who did not give birth in the past 12 months Now married:
100.0% (19)Unmarried:
0.0% (0)
Marital status - Asian population 15 years and over
Males 32.9% Never married63.8% Now married0.7% Separated1.3% Widowed1.3% DivorcedFemales 20.3% Never married68.7% Now married0.6% Separated7.1% Widowed3.3% DivorcedWomen who gave birth in the past 12 months Now married:
100.0% (119)Unmarried:
0.0% (0)
Women who did not give birth in the past 12 months Now married:
57.6% (871)Unmarried:
42.4% (640)
Marital status - Native Hawaiian / Pacific Islander population 15 years and over
Males 0.0% Never married0.0% Now married0.0% Separated0.0% Widowed100.0% DivorcedFemales 66.7% Never married33.3% Now married0.0% Separated0.0% Widowed0.0% DivorcedWomen who did not give birth in the past 12 months Now married:
33.3% (3)Unmarried:
66.7% (6)
Marital status - Other race population 15 years and over
Males 29.4% Never married70.6% Now married0.0% Separated0.0% Widowed0.0% DivorcedFemales 18.1% Never married62.6% Now married0.0% Separated5.0% Widowed14.2% DivorcedWomen who did not give birth in the past 12 months Now married:
44.8% (155)Unmarried:
55.2% (191)
Marital status - Two or more races population 15 years and over
Males 39.2% Never married56.1% Now married1.5% Separated0.3% Widowed2.9% DivorcedFemales 42.2% Never married42.3% Now married0.6% Separated1.3% Widowed13.7% DivorcedWomen who gave birth in the past 12 months Now married:
73.2% (55)Unmarried:
26.8% (20)
Women who did not give birth in the past 12 months Now married:
29.1% (461)Unmarried:
70.9% (1,123)
Marital status - White alone, not Hispanic / Latino population 15 years and over
Males 26.3% Never married66.1% Now married0.2% Separated2.3% Widowed5.2% DivorcedFemales 21.3% Never married65.2% Now married0.3% Separated5.4% Widowed7.7% DivorcedWomen who gave birth in the past 12 months Now married:
96.2% (199)Unmarried:
3.8% (8)
Women who did not give birth in the past 12 months Now married:
57.5% (2,707)Unmarried:
42.5% (2,005)
Marital status - Hispanic or Latino population 15 years and over
Males 31.2% Never married64.3% Now married1.4% Separated0.2% Widowed2.9% DivorcedFemales 29.5% Never married54.9% Now married1.4% Separated3.0% Widowed11.2% DivorcedWomen who gave birth in the past 12 months Now married:
65.7% (44)Unmarried:
34.3% (23)
Women who did not give birth in the past 12 months Now married:
41.2% (650)Unmarried:
58.8% (929)
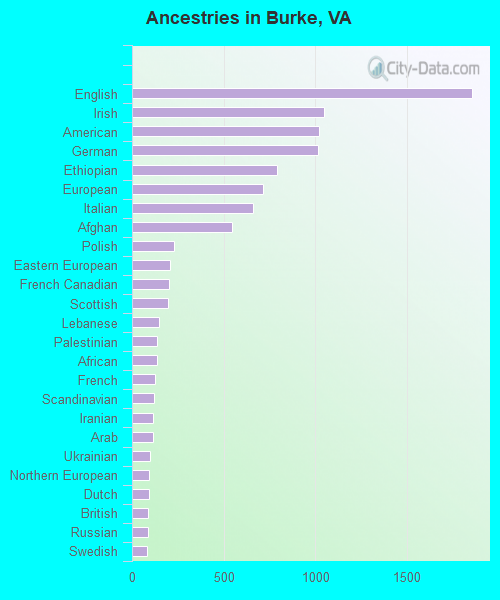
Ancestries in Burke
1,857 8.3% English1,051 4.7% Irish1,020 4.6% American1,016 4.5% German792 3.5% Ethiopian717 3.2% European663 3.0% Italian548 2.5% Afghan231 1.0% Polish209 0.9% Eastern European200 0.9% French Canadian198 0.9% Scottish148 0.7% Lebanese136 0.6% Palestinian134 0.6% African128 0.6% French120 0.5% Scandinavian117 0.5% Iranian112 0.5% Arab100 0.4% Ukrainian93 0.4% Northern European91 0.4% Dutch86 0.4% British85 0.4% Russian84 0.4% Swedish82 0.4% Moroccan76 0.3% Greek65 0.3% Egyptian62 0.3% Jordanian62 0.3% Syrian55 0.2% Norwegian53 0.2% Somali50 0.2% Scotch-Irish50 0.2% Lithuanian48 0.2% Ugandan46 0.2% Iraqi45 0.2% Ghanaian34 0.2% Sierra Leonean31 0.1% Danish25 0.1% Belgian20 0.09% Latvian20 0.09% Jamaican19 0.08% Czech19 0.08% Welsh18 0.08% Brazilian18 0.08% Canadian16 0.07% Albanian16 0.07% Serbian14 0.06% Slovak13 0.06% Hungarian11 0.05% Romanian10 0.04% Israeli9 0.04% Czechoslovakian9 0.04% Turkish9 0.04% Barbadian9 0.04% Portuguese5 0.02% Luxembourger5 0.02% Haitian3 0.01% Bulgarian
Geographical mobility in Burke Same house 1 year ago 21,835 89.3% White (Caucasian)2,781 91.2% Black or African American43 96.1% American Indian / Alaska Native6,319 86.7% Asian14 95.3% Native Hawaiian / Pacific Islander1,807 85.5% Other race5,081 82.3% Two or more races20,936 89.6% White alone, not Hispanic / Latino5,993 84.8% Hispanic or LatinoMoved within same county 1,311 5.4% White / Caucasian29 0.9% Black or African American353 4.9% Asian162 7.7% Other race581 9.4% Two or more races1,261 5.4% White alone, not Hispanic / Latino572 8.1% Hispanic or LatinoMoved within same state 483 2.0% White / Caucasian125 4.1% Black or African American311 4.3% Asian71 3.4% Other race124 2.0% Two or more races511 2.2% White alone, not Hispanic / Latino125 1.8% Hispanic or LatinoMoved from different state 602 2.5% White / Caucasian66 2.2% Black or African American128 1.8% Asian225 3.6% Two or more races527 2.3% White alone, not Hispanic / Latino156 2.2% Hispanic or LatinoMoved from abroad 185 0.8% White47 1.5% Black or African American167 2.3% Asian22 1.1% Other race120 1.9% Two or more races113 0.5% White alone, not Hispanic / Latino194 2.7% Hispanic or Latino
Children Nativity (place of birth) in Burke
Children under 6 years - Living with two parents Both parents native 1,845 100.0% NativeBoth parents foreign-born 600 92.5% Native48 7.5% Foreign-bornOne native, one foreign-born parent 480 100.0% NativeChildren under 6 years - Living with one parent Native parent 223 100.0% NativeForeign-born parent 54 100.0% NativeChildren 6 to 17 years - Living with two parents Both parents native 3,658 99.5% Native19 0.5% Foreign-bornBoth parents foreign-born 991 68.0% Native467 32.0% Foreign-bornOne native, one foreign-born parent 1,036 98.6% Native15 1.4% Foreign-bornChildren 6 to 17 years - Living with one parent Native parent 1,061 100.0% NativeForeign-born parent 543 53.9% Native464 46.1% Foreign-born
Place of birth for residents in Burke 5,981 Asia3,478 Americas3,396 Latin America2,696 Eastern Asia2,300 South America1,690 South Central Asia1,081 South Eastern Asia1,079 Africa1,036 Central America957 China728 Eastern Africa560 Europe512 Western Asia192 Western Europe167 Eastern Europe153 Northern Europe153 Northern Africa122 Western Africa81 Northern America65 Southern Africa59 Caribbean47 Southern Europe27 Oceania27 Australia and New Zealand Subregion1,621 Korea1,104 Peru829 Bolivia761 Vietnam646 El Salvador628 India621 China552 Ethiopia419 Afghanistan241 Taiwan222 Philippines185 Honduras165 Colombia161 Bangladesh156 Lebanon151 Pakistan139 Iraq138 Guatemala123 Iran117 Eritrea113 Uzbekistan111 Germany96 Morocco94 Hong Kong86 Jordan81 Canada78 Argentina70 United Arab Emirates69 Chile66 Japan65 South Africa59 Ukraine58 Thailand50 Dominican Republic50 Sierra Leone47 Ireland44 Sri Lanka43 Egypt40 England40 Netherlands38 Ghana37 Uganda37 Brazil36 United Kingdom36 Costa Rica35 Poland27 Australia26 Nepal25 Indonesia23 Russia22 Syria19 Italy18 Scotland17 Latvia17 Greece17 France16 Togo15 Czechoslovakia15 Kazakhstan14 Ecuador13 Israel12 Turkey10 Kenya10 Nicaragua10 Nigeria9 Singapore9 Panama9 Spain9 Somalia9 Yemen8 Norway8 Switzerland8 Mexico7 Belgium7 Sudan5 Barbados4 Algeria4 Romania2 Malaysia2 Jamaica
Grandparents responsible for own grandchildren in Burke
Grandparents (30 to 59 years) White / Caucasian 17 100.0% Not responsible for grandchildrenBlack or African American 56 100.0% Not responsible for grandchildrenAsian 35 100.0% Responsible for grandchildrenOther race 9 100.0% Not responsible for grandchildrenTwo or more races 69 100.0% Not responsible for grandchildrenWhite alone, not Hispanic / Latino 39 100.0% Not responsible for grandchildrenHispanic or Latino 46 100.0% Not responsible for grandchildrenGrandparents (60 years and over) White / Caucasian 22 14.4% Responsible for grandchildren133 85.6% Not responsible for grandchildrenBlack or African American 16 19.5% Responsible for grandchildren67 80.5% Not responsible for grandchildrenAsian 16 10.4% Responsible for grandchildren140 89.6% Not responsible for grandchildrenOther race 9 100.0% Not responsible for grandchildrenTwo or more races 382 100.0% Not responsible for grandchildrenWhite alone, not Hispanic / Latino 25 17.6% Responsible for grandchildren115 82.4% Not responsible for grandchildrenHispanic or Latino 304 100.0% Not responsible for grandchildren