Races in Big Lake, Minnesota (MN) Detailed Stats
Data:
Races - White alone (%)
Races - White alone (% change since 2000)
Races - Black alone (%)
Races - Black alone (% change since 2000)
Races - American Indian alone (%)
Races - American Indian alone (% change since 2000)
Races - Asian alone (%)
Races - Asian alone (% change since 2000)
Races - Hispanic (%)
Races - Hispanic (% change since 2000)
Races - Native Hawaiian and Other Pacific Islander alone (%)
Races - Native Hawaiian and Other Pacific Islander alone (% change since 2000)
Races - Two or more races(%)
Races - Two or more races(% change since 2000)
Races - Other race alone (%)
Races - Other race alone (% change since 2000)
Racial diversity
Place of birth - Born in state of residence (%)
Place of birth - Born in state of residence (%) - White
Place of birth - Born in state of residence (%) - Black or African American
Place of birth - Born in state of residence (%) - Asian
Place of birth - Born in state of residence (%) - Hispanic or Latino
Place of birth - Born in state of residence (%) - American Indian and Alaska Native
Place of birth - Born in state of residence (%) - Multirace
Place of birth - Born in state of residence (%) - Other Race
Place of birth - Born in other state (%)
Place of birth - Born in other state (%) - White
Place of birth - Born in other state (%) - Black or African American
Place of birth - Born in other state (%) - Asian
Place of birth - Born in other state (%) - Hispanic or Latino
Place of birth - Born in other state (%) - American Indian and Alaska Native
Place of birth - Born in other state (%) - Multirace
Place of birth - Born in other state (%) - Other Race
Place of birth - Native, outside of US (%)
Place of birth - Native, outside of US (%) - White
Place of birth - Native, outside of US (%) - Black or African American
Place of birth - Native, outside of US (%) - Asian
Place of birth - Native, outside of US (%) - Hispanic or Latino
Place of birth - Native, outside of US (%) - American Indian and Alaska Native
Place of birth - Native, outside of US (%) - Multirace
Place of birth - Native, outside of US (%) - Other Race
Place of birth - Foreign born (%)
Place of birth - Foreign born (%) - White
Place of birth - Foreign born (%) - Black or African American
Place of birth - Foreign born (%) - Asian
Place of birth - Foreign born (%) - Hispanic or Latino
Place of birth - Foreign born (%) - American Indian and Alaska Native
Place of birth - Foreign born (%) - Multirace
Place of birth - Foreign born (%) - Other Race
Residents speaking English at home (%)
Residents speaking English at home - Born in the United States (%)
Residents speaking English at home - Native, born elsewhere (%)
Residents speaking English at home - Foreign born (%)
Residents speaking Spanish at home (%)
Residents speaking Spanish at home - Born in the United States (%)
Residents speaking Spanish at home - Native, born elsewhere (%)
Residents speaking Spanish at home - Foreign born (%)
Residents speaking other language at home (%)
Residents speaking other language at home - Born in the United States (%)
Residents speaking other language at home - Native, born elsewhere (%)
Residents speaking other language at home - Foreign born (%)
Marital status - Never married (%)
Marital status - Now married (%)
Marital status - Separated (%)
Marital status - Widowed (%)
Marital status - Divorced (%)
Ancestries Reported - Arab (%)
Ancestries Reported - Czech (%)
Ancestries Reported - Danish (%)
Ancestries Reported - Dutch (%)
Ancestries Reported - English (%)
Ancestries Reported - French (%)
Ancestries Reported - French Canadian (%)
Ancestries Reported - German (%)
Ancestries Reported - Greek (%)
Ancestries Reported - Hungarian (%)
Ancestries Reported - Irish (%)
Ancestries Reported - Italian (%)
Ancestries Reported - Lithuanian (%)
Ancestries Reported - Norwegian (%)
Ancestries Reported - Polish (%)
Ancestries Reported - Portuguese (%)
Ancestries Reported - Russian (%)
Ancestries Reported - Scotch-Irish (%)
Ancestries Reported - Scottish (%)
Ancestries Reported - Slovak (%)
Ancestries Reported - Subsaharan African (%)
Ancestries Reported - Swedish (%)
Ancestries Reported - Swiss (%)
Ancestries Reported - Ukrainian (%)
Ancestries Reported - United States (%)
Ancestries Reported - Welsh (%)
Ancestries Reported - West Indian (%)
Ancestries Reported - Other (%)
Geographical mobility - Same house 1 year ago (%)
Geographical mobility - Same house 1 year ago (%) - White
Geographical mobility - Same house 1 year ago (%) - Black or African American
Geographical mobility - Same house 1 year ago (%) - Asian
Geographical mobility - Same house 1 year ago (%) - Hispanic or Latino
Geographical mobility - Same house 1 year ago (%) - American Indian and Alaska Native
Geographical mobility - Same house 1 year ago (%) - Multirace
Geographical mobility - Same house 1 year ago (%) - Other Race
Geographical mobility - Moved within same county (%)
Geographical mobility - Moved within same county (%) - White
Geographical mobility - Moved within same county (%) - Black or African American
Geographical mobility - Moved within same county (%) - Asian
Geographical mobility - Moved within same county (%) - Hispanic or Latino
Geographical mobility - Moved within same county (%) - American Indian and Alaska Native
Geographical mobility - Moved within same county (%) - Multirace
Geographical mobility - Moved within same county (%) - Other Race
Geographical mobility - Moved from different county within same state (%)
Geographical mobility - Moved from different county within same state (%) - White
Geographical mobility - Moved from different county within same state (%) - Black or African American
Geographical mobility - Moved from different county within same state (%) - Asian
Geographical mobility - Moved from different county within same state (%) - Hispanic or Latino
Geographical mobility - Moved from different county within same state (%) - American Indian and Alaska Native
Geographical mobility - Moved from different county within same state (%) - Multirace
Geographical mobility - Moved from different county within same state (%) - Other Race
Geographical mobility - Moved from different state (%)
Geographical mobility - Moved from different state (%) - White
Geographical mobility - Moved from different state (%) - Black or African American
Geographical mobility - Moved from different state (%) - Asian
Geographical mobility - Moved from different state (%) - Hispanic or Latino
Geographical mobility - Moved from different state (%) - American Indian and Alaska Native
Geographical mobility - Moved from different state (%) - Multirace
Geographical mobility - Moved from different state (%) - Other Race
Geographical mobility - Moved from abroad (%)
Geographical mobility - Moved from abroad (%) - White
Geographical mobility - Moved from abroad (%) - Black or African American
Geographical mobility - Moved from abroad (%) - Asian
Geographical mobility - Moved from abroad (%) - Hispanic or Latino
Geographical mobility - Moved from abroad (%) - American Indian and Alaska Native
Geographical mobility - Moved from abroad (%) - Multirace
Geographical mobility - Moved from abroad (%) - Other Race
Place of birth for the foreign-born population - Ireland (%)
Place of birth for the foreign-born population - Denmark (%)
Place of birth for the foreign-born population - Norway (%)
Place of birth for the foreign-born population - Sweden (%)
Place of birth for the foreign-born population - United Kingdom (%)
Place of birth for the foreign-born population - England (%)
Place of birth for the foreign-born population - Scotland (%)
Place of birth for the foreign-born population - Other Northern Europe (%)
Place of birth for the foreign-born population - Austria (%)
Place of birth for the foreign-born population - Belgium (%)
Place of birth for the foreign-born population - France (%)
Place of birth for the foreign-born population - Germany (%)
Place of birth for the foreign-born population - Netherlands (%)
Place of birth for the foreign-born population - Switzerland (%)
Place of birth for the foreign-born population - Other Western Europe (%)
Place of birth for the foreign-born population - Greece (%)
Place of birth for the foreign-born population - Italy (%)
Place of birth for the foreign-born population - Portugal (%)
Place of birth for the foreign-born population - Spain (%)
Place of birth for the foreign-born population - Other Southern Europe (%)
Place of birth for the foreign-born population - Albania (%)
Place of birth for the foreign-born population - Belarus (%)
Place of birth for the foreign-born population - Bosnia and Herzegovina (%)
Place of birth for the foreign-born population - Bulgaria (%)
Place of birth for the foreign-born population - Croatia (%)
Place of birth for the foreign-born population - Czechoslovakia (%)
Place of birth for the foreign-born population - Hungary (%)
Place of birth for the foreign-born population - Latvia (%)
Place of birth for the foreign-born population - Lithuania (%)
Place of birth for the foreign-born population - North Macedonia (Macedonia) (%)
Place of birth for the foreign-born population - Moldova (%)
Place of birth for the foreign-born population - Poland (%)
Place of birth for the foreign-born population - Romania (%)
Place of birth for the foreign-born population - Russia (%)
Place of birth for the foreign-born population - Serbia (%)
Place of birth for the foreign-born population - Ukraine (%)
Place of birth for the foreign-born population - Other Eastern Europe (%)
Place of birth for the foreign-born population - China (%)
Place of birth for the foreign-born population - Hong Kong (%)
Place of birth for the foreign-born population - Taiwan (%)
Place of birth for the foreign-born population - Japan (%)
Place of birth for the foreign-born population - Korea (%)
Place of birth for the foreign-born population - Other Eastern Asia (%)
Place of birth for the foreign-born population - Afghanistan (%)
Place of birth for the foreign-born population - Bangladesh (%)
Place of birth for the foreign-born population - India (%)
Place of birth for the foreign-born population - Iran (%)
Place of birth for the foreign-born population - Kazakhstan (%)
Place of birth for the foreign-born population - Nepal (%)
Place of birth for the foreign-born population - Pakistan (%)
Place of birth for the foreign-born population - Sri Lanka (%)
Place of birth for the foreign-born population - Uzbekistan (%)
Place of birth for the foreign-born population - Other South Central Asia (%)
Place of birth for the foreign-born population - Burma (%)
Place of birth for the foreign-born population - Cambodia (%)
Place of birth for the foreign-born population - Indonesia (%)
Place of birth for the foreign-born population - Laos (%)
Place of birth for the foreign-born population - Malaysia (%)
Place of birth for the foreign-born population - Philippines (%)
Place of birth for the foreign-born population - Singapore (%)
Place of birth for the foreign-born population - Thailand (%)
Place of birth for the foreign-born population - Vietnam (%)
Place of birth for the foreign-born population - Other South Eastern Asia (%)
Place of birth for the foreign-born population - Armenia (%)
Place of birth for the foreign-born population - Iraq (%)
Place of birth for the foreign-born population - Israel (%)
Place of birth for the foreign-born population - Jordan (%)
Place of birth for the foreign-born population - Kuwait (%)
Place of birth for the foreign-born population - Lebanon (%)
Place of birth for the foreign-born population - Saudi Arabia (%)
Place of birth for the foreign-born population - Syria (%)
Place of birth for the foreign-born population - Turkey (%)
Place of birth for the foreign-born population - Yemen (%)
Place of birth for the foreign-born population - Other Western Asia (%)
Place of birth for the foreign-born population - Eritrea (%)
Place of birth for the foreign-born population - Ethiopia (%)
Place of birth for the foreign-born population - Kenya (%)
Place of birth for the foreign-born population - Somalia (%)
Place of birth for the foreign-born population - Uganda (%)
Place of birth for the foreign-born population - Zimbabwe (%)
Place of birth for the foreign-born population - Other Eastern Africa (%)
Place of birth for the foreign-born population - Cameroon (%)
Place of birth for the foreign-born population - Congo (%)
Place of birth for the foreign-born population - Democratic Republic of Congo (Zaire) (%)
Place of birth for the foreign-born population - Other Middle Africa (%)
Place of birth for the foreign-born population - Egypt (%)
Place of birth for the foreign-born population - Morocco (%)
Place of birth for the foreign-born population - Sudan (%)
Place of birth for the foreign-born population - Other Northern Africa (%)
Place of birth for the foreign-born population - South Africa (%)
Place of birth for the foreign-born population - Other Southern Africa (%)
Place of birth for the foreign-born population - Cabo Verde (%)
Place of birth for the foreign-born population - Ghana (%)
Place of birth for the foreign-born population - Liberia (%)
Place of birth for the foreign-born population - Nigeria (%)
Place of birth for the foreign-born population - Senegal (%)
Place of birth for the foreign-born population - Sierra Leone (%)
Place of birth for the foreign-born population - Other Western Africa (%)
Place of birth for the foreign-born population - Australia (%)
Place of birth for the foreign-born population - New Zealand (%)
Place of birth for the foreign-born population - Fiji (%)
Place of birth for the foreign-born population - Micronesia (%)
Place of birth for the foreign-born population - Bahamas (%)
Place of birth for the foreign-born population - Barbados (%)
Place of birth for the foreign-born population - Cuba (%)
Place of birth for the foreign-born population - Dominica (%)
Place of birth for the foreign-born population - Dominican Republic (%)
Place of birth for the foreign-born population - Grenada (%)
Place of birth for the foreign-born population - Haiti (%)
Place of birth for the foreign-born population - Jamaica (%)
Place of birth for the foreign-born population - St. Vincent and the Grenadines (%)
Place of birth for the foreign-born population - Trinidad and Tobago (%)
Place of birth for the foreign-born population - West Indies (%)
Place of birth for the foreign-born population - Other Caribbean (%)
Place of birth for the foreign-born population - Belize (%)
Place of birth for the foreign-born population - Costa Rica (%)
Place of birth for the foreign-born population - El Salvador (%)
Place of birth for the foreign-born population - Guatemala (%)
Place of birth for the foreign-born population - Honduras (%)
Place of birth for the foreign-born population - Mexico (%)
Place of birth for the foreign-born population - Nicaragua (%)
Place of birth for the foreign-born population - Panama (%)
Place of birth for the foreign-born population - Other Central America (%)
Place of birth for the foreign-born population - Argentina (%)
Place of birth for the foreign-born population - Bolivia (%)
Place of birth for the foreign-born population - Brazil (%)
Place of birth for the foreign-born population - Chile (%)
Place of birth for the foreign-born population - Colombia (%)
Place of birth for the foreign-born population - Ecuador (%)
Place of birth for the foreign-born population - Guyana (%)
Place of birth for the foreign-born population - Peru (%)
Place of birth for the foreign-born population - Uruguay (%)
Place of birth for the foreign-born population - Venezuela (%)
Place of birth for the foreign-born population - Other South America (%)
Place of birth for the foreign-born population - Canada (%)
Place of birth for the foreign-born population - Other Northern America (%)
Place of birth for the foreign-born population - Other (%)
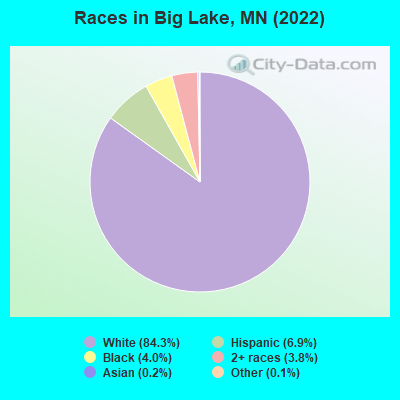
According to 2022 data, the most numerous races in Big Lake, MN are White alone (10,308 residents), Black alone (493 residents), and Hispanic (847 residents). 96.2% of Big Lake residents speak English at home. 2.4% of Big Lake, MN residents are foreign-born (1.5% born in Latin America, 0.3% born in Asia, 0.3% born in Europe), which is 239.5% less than the foreign-born rate of 8.0% across the entire state of Minnesota.
Race distribution in Big Lake
2000 2022
4,337,143 88.2% White alone 168,813 3.4% Black alone 143,382 2.9% Hispanic 141,083 2.9% Asian alone 70,304 1.4% Two or more races 52,009 1.1% American Indian alone 5,031 0.1% Other race alone 1,714 0.03% Native Hawaiian and Other
4,356,347 76.2% White alone 395,179 6.9% Black alone 333,830 5.8% Hispanic 294,800 5.2% Asian alone 259,649 4.5% Two or more races 42,125 0.7% American Indian alone 32,976 0.6% Other race alone 2,278 0.04% Native Hawaiian and Other
Income and house value in Big Lake Median household income in 2022 $96,818 White non-Hispanic householdersover $200,000 Black householders$121,238 Some other race householders$171,942 Two or more races householders$91,044 Hispanic or Latino race householdersMedian 2022 house value $301,001 White Non-Hispanic householders$395,414 American Indian or Alaska Native householders $334,581 Asian householders$133,832 Two or more races householders
Median age by race in Big Lake
33.4 Median age for White residents31.7 35.5 17.4 Median age for Black or African American residents17.2 37.4 7.0 Median age for American Indian / Alaska Native residents35.3 -677,852,348.3 -892,405,062.4 Median age for Asian residents-699,561,402.8 -1,008,363,200.9 -666,666,666.0 Median age for Native Hawaiian / Pacific Islander residents-666,666,666.0 -666,666,666.0 36.0 Median age for Other race residents32.1 28.7 21.6 Median age for Two or more races residents24.1 20.5 33.7 Median age for White alone residents31.5 35.5 24.0 Median age for Hispanic or Latino residents22.8 43.9
Owner/renter occupied households by race in Big Lake
House owners and renters - White residents 3,147 86.8% Owner occupied481 13.2% Renter occupiedHouse owners and renters - Black or African American residents 102 100.0% Owner occupiedHouse owners and renters - American Indian / Alaska Native residents 6 100.0% Owner occupiedHouse owners and renters - Asian residents 11 100.0% Renter occupiedHouse owners and renters - Other race residents 146 100.0% Owner occupiedHouse owners and renters - Two or more races residents 59 72.6% Owner occupied22 27.4% Renter occupiedHouse owners and renters - White alone residents 3,122 86.7% Owner occupied481 13.3% Renter occupiedHouse owners and renters - Hispanic or Latino residents 153 100.0% Owner occupied
Language usage in Big Lake
English speakers - Total 96.2% of residents of Big Lake speak English at home.
4.3% of residents speak Spanish at home 318 64.5% Speak English very well175 35.5% Speak English less than very well0.3% of residents speak other language at home 35 100.0% Speak English very well
English speakers - Born in the United States 96.5% of residents of Big Lake speak English at home.
3.6% of residents speak Spanish at home 73 100.0% Speak English very well
English speakers - Native, born elsewhere 61.0% of residents of Big Lake speak English at home.
8.5% of residents speak Spanish at home 12 100.0% Speak English very well
English speakers - Foreign-born 48.3% of residents of Big Lake speak English at home.
53.9% of residents speak Spanish at home 39 27.1% Speak English very well105 72.9% Speak English less than very well6.7% of residents speak other language at home 18 100.0% Speak English very well
White (Caucasian) - Speak only English Native:
98.9% (9,582)Foreign-born:
100.0% (68)
White (Caucasian) - Speak another language Native:
1.1% (111)Foreign-born:
10.7% (7)
Black or African American - Speak only English Native:
94.1% (334)Foreign-born:
92.3% (13)
American Indian / Alaska Native - Speak only English Native:
100.0% (34)Foreign-born:
62.1% (5)
Other race - Speak only English Native:
42.8% (48)Foreign-born:
11.4% (23)
Other race - Speak another language Native:
56.2% (64)Foreign-born:
88.1% (180)
White alone - Speak only English Native:
99.3% (9,486)Foreign-born:
100.0% (71)
White alone - Speak another language Native:
0.6% (60)Foreign-born:
14.2% (10)
Hispanic or Latino - Speak only English Native:
80.5% (395)Foreign-born:
12.3% (21)
Hispanic or Latino - Speak another language Native:
21.4% (105)Foreign-born:
87.5% (148)
Foreign-born residents in Big Lake 288 residents are foreign born (1.5% Latin America , 0.3% Asia , 0.3% Europe ).
This city:
2.4%Minnesota:
8.5%
Marital status for residents in Big Lake Marital status - White (Caucasian) population 15 years and over
Males 38.6% Never married49.1% Now married0.5% Separated1.0% Widowed10.9% DivorcedFemales 29.8% Never married43.7% Now married5.3% Separated8.6% Widowed12.5% DivorcedWomen who gave birth in the past 12 months Now married:
68.1% (77)Unmarried:
31.9% (36)
Women who did not give birth in the past 12 months Now married:
53.0% (1,384)Unmarried:
47.0% (1,226)
Marital status - Black or African American population 15 years and over
Males 74.3% Never married25.7% Now married0.0% Separated0.0% Widowed0.0% DivorcedFemales 18.0% Never married82.0% Now married0.0% Separated0.0% Widowed0.0% DivorcedWomen who did not give birth in the past 12 months Now married:
35.1% (13)Unmarried:
64.9% (25)
Marital status - Other race population 15 years and over
Males 4.8% Never married95.2% Now married0.0% Separated0.0% Widowed0.0% DivorcedFemales 47.0% Never married18.8% Now married0.0% Separated0.0% Widowed34.2% DivorcedWomen who did not give birth in the past 12 months Now married:
14.6% (16)Unmarried:
85.4% (92)
Marital status - Two or more races population 15 years and over
Males 61.0% Never married31.5% Now married0.0% Separated0.0% Widowed7.5% DivorcedFemales 32.0% Never married68.0% Now married0.0% Separated0.0% Widowed0.0% DivorcedWomen who gave birth in the past 12 months Now married:
100.0% (27)Unmarried:
0.0% (0)
Women who did not give birth in the past 12 months Now married:
44.3% (66)Unmarried:
55.7% (83)
Marital status - White alone, not Hispanic / Latino population 15 years and over
Males 38.9% Never married49.0% Now married0.5% Separated1.0% Widowed10.6% DivorcedFemales 29.9% Never married43.8% Now married5.4% Separated8.6% Widowed12.3% DivorcedWomen who gave birth in the past 12 months Now married:
68.1% (77)Unmarried:
31.9% (36)
Women who did not give birth in the past 12 months Now married:
53.2% (1,387)Unmarried:
46.8% (1,219)
Marital status - Hispanic or Latino population 15 years and over
Males 26.2% Never married64.6% Now married0.0% Separated0.0% Widowed9.2% DivorcedFemales 34.4% Never married42.1% Now married0.0% Separated0.0% Widowed23.6% DivorcedWomen who did not give birth in the past 12 months Now married:
22.7% (31)Unmarried:
77.3% (106)
Ancestries in Big Lake
1,032 29.8% German353 10.2% American337 9.7% Norwegian219 6.3% English185 5.3% Swedish157 4.5% Polish89 2.6% Italian85 2.5% Irish71 2.0% French30 0.9% European12 0.3% Canadian11 0.3% Czech10 0.3% Finnish9 0.3% Scandinavian5 0.1% African
Children Nativity (place of birth) in Big Lake
Children under 6 years - Living with two parents Both parents native 773 100.0% NativeChildren under 6 years - Living with one parent Native parent 314 100.0% Native
Children 6 to 17 years - Living with two parents Both parents native 1,201 100.0% NativeBoth parents foreign-born 19 100.0% NativeOne native, one foreign-born parent 5 100.0% NativeChildren 6 to 17 years - Living with one parent Native parent 1,101 100.0% Native
Grandparents responsible for own grandchildren in Big Lake
Grandparents (30 to 59 years) White / Caucasian 64 26.4% Responsible for grandchildren178 73.6% Not responsible for grandchildrenWhite alone, not Hispanic / Latino 64 26.4% Responsible for grandchildren178 73.6% Not responsible for grandchildren
Grandparents (60 years and over) White / Caucasian 131 100.0% Not responsible for grandchildrenWhite alone, not Hispanic / Latino 131 100.0% Not responsible for grandchildren