Races in Arlington, New York (NY) Detailed Stats
Data:
Races - White alone (%)
Races - White alone (% change since 2000)
Races - Black alone (%)
Races - Black alone (% change since 2000)
Races - American Indian alone (%)
Races - American Indian alone (% change since 2000)
Races - Asian alone (%)
Races - Asian alone (% change since 2000)
Races - Hispanic (%)
Races - Hispanic (% change since 2000)
Races - Native Hawaiian and Other Pacific Islander alone (%)
Races - Native Hawaiian and Other Pacific Islander alone (% change since 2000)
Races - Two or more races(%)
Races - Two or more races(% change since 2000)
Races - Other race alone (%)
Races - Other race alone (% change since 2000)
Racial diversity
Place of birth - Born in state of residence (%)
Place of birth - Born in state of residence (%) - White
Place of birth - Born in state of residence (%) - Black or African American
Place of birth - Born in state of residence (%) - Asian
Place of birth - Born in state of residence (%) - Hispanic or Latino
Place of birth - Born in state of residence (%) - American Indian and Alaska Native
Place of birth - Born in state of residence (%) - Multirace
Place of birth - Born in state of residence (%) - Other Race
Place of birth - Born in other state (%)
Place of birth - Born in other state (%) - White
Place of birth - Born in other state (%) - Black or African American
Place of birth - Born in other state (%) - Asian
Place of birth - Born in other state (%) - Hispanic or Latino
Place of birth - Born in other state (%) - American Indian and Alaska Native
Place of birth - Born in other state (%) - Multirace
Place of birth - Born in other state (%) - Other Race
Place of birth - Native, outside of US (%)
Place of birth - Native, outside of US (%) - White
Place of birth - Native, outside of US (%) - Black or African American
Place of birth - Native, outside of US (%) - Asian
Place of birth - Native, outside of US (%) - Hispanic or Latino
Place of birth - Native, outside of US (%) - American Indian and Alaska Native
Place of birth - Native, outside of US (%) - Multirace
Place of birth - Native, outside of US (%) - Other Race
Place of birth - Foreign born (%)
Place of birth - Foreign born (%) - White
Place of birth - Foreign born (%) - Black or African American
Place of birth - Foreign born (%) - Asian
Place of birth - Foreign born (%) - Hispanic or Latino
Place of birth - Foreign born (%) - American Indian and Alaska Native
Place of birth - Foreign born (%) - Multirace
Place of birth - Foreign born (%) - Other Race
Residents speaking English at home (%)
Residents speaking English at home - Born in the United States (%)
Residents speaking English at home - Native, born elsewhere (%)
Residents speaking English at home - Foreign born (%)
Residents speaking Spanish at home (%)
Residents speaking Spanish at home - Born in the United States (%)
Residents speaking Spanish at home - Native, born elsewhere (%)
Residents speaking Spanish at home - Foreign born (%)
Residents speaking other language at home (%)
Residents speaking other language at home - Born in the United States (%)
Residents speaking other language at home - Native, born elsewhere (%)
Residents speaking other language at home - Foreign born (%)
Marital status - Never married (%)
Marital status - Now married (%)
Marital status - Separated (%)
Marital status - Widowed (%)
Marital status - Divorced (%)
Ancestries Reported - Arab (%)
Ancestries Reported - Czech (%)
Ancestries Reported - Danish (%)
Ancestries Reported - Dutch (%)
Ancestries Reported - English (%)
Ancestries Reported - French (%)
Ancestries Reported - French Canadian (%)
Ancestries Reported - German (%)
Ancestries Reported - Greek (%)
Ancestries Reported - Hungarian (%)
Ancestries Reported - Irish (%)
Ancestries Reported - Italian (%)
Ancestries Reported - Lithuanian (%)
Ancestries Reported - Norwegian (%)
Ancestries Reported - Polish (%)
Ancestries Reported - Portuguese (%)
Ancestries Reported - Russian (%)
Ancestries Reported - Scotch-Irish (%)
Ancestries Reported - Scottish (%)
Ancestries Reported - Slovak (%)
Ancestries Reported - Subsaharan African (%)
Ancestries Reported - Swedish (%)
Ancestries Reported - Swiss (%)
Ancestries Reported - Ukrainian (%)
Ancestries Reported - United States (%)
Ancestries Reported - Welsh (%)
Ancestries Reported - West Indian (%)
Ancestries Reported - Other (%)
Geographical mobility - Same house 1 year ago (%)
Geographical mobility - Same house 1 year ago (%) - White
Geographical mobility - Same house 1 year ago (%) - Black or African American
Geographical mobility - Same house 1 year ago (%) - Asian
Geographical mobility - Same house 1 year ago (%) - Hispanic or Latino
Geographical mobility - Same house 1 year ago (%) - American Indian and Alaska Native
Geographical mobility - Same house 1 year ago (%) - Multirace
Geographical mobility - Same house 1 year ago (%) - Other Race
Geographical mobility - Moved within same county (%)
Geographical mobility - Moved within same county (%) - White
Geographical mobility - Moved within same county (%) - Black or African American
Geographical mobility - Moved within same county (%) - Asian
Geographical mobility - Moved within same county (%) - Hispanic or Latino
Geographical mobility - Moved within same county (%) - American Indian and Alaska Native
Geographical mobility - Moved within same county (%) - Multirace
Geographical mobility - Moved within same county (%) - Other Race
Geographical mobility - Moved from different county within same state (%)
Geographical mobility - Moved from different county within same state (%) - White
Geographical mobility - Moved from different county within same state (%) - Black or African American
Geographical mobility - Moved from different county within same state (%) - Asian
Geographical mobility - Moved from different county within same state (%) - Hispanic or Latino
Geographical mobility - Moved from different county within same state (%) - American Indian and Alaska Native
Geographical mobility - Moved from different county within same state (%) - Multirace
Geographical mobility - Moved from different county within same state (%) - Other Race
Geographical mobility - Moved from different state (%)
Geographical mobility - Moved from different state (%) - White
Geographical mobility - Moved from different state (%) - Black or African American
Geographical mobility - Moved from different state (%) - Asian
Geographical mobility - Moved from different state (%) - Hispanic or Latino
Geographical mobility - Moved from different state (%) - American Indian and Alaska Native
Geographical mobility - Moved from different state (%) - Multirace
Geographical mobility - Moved from different state (%) - Other Race
Geographical mobility - Moved from abroad (%)
Geographical mobility - Moved from abroad (%) - White
Geographical mobility - Moved from abroad (%) - Black or African American
Geographical mobility - Moved from abroad (%) - Asian
Geographical mobility - Moved from abroad (%) - Hispanic or Latino
Geographical mobility - Moved from abroad (%) - American Indian and Alaska Native
Geographical mobility - Moved from abroad (%) - Multirace
Geographical mobility - Moved from abroad (%) - Other Race
Place of birth for the foreign-born population - Ireland (%)
Place of birth for the foreign-born population - Denmark (%)
Place of birth for the foreign-born population - Norway (%)
Place of birth for the foreign-born population - Sweden (%)
Place of birth for the foreign-born population - United Kingdom (%)
Place of birth for the foreign-born population - England (%)
Place of birth for the foreign-born population - Scotland (%)
Place of birth for the foreign-born population - Other Northern Europe (%)
Place of birth for the foreign-born population - Austria (%)
Place of birth for the foreign-born population - Belgium (%)
Place of birth for the foreign-born population - France (%)
Place of birth for the foreign-born population - Germany (%)
Place of birth for the foreign-born population - Netherlands (%)
Place of birth for the foreign-born population - Switzerland (%)
Place of birth for the foreign-born population - Other Western Europe (%)
Place of birth for the foreign-born population - Greece (%)
Place of birth for the foreign-born population - Italy (%)
Place of birth for the foreign-born population - Portugal (%)
Place of birth for the foreign-born population - Spain (%)
Place of birth for the foreign-born population - Other Southern Europe (%)
Place of birth for the foreign-born population - Albania (%)
Place of birth for the foreign-born population - Belarus (%)
Place of birth for the foreign-born population - Bosnia and Herzegovina (%)
Place of birth for the foreign-born population - Bulgaria (%)
Place of birth for the foreign-born population - Croatia (%)
Place of birth for the foreign-born population - Czechoslovakia (%)
Place of birth for the foreign-born population - Hungary (%)
Place of birth for the foreign-born population - Latvia (%)
Place of birth for the foreign-born population - Lithuania (%)
Place of birth for the foreign-born population - North Macedonia (Macedonia) (%)
Place of birth for the foreign-born population - Moldova (%)
Place of birth for the foreign-born population - Poland (%)
Place of birth for the foreign-born population - Romania (%)
Place of birth for the foreign-born population - Russia (%)
Place of birth for the foreign-born population - Serbia (%)
Place of birth for the foreign-born population - Ukraine (%)
Place of birth for the foreign-born population - Other Eastern Europe (%)
Place of birth for the foreign-born population - China (%)
Place of birth for the foreign-born population - Hong Kong (%)
Place of birth for the foreign-born population - Taiwan (%)
Place of birth for the foreign-born population - Japan (%)
Place of birth for the foreign-born population - Korea (%)
Place of birth for the foreign-born population - Other Eastern Asia (%)
Place of birth for the foreign-born population - Afghanistan (%)
Place of birth for the foreign-born population - Bangladesh (%)
Place of birth for the foreign-born population - India (%)
Place of birth for the foreign-born population - Iran (%)
Place of birth for the foreign-born population - Kazakhstan (%)
Place of birth for the foreign-born population - Nepal (%)
Place of birth for the foreign-born population - Pakistan (%)
Place of birth for the foreign-born population - Sri Lanka (%)
Place of birth for the foreign-born population - Uzbekistan (%)
Place of birth for the foreign-born population - Other South Central Asia (%)
Place of birth for the foreign-born population - Burma (%)
Place of birth for the foreign-born population - Cambodia (%)
Place of birth for the foreign-born population - Indonesia (%)
Place of birth for the foreign-born population - Laos (%)
Place of birth for the foreign-born population - Malaysia (%)
Place of birth for the foreign-born population - Philippines (%)
Place of birth for the foreign-born population - Singapore (%)
Place of birth for the foreign-born population - Thailand (%)
Place of birth for the foreign-born population - Vietnam (%)
Place of birth for the foreign-born population - Other South Eastern Asia (%)
Place of birth for the foreign-born population - Armenia (%)
Place of birth for the foreign-born population - Iraq (%)
Place of birth for the foreign-born population - Israel (%)
Place of birth for the foreign-born population - Jordan (%)
Place of birth for the foreign-born population - Kuwait (%)
Place of birth for the foreign-born population - Lebanon (%)
Place of birth for the foreign-born population - Saudi Arabia (%)
Place of birth for the foreign-born population - Syria (%)
Place of birth for the foreign-born population - Turkey (%)
Place of birth for the foreign-born population - Yemen (%)
Place of birth for the foreign-born population - Other Western Asia (%)
Place of birth for the foreign-born population - Eritrea (%)
Place of birth for the foreign-born population - Ethiopia (%)
Place of birth for the foreign-born population - Kenya (%)
Place of birth for the foreign-born population - Somalia (%)
Place of birth for the foreign-born population - Uganda (%)
Place of birth for the foreign-born population - Zimbabwe (%)
Place of birth for the foreign-born population - Other Eastern Africa (%)
Place of birth for the foreign-born population - Cameroon (%)
Place of birth for the foreign-born population - Congo (%)
Place of birth for the foreign-born population - Democratic Republic of Congo (Zaire) (%)
Place of birth for the foreign-born population - Other Middle Africa (%)
Place of birth for the foreign-born population - Egypt (%)
Place of birth for the foreign-born population - Morocco (%)
Place of birth for the foreign-born population - Sudan (%)
Place of birth for the foreign-born population - Other Northern Africa (%)
Place of birth for the foreign-born population - South Africa (%)
Place of birth for the foreign-born population - Other Southern Africa (%)
Place of birth for the foreign-born population - Cabo Verde (%)
Place of birth for the foreign-born population - Ghana (%)
Place of birth for the foreign-born population - Liberia (%)
Place of birth for the foreign-born population - Nigeria (%)
Place of birth for the foreign-born population - Senegal (%)
Place of birth for the foreign-born population - Sierra Leone (%)
Place of birth for the foreign-born population - Other Western Africa (%)
Place of birth for the foreign-born population - Australia (%)
Place of birth for the foreign-born population - New Zealand (%)
Place of birth for the foreign-born population - Fiji (%)
Place of birth for the foreign-born population - Micronesia (%)
Place of birth for the foreign-born population - Bahamas (%)
Place of birth for the foreign-born population - Barbados (%)
Place of birth for the foreign-born population - Cuba (%)
Place of birth for the foreign-born population - Dominica (%)
Place of birth for the foreign-born population - Dominican Republic (%)
Place of birth for the foreign-born population - Grenada (%)
Place of birth for the foreign-born population - Haiti (%)
Place of birth for the foreign-born population - Jamaica (%)
Place of birth for the foreign-born population - St. Vincent and the Grenadines (%)
Place of birth for the foreign-born population - Trinidad and Tobago (%)
Place of birth for the foreign-born population - West Indies (%)
Place of birth for the foreign-born population - Other Caribbean (%)
Place of birth for the foreign-born population - Belize (%)
Place of birth for the foreign-born population - Costa Rica (%)
Place of birth for the foreign-born population - El Salvador (%)
Place of birth for the foreign-born population - Guatemala (%)
Place of birth for the foreign-born population - Honduras (%)
Place of birth for the foreign-born population - Mexico (%)
Place of birth for the foreign-born population - Nicaragua (%)
Place of birth for the foreign-born population - Panama (%)
Place of birth for the foreign-born population - Other Central America (%)
Place of birth for the foreign-born population - Argentina (%)
Place of birth for the foreign-born population - Bolivia (%)
Place of birth for the foreign-born population - Brazil (%)
Place of birth for the foreign-born population - Chile (%)
Place of birth for the foreign-born population - Colombia (%)
Place of birth for the foreign-born population - Ecuador (%)
Place of birth for the foreign-born population - Guyana (%)
Place of birth for the foreign-born population - Peru (%)
Place of birth for the foreign-born population - Uruguay (%)
Place of birth for the foreign-born population - Venezuela (%)
Place of birth for the foreign-born population - Other South America (%)
Place of birth for the foreign-born population - Canada (%)
Place of birth for the foreign-born population - Other Northern America (%)
Place of birth for the foreign-born population - Other (%)
Latest news about races in Arlington, NY collected exclusively by city-data.com from local newspapers, TV, and radio stations
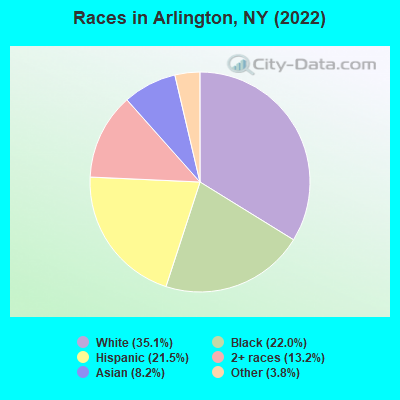
According to 2022 data, the most numerous races in Arlington, NY are White alone (848 residents), Hispanic (520 residents), and Black alone (532 residents). 73.7% of Arlington residents speak English at home. 20.9% of Arlington, NY residents are foreign-born (9.2% born in Asia, 6.1% born in Latin America, 4.7% born in Europe), which is 5.2% less than the foreign-born rate of 22.0% across the entire state of New York.
Race distribution in Arlington
2000 2022
11,760,981 62.0% White alone 2,867,583 15.1% Hispanic 2,812,623 14.8% Black alone 1,035,926 5.5% Asian alone 366,116 1.9% Two or more races 75,499 0.4% Other race alone 52,499 0.3% American Indian alone 5,230 0.03% Native Hawaiian and Other
10,408,933 52.9% White alone 3,867,299 19.7% Hispanic 2,633,840 13.4% Black alone 1,776,286 9.0% Asian alone 732,670 3.7% Two or more races 216,110 1.1% Other race alone 35,082 0.2% American Indian alone 6,931 0.04% Native Hawaiian and Other
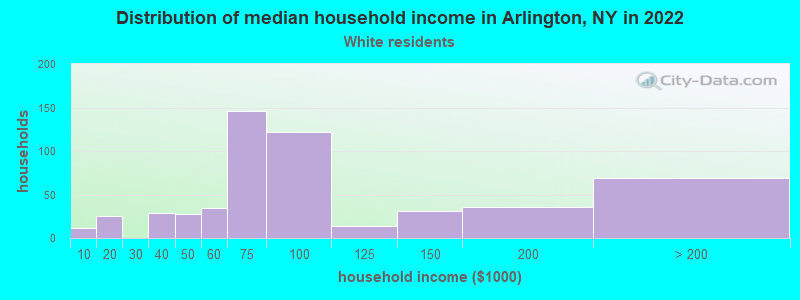
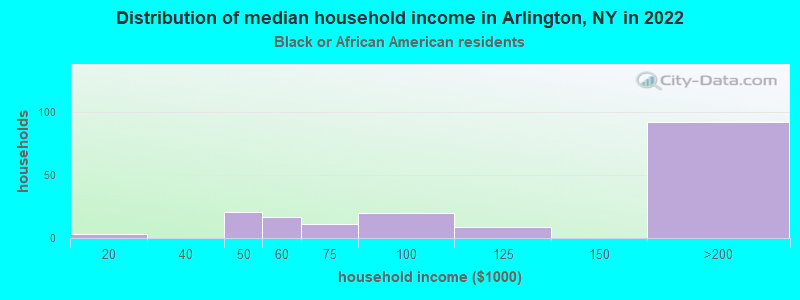
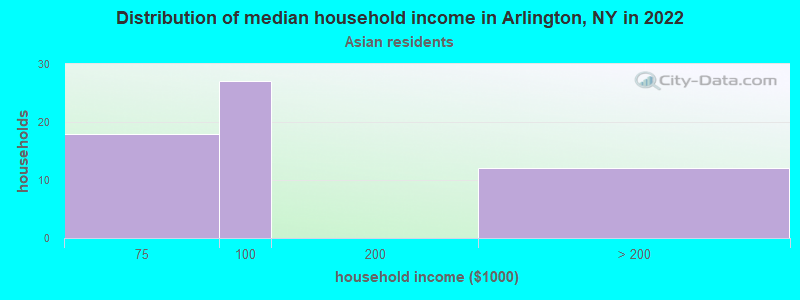
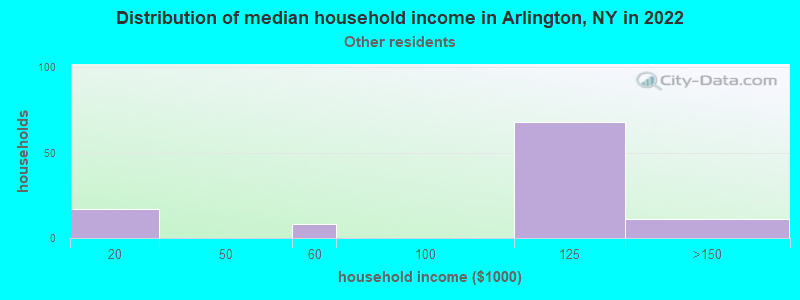
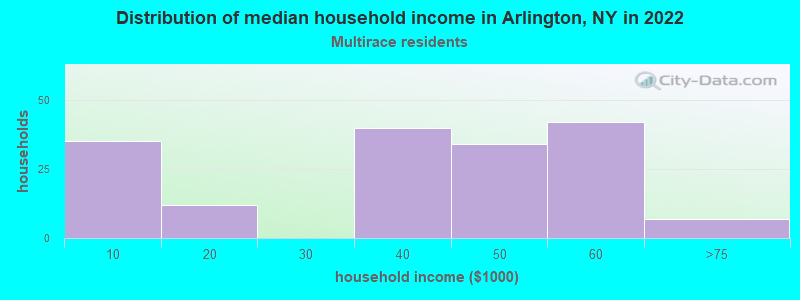
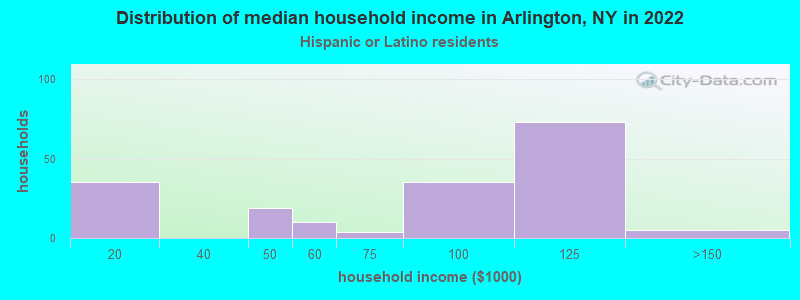
Income and house value in Arlington Median household income in 2022 $70,569 White non-Hispanic householders$142,070 Black householders$84,236 Asian householders$111,870 Some other race householders$31,412 Two or more races householders$65,674 Hispanic or Latino race householdersMedian 2022 house value $286,783 White Non-Hispanic householders$289,189 Black or African American householders $369,252 Asian householders$246,095 Two or more races householders$259,876 Hispanic or Latino householders
Median age by race in Arlington
44.1 Median age for White residents41.8 51.4 47.9 Median age for Black or African American residents42.6 59.9 -815,273,477.0 Median age for American Indian / Alaska Native residents-796,352,582.8 -969,474,968.5 60.3 Median age for Asian residents51.1 75.5 -663,333,332.7 Median age for Native Hawaiian / Pacific Islander residents-477,502,295.2 -497,387,669.3 25.1 Median age for Other race residents33.6 25.5 20.7 Median age for Two or more races residents17.2 19.2 47.1 Median age for White alone residents43.5 51.7 26.2 Median age for Hispanic or Latino residents30.9 25.4
Owner/renter occupied households by race in Arlington
House owners and renters - White residents 284 54.6% Owner occupied236 45.4% Renter occupiedHouse owners and renters - Black or African American residents 40 20.2% Owner occupied158 79.8% Renter occupiedHouse owners and renters - Asian residents 30 59.3% Owner occupied21 40.7% Renter occupiedHouse owners and renters - Native Hawaiian / Pacific Islander residents 18 100.0% Renter occupiedHouse owners and renters - Other race residents 13 10.5% Owner occupied113 89.5% Renter occupiedHouse owners and renters - Two or more races residents 143 100.0% Renter occupiedHouse owners and renters - White alone residents 249 50.5% Owner occupied244 49.5% Renter occupiedHouse owners and renters - Hispanic or Latino residents 53 31.3% Owner occupied116 68.7% Renter occupied
Language usage in Arlington
English speakers - Total 73.7% of residents of Arlington speak English at home.
8.4% of residents speak Spanish at home 135 69.6% Speak English very well59 30.4% Speak English less than very well18.5% of residents speak other language at home 321 75.2% Speak English very well106 24.8% Speak English less than very well
English speakers - Born in the United States 71.4% of residents of Arlington speak English at home.
13.8% of residents speak other language at home 45 100.0% Speak English very well
English speakers - Native, born elsewhere 78.8% of residents of Arlington speak English at home.
9.1% of residents speak Spanish at home 6 100.0% Speak English very well30.3% of residents speak other language at home 20 100.0% Speak English very well
English speakers - Foreign-born 31.8% of residents of Arlington speak English at home.
10.1% of residents speak Spanish at home 8 14.3% Speak English very well48 85.7% Speak English less than very well58.2% of residents speak other language at home 208 64.2% Speak English very well116 35.8% Speak English less than very well
White (Caucasian) - Speak only English Native:
88.0% (642)Foreign-born:
19.9% (28)
White (Caucasian) - Speak another language Native:
10.4% (76)Foreign-born:
81.3% (114)
Black or African American - Speak only English Native:
87.7% (383)Foreign-born:
23.1% (15)
Black or African American - Speak another language Native:
14.6% (64)Foreign-born:
79.9% (51)
Asian - Speak only English Native:
3.2% (1)Foreign-born:
10.3% (17)
Asian - Speak another language Native:
77.9% (27)Foreign-born:
90.7% (152)
Other race - Speak only English Native:
73.0% (192)Foreign-born:
48.7% (89)
Other race - Speak another language Native:
29.8% (78)Foreign-born:
35.9% (65)
Two or more races - Speak only English Native:
100.0% (376)Foreign-born:
100.0% (7)
White alone - Speak only English Native:
86.8% (609)Foreign-born:
18.4% (29)
White alone - Speak another language Native:
11.8% (82)Foreign-born:
86.6% (135)
Hispanic or Latino - Speak only English Native:
81.2% (255)Foreign-born:
34.4% (43)
Hispanic or Latino - Speak another language Native:
18.8% (59)Foreign-born:
49.1% (61)
Foreign-born residents in Arlington 505 residents are foreign born (9.2% Asia , 6.1% Latin America , 4.7% Europe ).
This city:
20.9%New York:
22.6%
Marital status for residents in Arlington Marital status - White (Caucasian) population 15 years and over
Males 44.6% Never married34.0% Now married5.2% Separated0.0% Widowed16.2% DivorcedFemales 26.6% Never married37.0% Now married4.2% Separated18.5% Widowed13.7% DivorcedWomen who did not give birth in the past 12 months Now married:
45.5% (72)Unmarried:
54.5% (86)
Marital status - Black or African American population 15 years and over
Males 51.0% Never married46.7% Now married0.0% Separated0.0% Widowed2.3% DivorcedFemales 46.5% Never married40.4% Now married0.0% Separated8.3% Widowed4.8% DivorcedWomen who did not give birth in the past 12 months Now married:
0.0% (0)Unmarried:
100.0% (80)
Marital status - Asian population 15 years and over
Males 32.8% Never married58.6% Now married0.0% Separated0.0% Widowed8.6% DivorcedFemales 0.0% Never married75.6% Now married0.0% Separated12.8% Widowed11.6% DivorcedWomen who did not give birth in the past 12 months Now married:
61.5% (16)Unmarried:
38.5% (10)
Marital status - Other race population 15 years and over
Males 0.0% Never married100.0% Now married0.0% Separated0.0% Widowed0.0% DivorcedFemales 37.9% Never married22.9% Now married0.0% Separated29.0% Widowed10.3% DivorcedWomen who did not give birth in the past 12 months Now married:
12.2% (37)Unmarried:
87.8% (267)
Marital status - Two or more races population 15 years and over
Males 100.0% Never married0.0% Now married0.0% Separated0.0% Widowed0.0% DivorcedFemales 80.0% Never married0.0% Now married0.0% Separated0.0% Widowed20.0% DivorcedWomen who did not give birth in the past 12 months Now married:
0.0% (0)Unmarried:
100.0% (147)
Marital status - White alone, not Hispanic / Latino population 15 years and over
Males 48.8% Never married37.2% Now married5.7% Separated0.0% Widowed8.3% DivorcedFemales 26.6% Never married37.0% Now married4.2% Separated18.5% Widowed13.7% DivorcedWomen who did not give birth in the past 12 months Now married:
45.5% (73)Unmarried:
54.5% (88)
Marital status - Hispanic or Latino population 15 years and over
Males 20.9% Never married26.4% Now married0.0% Separated0.0% Widowed52.7% DivorcedFemales 55.6% Never married13.1% Now married0.0% Separated23.1% Widowed8.2% DivorcedWomen who did not give birth in the past 12 months Now married:
3.7% (10)Unmarried:
96.3% (250)
Ancestries in Arlington
68 6.5% Irish66 6.3% English55 5.3% Moroccan51 4.9% German40 3.8% Ukrainian29 2.8% Jamaican25 2.4% Italian23 2.2% Polish15 1.4% Portuguese10 1.0% Norwegian3 0.3% Russian1 0.10% American
Children Nativity (place of birth) in Arlington
Children under 6 years - Living with two parents Both parents native 25 100.0% NativeBoth parents foreign-born 5 100.0% NativeOne native, one foreign-born parent 11 100.0% NativeChildren under 6 years - Living with one parent Native parent 57 100.0% NativeChildren 6 to 17 years - Living with two parents Both parents native 80 100.0% NativeBoth parents foreign-born 83 100.0% NativeOne native, one foreign-born parent 26 100.0% NativeChildren 6 to 17 years - Living with one parent Native parent 53 100.0% NativeForeign-born parent 24 43.3% Native31 56.7% Foreign-born