Southgate neighborhood in Palo Alto, California (CA), 94301, 94306 detailed profile
Settings
X


Business Search - 14 Million verified businesses
Area: 0.102 square miles
Population: 708
Population density:
| Southgate: | 6,921 people per square mile |
| Palo Alto: | 2,789 people per square mile |

- 32845.9%White
- 29040.6%Asian
- 588.1%Hispanic or Latino
- 253.5%Two or more races
- 111.5%Some other race
- 20.3%Black

Median household income in 2022:
| Southgate: | $270,375 |
| Palo Alto: | $179,707 |
Distribution of median household income
![Distribution of median household income]()
- 3Less than $10,000
- 4$20,000 to $29,999
- 8$30,000 to $39,999
- 11$40,000 to $49,999
- 2$50,000 to $59,999
- 7$60,000 to $74,999
- 5$75,000 to $99,999
- 3$100,000 to $124,999
- 7$125,000 to $149,999
- 14$150,000 to $199,999
- 195$200,000 or more

Distribution of owner-occupied house/condo value
![Distribution of owner-occupied house/condo value]()
- 1Less than $50,000
- 7$50,000 to $99,999
- 1$500,000 to $749,999
- 170$1,000,000 or more

Distribution of rent paid by renters
![Distribution of rent paid by renters]()
- 12$800 to $899
- 66$2,000 or more

Median rent in 2022:
| Southgate: | $3,677 |
| Palo Alto: | $2,001 |
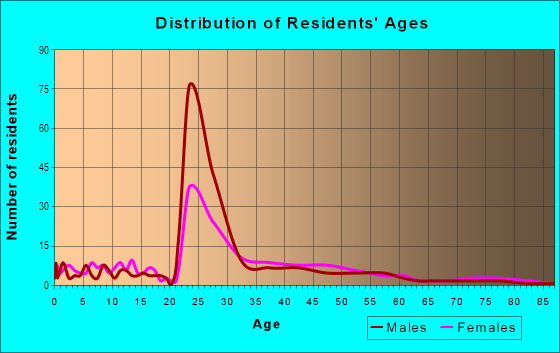
| Males: | 339 |
| Females: | 368 |
Males:
| This neighborhood: | 48.1 years |
| Whole city: | 47.1 years |
| This neighborhood: | 48.9 years |
| Whole city: | 48.1 years |
Average household size:
| Southgate: | 3.2 people |
| Palo Alto: | 2.3 people |
Percentage of family households:
| Southgate: | 39.8% |
| Palo Alto: | 42.2% |
| Here: | 73.7% |
| Palo Alto: | 52.1% |
Percentage of married-couple families with children (among all households):
| Southgate: | 30.5% |
| Palo Alto: | 37.5% |
Percentage of single-mother households (among all households):
| Southgate: | 3.5% |
| Palo Alto: | 3.5% |
Percentage of never married males 15 years old and over:
Percentage of never married females 15 years old and over:
| Southgate: | 10.0% |
| Palo Alto: | 17.4% |
Percentage of never married females 15 years old and over:
| Southgate: | 11.4% |
| city: | 11.8% |
Percentage of people that speak English not well or not at all:
| Southgate: | 0.0% |
| Palo Alto: | 3.7% |
Percentage of people born in this state:
Percentage of people born in another U.S. state:
Percentage of native residents but born outside the U.S.:
Percentage of foreign born residents:
| Here: | 34.5% |
| Palo Alto: | 36.4% |
Percentage of people born in another U.S. state:
| Southgate: | 26.8% |
| Palo Alto: | 28.3% |
Percentage of native residents but born outside the U.S.:
| Here: | 1.2% |
| city: | 3.7% |
Percentage of foreign born residents:
| Here: | 37.5% |
| Palo Alto: | 31.6% |

Owner-occupied
Renter-occupied


- Rooms in owner-occupied houses and condos in Southgate
- 01 room
- 02 rooms
- 503 rooms
- 114 rooms
- 235 rooms
- 136 rooms
- 47 rooms
- 398 rooms
- 809+ rooms

- Rooms in renter-occupied apartments in Southgate
- 01 room
- 92 rooms
- 53 rooms
- 514 rooms
- 135 rooms
- 136 rooms
- 47 rooms
- 08 rooms
- 119+ rooms
Owner-occupied
Renter-occupied

- Bedrooms in owner-occupied houses and condos in Southgate
- 0no bedroom
- 01 bedroom
- 322 bedrooms
- 123 bedrooms
- 464 bedrooms
- 745+ bedrooms

- Bedrooms in renter-occupied apartments in Southgate
- 0no bedroom
- 151 bedroom
- 392 bedrooms
- 63 bedrooms
- 174 bedrooms
- 45+ bedrooms
Average number of cars or other vehicles available in houses/condos:
Average number of cars or other vehicles available in apartments:
| This neighborhood: | 2.2 |
| Palo Alto: | 2.1 |
Average number of cars or other vehicles available in apartments:
| Here: | 1.6 |
| city: | 1.1 |
Percentage of units with a mortgage:
| Southgate: | 52.0% |
| Palo Alto: | 58.3% |

- Year house built in Southgate
- 02020 or later
- 72010 to 2019
- 72000 to 2009
- 441990 to 1999
- 231980 to 1989
- 341970 to 1979
- 71960 to 1969
- 571950 to 1959
- 241940 to 1949
- 1031939 or earlier

City-data.com crime index for city in 2020 (higher means more crime):
| City: | 180.8 |
| U.S. average: | 219.5 |
Travel time to work (commute)
![Travel time to work (commute)]()
- 125 to 9 minutes
- 2410 to 14 minutes
- 3215 to 19 minutes
- 3920 to 24 minutes
- 1025 to 29 minutes
- 2830 to 34 minutes
- 235 to 39 minutes
- 440 to 44 minutes
- 745 to 59 minutes
- 360 to 89 minutes

Means of transportation to work
![Means of transportation to work]()
- 39.3%131Drove a car alone
- 5.1%17Carpooled
- 1.8%6Long-distance train or commuter rail
- 4.8%16Bicycle
- 3.3%11Walked
- 1.8%6Other means
- 45.0%150Worked at home

Time leaving home to go to work
![Time leaving home to go to work]()
- 76:00 a.m. to 6:29 a.m.
- 106:30 a.m. to 6:59 a.m.
- 207:00 a.m. to 7:29 a.m.
- 257:30 a.m. to 7:59 a.m.
- 268:00 a.m. to 8:29 a.m.
- 168:30 a.m. to 8:59 a.m.
- 369:00 a.m. to 9:59 a.m.
- 210:00 a.m. to 10:59 a.m.
- 1112:00 p.m. to 3:59 p.m.
- 194:00 p.m. to 11:59 p.m.

Occupations of males:
- Percentage of males in management occupations (except farmers):
Here: 19.5% city: 19.1%
- Percentage of males in business and financial operations occupations:
Here: 8.4% city: 7.0%
- Percentage of males in computer and mathematical occupations:
Here: 12.5% city: 22.2%
- Percentage of males in architecture and engineering occupations:
Here: 21.1% city: 10.1%
- Percentage of males in life, physical, and social science occupations:
Here: 8.5% city: 6.4%
- Percentage of males in legal occupations:
Here: 6.8% city: 2.5%
- Percentage of males in healthcare practitioners and technical occupations:
Here: 4.8% city: 4.6%
- Percentage of males in sales and office occupations:
Here: 7.1% city: 5.7%
- Percentage of males in construction, extraction, and maintenance occupations:
Here: 2.2% city: 1.7%
- Percentage of males in production occupations:
Here: 1.6% city: 1.4%
Occupations of females:
- Percentage of females in management occupations (except farmers):
Here: 18.2% city: 19.0%
- Percentage of females in business and financial operations occupations:
Here: 6.4% city: 8.3%
- Percentage of females in computer and mathematical occupations:
Here: 4.1% city: 8.6%
- Percentage of females in architecture and engineering occupations:
Here: 25.5% city: 4.0%
- Percentage of females in life, physical, and social science occupations:
Here: 3.1% city: 6.8%
- Percentage of females in legal occupations:
Here: 10.7% city: 4.8%
- Percentage of females in education, training, and library occupations:
Here: 12.1% city: 12.9%
- Percentage of females in arts, design, entertainment, sports, and media occupations:
Here: 2.1% city: 4.3%
- Percentage of females in healthcare practitioners and technical occupations:
Here: 9.5% city: 8.7%
- Percentage of females in service occupations:
Here: 6.0% city: 8.4%
- Percentage of females in sales and office occupations:
Here: 5.4% city: 11.7%
Education in this neighborhood (subdivision or community):
- Percentage of people 3 years and older in K-12 schools:
Southgate: 25.6% Palo Alto: 14.2%
- Percentage of people 3 years and older in undergraduate colleges:
Southgate: 2.6% Palo Alto: 2.4%
- Percentage of people 3 years and older in grad. or professional schools:
Southgate: 4.4% Palo Alto: 2.8%
- Percentage of students K-12 enrolled in private schools:
Southgate: 27.4% Palo Alto: 22.1%
Percentage of population below poverty level:
| Southgate: | 3.2% |
| Palo Alto: | 4.5% |
Median year owner moved in (as recorded in 2022):
Median year renter moved in (as recorded in 2022):
| Southgate: | 2166 |
| Palo Alto: | 2001 |
Median year renter moved in (as recorded in 2022):
| Southgate: | 2181 |
| Palo Alto: | 2019 |
Percentage of married-couple families with both working:
| Southgate: | 72.8% |
| Palo Alto: | 68.5% |
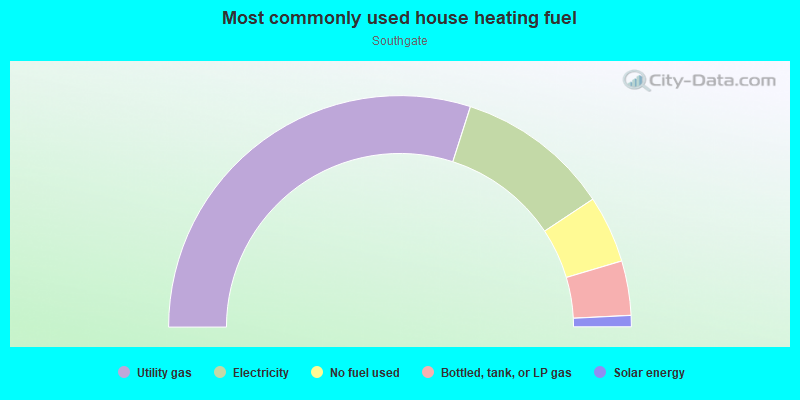
- 86.2%Utility gas
- 12.8%Electricity
- 1.0%Solar energy
Highways in this neighborhood:
State Hwy 82 (el Camino Real)
Length: 0.34 miles
Direction: SE-NW
Address range: 1500 to 1799
Direction: SE-NW
Address range: 1500 to 1799
Roads and streets:
Mariposa Ave
Length: 0.34 miles
Directions: N-S, SE-NW, SW-NE
Address range: 1500 to 1699
Directions: N-S, SE-NW, SW-NE
Address range: 1500 to 1699
Castilleja Ave
Length: 0.33 miles
Directions: E-W, SE-NW
Address range: 1500 to 1799
Directions: E-W, SE-NW
Address range: 1500 to 1799
Churchill Ave
Length: 0.31 miles
Direction: SW-NE
Address range: 1 to 99
Direction: SW-NE
Address range: 1 to 99
Alma St
Length: 0.30 miles
Direction: SE-NW
Address range: 1500 to 1799
Direction: SE-NW
Address range: 1500 to 1799
Miramonte Ave
Length: 0.28 miles
Direction: SW-NE
Address range: 100 to 599
Direction: SW-NE
Address range: 100 to 599
Madrono Ave
Length: 0.24 miles
Direction: SE-NW
Address range: 1500 to 1699
Direction: SE-NW
Address range: 1500 to 1699
Escobita Ave
Length: 0.20 miles
Direction: SE-NW
Address range: 1500 to 1699
Direction: SE-NW
Address range: 1500 to 1699
Sequoia Ave
Length: 0.20 miles
Directions: E-W, SW-NE
Address range: 200 to 499
Directions: E-W, SW-NE
Address range: 200 to 499
Park Blvd
Length: 0.19 miles
Directions: E-W, N-S, SW-NE
Address range: 1700 to 1815
Directions: E-W, N-S, SW-NE
Address range: 1700 to 1815
Portola Ave
Length: 0.15 miles
Direction: SE-NW
Address range: 1500 to 1699
Direction: SE-NW
Address range: 1500 to 1699
Manzanita Ave
Length: 0.14 miles
Directions: N-S, SW-NE
Address range: 200 to 399
Directions: N-S, SW-NE
Address range: 200 to 399
Park Ave
Length: 0.13 miles
Directions: E-W, N-S, SE-NW, SW-NE
Address range: 100 to 199
Directions: E-W, N-S, SE-NW, SW-NE
Address range: 100 to 199
Railroad features:
Union Pacific RR
Length: 0.10 miles
Direction: SE-NW
Direction: SE-NW