South Bayview neighborhood in Norfolk, Virginia (VA), 23518 detailed profile
Settings
X


Business Search - 14 Million verified businesses
Area: 0.331 square miles
Population: 1,514
Population density:
| South Bayview: | 4,579 people per square mile |
| Norfolk: | 4,337 people per square mile |

- 1,10270.8%White
- 1328.5%Black
- 1006.4%Hispanic or Latino
- 774.9%Some other race
- 734.7%Asian
- 734.7%Two or more races

Median household income in 2022:
| South Bayview: | $79,587 |
| Norfolk: | $61,090 |
Distribution of median household income
![Distribution of median household income]()
- 7Less than $10,000
- 34$10,000 to $19,999
- 74$20,000 to $29,999
- 110$30,000 to $39,999
- 26$40,000 to $49,999
- 49$50,000 to $59,999
- 58$60,000 to $74,999
- 156$75,000 to $99,999
- 138$100,000 to $124,999
- 69$125,000 to $149,999
- 68$150,000 to $199,999
- 20$200,000 or more

Distribution of owner-occupied house/condo value
![Distribution of owner-occupied house/condo value]()
- 41Less than $50,000
- 52$100,000 to $149,999
- 173$150,000 to $199,999
- 166$200,000 to $249,999
- 181$250,000 to $299,999
- 61$300,000 to $399,999
- 9$400,000 to $499,999
- 18$500,000 to $749,999
- 22$1,000,000 or more

Distribution of rent paid by renters
![Distribution of rent paid by renters]()
- 14Less than $100
- 9$600 to $699
- 20$700 to $799
- 81$800 to $899
- 8$900 to $999
- 89$1,000 to $1,249
- 16$1,250 to $1,499
- 32$1,500 to $1,999
- 28$2,000 or more

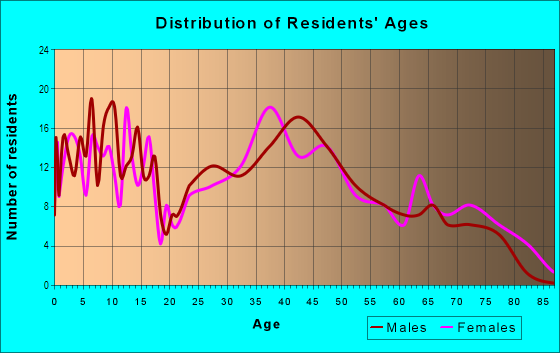
| Males: | 902 |
| Females: | 611 |
Males:
| This neighborhood: | 38.1 years |
| Whole city: | 31.3 years |
| This neighborhood: | 45.1 years |
| Whole city: | 34.4 years |
Average household size:
| South Bayview: | 10.2 people |
| Norfolk: | 2.3 people |
Percentage of family households:
| South Bayview: | 56.1% |
| Norfolk: | 41.3% |
| Here: | 44.2% |
| Norfolk: | 31.7% |
Percentage of married-couple families with children (among all households):
| South Bayview: | 24.2% |
| Norfolk: | 20.2% |
Percentage of single-mother households (among all households):
| South Bayview: | 18.4% |
| Norfolk: | 16.3% |
Percentage of never married males 15 years old and over:
Percentage of never married females 15 years old and over:
| South Bayview: | 20.7% |
| Norfolk: | 25.4% |
Percentage of never married females 15 years old and over:
| South Bayview: | 12.2% |
| city: | 20.5% |
Percentage of people that speak English not well or not at all:
| South Bayview: | 2.9% |
| Norfolk: | 1.4% |
Percentage of people born in this state:
Percentage of people born in another U.S. state:
Percentage of native residents but born outside the U.S.:
Percentage of foreign born residents:
| Here: | 48.3% |
| Norfolk: | 51.1% |
Percentage of people born in another U.S. state:
| South Bayview: | 44.7% |
| Norfolk: | 40.8% |
Percentage of native residents but born outside the U.S.:
| Here: | 1.8% |
| city: | 1.6% |
Percentage of foreign born residents:
| Here: | 5.2% |
| Norfolk: | 6.5% |

Owner-occupied
Renter-occupied


- Rooms in owner-occupied houses and condos in South Bayview
- 01 room
- 02 rooms
- 433 rooms
- 494 rooms
- 1095 rooms
- 1886 rooms
- 1037 rooms
- 658 rooms
- 589+ rooms

- Rooms in renter-occupied apartments in South Bayview
- 01 room
- 102 rooms
- 523 rooms
- 174 rooms
- 605 rooms
- 276 rooms
- 247 rooms
- 798 rooms
- 629+ rooms
Owner-occupied
Renter-occupied

- Bedrooms in owner-occupied houses and condos in South Bayview
- 0no bedroom
- 101 bedroom
- 832 bedrooms
- 3853 bedrooms
- 834 bedrooms
- 265+ bedrooms

- Bedrooms in renter-occupied apartments in South Bayview
- 0no bedroom
- 591 bedroom
- 532 bedrooms
- 843 bedrooms
- 434 bedrooms
- 155+ bedrooms
Average number of cars or other vehicles available in houses/condos:
Average number of cars or other vehicles available in apartments:
| This neighborhood: | 2.0 |
| Norfolk: | 2.0 |
Average number of cars or other vehicles available in apartments:
| Here: | 2.0 |
| city: | 1.3 |
Percentage of units with a mortgage:
| South Bayview: | 82.3% |
| Norfolk: | 70.0% |
Average estimated value of detached houses in 2022 (90.6% of all units):
| South Bayview: | $275,922 |
| Norfolk: | $337,508 |

- Year house built in South Bayview
- 02020 or later
- 622010 to 2019
- 92000 to 2009
- 51990 to 1999
- 251980 to 1989
- 331970 to 1979
- 561960 to 1969
- 4041950 to 1959
- 1411940 to 1949
- 471939 or earlier

City-data.com crime index for city in 2020 (higher means more crime):
| City: | 327.9 |
| U.S. average: | 219.5 |
Travel time to work (commute)
![Travel time to work (commute)]()
- 34Less than 5 minutes
- 215 to 9 minutes
- 10010 to 14 minutes
- 14415 to 19 minutes
- 14920 to 24 minutes
- 6425 to 29 minutes
- 13830 to 34 minutes
- 1035 to 39 minutes
- 2840 to 44 minutes
- 6845 to 59 minutes
- 3260 to 89 minutes
- 2290 or more minutes

Means of transportation to work
![Means of transportation to work]()
- 75.2%677Drove a car alone
- 7.6%68Carpooled
- 2.6%23Bus
- 12.0%108Motorcycle
- 7.3%66Walked
- 8.2%74Other means
- 11.7%105Worked at home

Time leaving home to go to work
![Time leaving home to go to work]()
- 5212:00 a.m. to 4:59 a.m.
- 465:00 a.m. to 5:29 a.m.
- 745:30 a.m. to 5:59 a.m.
- 1126:00 a.m. to 6:29 a.m.
- 786:30 a.m. to 6:59 a.m.
- 867:00 a.m. to 7:29 a.m.
- 707:30 a.m. to 7:59 a.m.
- 628:00 a.m. to 8:29 a.m.
- 298:30 a.m. to 8:59 a.m.
- 629:00 a.m. to 9:59 a.m.
- 1810:00 a.m. to 10:59 a.m.
- 1411:00 a.m. to 11:59 a.m.
- 6112:00 p.m. to 3:59 p.m.
- 384:00 p.m. to 11:59 p.m.

Occupations of males:
- Percentage of males in management occupations (except farmers):
Here: 12.8% city: 8.2%
- Percentage of males in business and financial operations occupations:
Here: 11.4% city: 4.4%
- Percentage of males in computer and mathematical occupations:
Here: 4.2% city: 4.2%
- Percentage of males in architecture and engineering occupations:
Here: 11.9% city: 3.7%
- Percentage of males in arts, design, entertainment, sports, and media occupations:
Here: 1.1% city: 2.2%
- Percentage of males in service occupations:
Here: 11.2% city: 16.9%
- Percentage of males in sales and office occupations:
Here: 21.9% city: 15.6%
- Percentage of males in construction, extraction, and maintenance occupations:
Here: 3.9% city: 9.8%
- Percentage of males in production occupations:
Here: 5.0% city: 6.5%
- Percentage of males in transportation occupations:
Here: 4.6% city: 5.3%
- Percentage of males in material moving occupations:
Here: 8.6% city: 5.3%
Occupations of females:
- Percentage of females in management occupations (except farmers):
Here: 5.0% city: 7.7%
- Percentage of females in business and financial operations occupations:
Here: 5.3% city: 5.2%
- Percentage of females in computer and mathematical occupations:
Here: 3.4% city: 1.7%
- Percentage of females in architecture and engineering occupations:
Here: 2.9% city: 1.0%
- Percentage of females in life, physical, and social science occupations:
Here: 1.3% city: 0.9%
- Percentage of females in community and social services occupations:
Here: 7.9% city: 3.1%
- Percentage of females in legal occupations:
Here: 12.6% city: 1.6%
- Percentage of females in education, training, and library occupations:
Here: 14.4% city: 9.1%
- Percentage of females in arts, design, entertainment, sports, and media occupations:
Here: 4.1% city: 1.3%
- Percentage of females in healthcare practitioners and technical occupations:
Here: 9.6% city: 9.6%
- Percentage of females in service occupations:
Here: 10.8% city: 22.3%
- Percentage of females in sales and office occupations:
Here: 17.8% city: 28.7%
- Percentage of females in production occupations:
Here: 2.3% city: 2.7%
- Percentage of females in transportation occupations:
Here: 1.1% city: 1.6%
- Percentage of females in material moving occupations:
Here: 1.5% city: 2.4%
Percentage of people 16-64 in Armed Forces:
| South Bayview: | 8.8% |
| Norfolk: | 15.8% |
Education in this neighborhood (subdivision or community):
- Percentage of people 3 years and older in K-12 schools:
South Bayview: 27.6% Norfolk: 14.3%
- Percentage of people 3 years and older in undergraduate colleges:
South Bayview: 3.2% Norfolk: 8.0%
- Percentage of people 3 years and older in grad. or professional schools:
South Bayview: 4.3% Norfolk: 2.1%
- Percentage of students K-12 enrolled in private schools:
South Bayview: 25.9% Norfolk: 16.2%
Percentage of population below poverty level:
| South Bayview: | 7.7% |
| Norfolk: | 17.7% |
Median year owner moved in (as recorded in 2022):
| South Bayview: | 2006 |
| Norfolk: | 2013 |
Percentage of married-couple families with both working:
| South Bayview: | 64.4% |
| Norfolk: | 65.5% |

- 57.5%Utility gas
- 33.0%Electricity
- 3.9%Fuel oil, kerosene, etc.
- 2.9%Bottled, tank, or LP gas
- 1.5%No fuel used
- 1.2%Other fuel
Roads and streets:
Tallwood St
Length: 0.65 miles
Directions: E-W, SE-NW
Address range: 1200 to 1699
Directions: E-W, SE-NW
Address range: 1200 to 1699
Bill St
Length: 0.61 miles
Directions: E-W, SW-NE
Address range: 1200 to 1699
Directions: E-W, SW-NE
Address range: 1200 to 1699
Carlton St
Length: 0.56 miles
Directions: N-S, SE-NW
Address range: 8207 to 8447
Directions: N-S, SE-NW
Address range: 8207 to 8447
Pythian Ave
Length: 0.56 miles
Direction: N-S
Address range: 8200 to 8459
Direction: N-S
Address range: 8200 to 8459
Sheppard Ave
Length: 0.53 miles
Directions: E-W, SE-NW
Address range: 1200 to 1632
Directions: E-W, SE-NW
Address range: 1200 to 1632
Newell Ave
Length: 0.34 miles
Direction: E-W
Address range: 1200 to 1399
Direction: E-W
Address range: 1200 to 1399
Quincy St
Length: 0.33 miles
Direction: N-S
Address range: 8200 to 8419
Direction: N-S
Address range: 8200 to 8419
Fernwood Dr
Length: 0.31 miles
Directions: N-S, SW-NE
Address range: 8200 to 8299
Directions: N-S, SW-NE
Address range: 8200 to 8299
Frank St
Length: 0.25 miles
Direction: E-W
Address range: 1200 to 1399
Direction: E-W
Address range: 1200 to 1399
Noble St
Length: 0.25 miles
Direction: E-W
Address range: 1200 to 1399
Direction: E-W
Address range: 1200 to 1399
Boxwood Cir
Length: 0.23 miles
Directions: E-W, SE-NW, SW-NE
Address range: 1300 to 1399
Directions: E-W, SE-NW, SW-NE
Address range: 1300 to 1399
Cape View Ave
Length: 0.21 miles
Direction: SW-NE
Address range: 8300 to 8399
Direction: SW-NE
Address range: 8300 to 8399
Dickson Dr
Length: 0.20 miles
Directions: N-S, SE-NW
Address range: 8300 to 8399
Directions: N-S, SE-NW
Address range: 8300 to 8399
Briarwood Cir
Length: 0.17 miles
Directions: E-W, N-S, SW-NE
Address range: 8215 to 8299
Directions: E-W, N-S, SW-NE
Address range: 8215 to 8299
Woody Dr
Length: 0.15 miles
Directions: E-W, N-S, SE-NW
Address range: 8300 to 8399
Directions: E-W, N-S, SE-NW
Address range: 8300 to 8399
Barkwood Dr
Length: 0.14 miles
Direction: N-S
Address range: 8200 to 8299
Direction: N-S
Address range: 8200 to 8299
Winston St
Length: 0.12 miles
Direction: E-W
Address range: 1200 to 1299
Direction: E-W
Address range: 1200 to 1299
Redwood Cir
Length: 0.12 miles
Direction: N-S
Address range: 8220 to 8299
Direction: N-S
Address range: 8220 to 8299
Burksdale Rd
Length: 0.11 miles
Direction: E-W
Address range: 1200 to 1299
Direction: E-W
Address range: 1200 to 1299
Montague St
Length: 0.10 miles
Direction: E-W
Address range: 1200 to 1299
Direction: E-W
Address range: 1200 to 1299
Evelyn St
Length: 0.10 miles
Direction: E-W
Address range: 1200 to 1299
Direction: E-W
Address range: 1200 to 1299
Bailey St
Length: 0.09 miles
Directions: E-W, SW-NE
Address range: 1300 to 1399
Directions: E-W, SW-NE
Address range: 1300 to 1399
Redwood Ct
Length: 0.07 miles
Directions: E-W, N-S, SE-NW, SW-NE
Address range: 8200 to 8299
Directions: E-W, N-S, SE-NW, SW-NE
Address range: 8200 to 8299
Dan Ct
Length: 0.06 miles
Directions: E-W, N-S, SE-NW, SW-NE
Directions: E-W, N-S, SE-NW, SW-NE
Cape View Ct
Length: 0.05 miles
Directions: N-S, SE-NW
Directions: N-S, SE-NW
Woody Ct
Length: 0.04 miles
Direction: E-W
Direction: E-W
Tallwood Ct
Length: 0.03 miles
Direction: N-S
Direction: N-S
Other features:
Little Crk
Length: 0.28 miles
Direction: SW-NE
Direction: SW-NE