Lynbrook neighborhood in San Jose, California (CA), 95129 detailed profile
Settings
X


Business Search - 14 Million verified businesses
Area: 0.393 square miles
Population: 2,464
Population density:
| Lynbrook: | 6,265 people per square mile |
| San Jose: | 5,554 people per square mile |

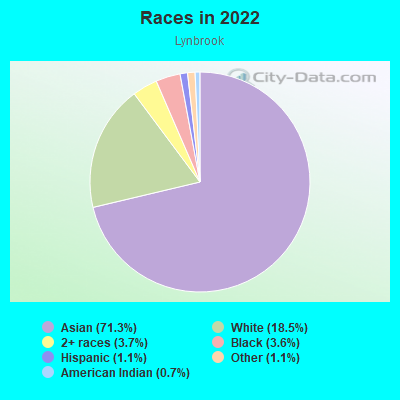
- 1,82571.3%Asian
- 47318.5%White
- 953.7%Two or more races
- 913.6%Black
- 271.1%Some other race
- 291.1%Hispanic or Latino
- 190.7%American Indian
Median household income in 2022:
| Lynbrook: | $183,679 |
| San Jose: | $133,835 |
Distribution of median household income
![Distribution of median household income]()
- 18Less than $10,000
- 31$10,000 to $19,999
- 35$20,000 to $29,999
- 31$30,000 to $39,999
- 44$40,000 to $49,999
- 42$50,000 to $59,999
- 22$60,000 to $74,999
- 71$75,000 to $99,999
- 17$100,000 to $124,999
- 21$125,000 to $149,999
- 141$150,000 to $199,999
- 531$200,000 or more

Distribution of owner-occupied house/condo value
![Distribution of owner-occupied house/condo value]()
- 16Less than $50,000
- 19$100,000 to $149,999
- 50$150,000 to $199,999
- 9$250,000 to $299,999
- 12$300,000 to $399,999
- 22$500,000 to $749,999
- 11$750,000 to $999,999
- 699$1,000,000 or more

Distribution of rent paid by renters
![Distribution of rent paid by renters]()
- 22$1,500 to $1,999
- 179$2,000 or more

Median rent in 2022:
| Lynbrook: | $3,378 |
| San Jose: | $2,001 |
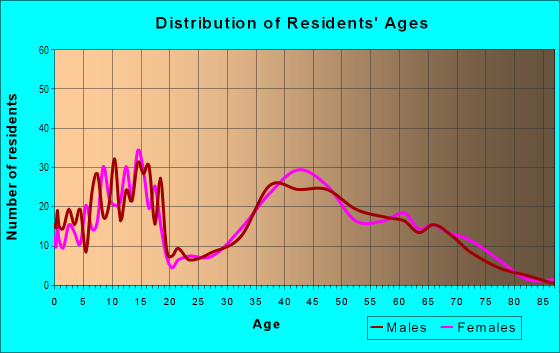
| Males: | 1,222 |
| Females: | 1,242 |
Males:
| This neighborhood: | 44.1 years |
| Whole city: | 37.6 years |
| This neighborhood: | 48.2 years |
| Whole city: | 39.1 years |
Average household size:
| Lynbrook: | 8.2 people |
| San Jose: | 2.9 people |
Percentage of family households:
| Lynbrook: | 60.7% |
| San Jose: | 49.9% |
| Here: | 79.3% |
| San Jose: | 53.0% |
Percentage of married-couple families with children (among all households):
| Lynbrook: | 31.5% |
| San Jose: | 25.8% |
Percentage of single-mother households (among all households):
| Lynbrook: | 3.5% |
| San Jose: | 5.2% |
Percentage of never married males 15 years old and over:
Percentage of never married females 15 years old and over:
| Lynbrook: | 12.3% |
| San Jose: | 20.9% |
Percentage of never married females 15 years old and over:
| Lynbrook: | 12.3% |
| city: | 16.7% |
Percentage of people that speak English not well or not at all:
| Lynbrook: | 5.1% |
| San Jose: | 11.4% |
Percentage of people born in this state:
Percentage of people born in another U.S. state:
Percentage of native residents but born outside the U.S.:
Percentage of foreign born residents:
| Here: | 31.8% |
| San Jose: | 46.1% |
Percentage of people born in another U.S. state:
| Lynbrook: | 17.2% |
| San Jose: | 10.4% |
Percentage of native residents but born outside the U.S.:
| Here: | 0.6% |
| city: | 1.7% |
Percentage of foreign born residents:
| Here: | 50.4% |
| San Jose: | 41.8% |

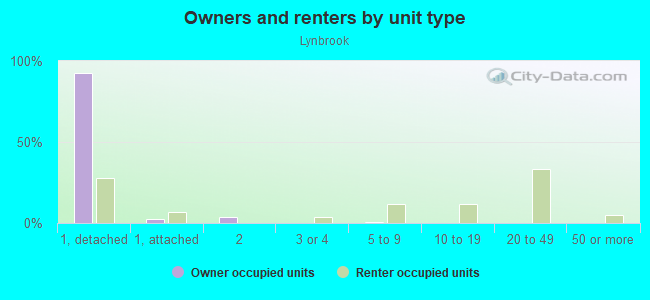
Owner-occupied
Renter-occupied

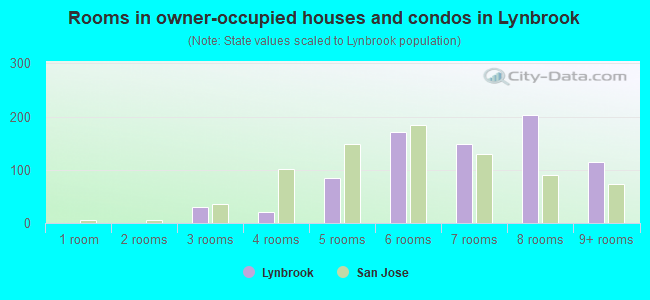
- Rooms in owner-occupied houses and condos in Lynbrook
- 01 room
- 02 rooms
- 303 rooms
- 204 rooms
- 855 rooms
- 1716 rooms
- 1497 rooms
- 2038 rooms
- 1149+ rooms
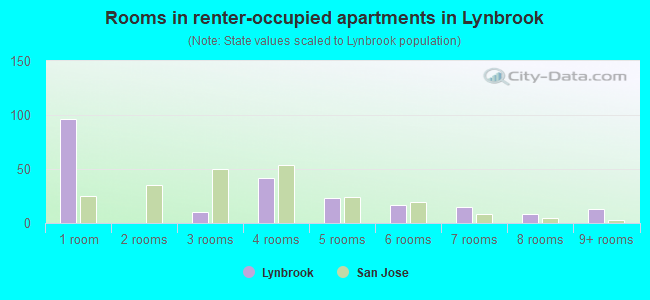
- Rooms in renter-occupied apartments in Lynbrook
- 961 room
- 02 rooms
- 103 rooms
- 424 rooms
- 235 rooms
- 176 rooms
- 157 rooms
- 88 rooms
- 139+ rooms
Owner-occupied
Renter-occupied
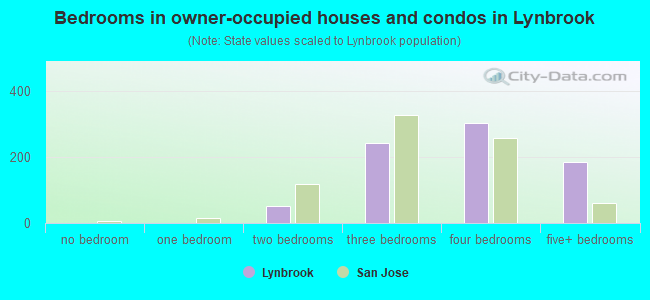
- Bedrooms in owner-occupied houses and condos in Lynbrook
- 0no bedroom
- 01 bedroom
- 512 bedrooms
- 2443 bedrooms
- 3054 bedrooms
- 1865+ bedrooms
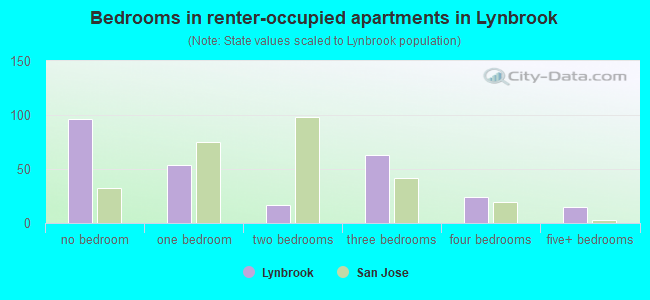
- Bedrooms in renter-occupied apartments in Lynbrook
- 96no bedroom
- 541 bedroom
- 172 bedrooms
- 633 bedrooms
- 244 bedrooms
- 155+ bedrooms
Average number of cars or other vehicles available in houses/condos:
Average number of cars or other vehicles available in apartments:
| This neighborhood: | 2.5 |
| San Jose: | 2.3 |
Average number of cars or other vehicles available in apartments:
| Here: | 1.6 |
| city: | 1.6 |
Percentage of units with a mortgage:
| Lynbrook: | 65.8% |
| San Jose: | 66.9% |
Average estimated value of detached houses in 2022 (98.3% of all units):
| Lynbrook: | $2,412,590 |
| San Jose: | $1,532,815 |
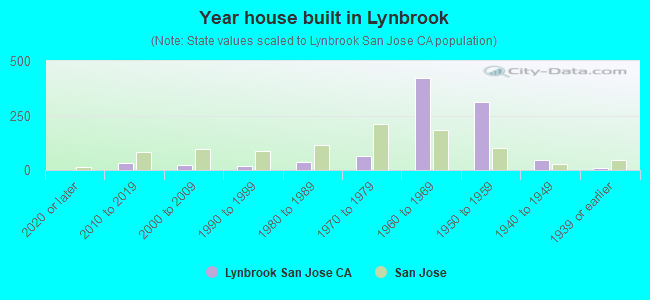
- Year house built in Lynbrook
- 02020 or later
- 322010 to 2019
- 232000 to 2009
- 171990 to 1999
- 361980 to 1989
- 661970 to 1979
- 4231960 to 1969
- 3101950 to 1959
- 481940 to 1949
- 101939 or earlier
City-data.com crime index for city in 2020 (higher means more crime):
| City: | 268.4 |
| U.S. average: | 219.5 |
Travel time to work (commute)
![Travel time to work (commute)]()
- 77Less than 5 minutes
- 205 to 9 minutes
- 2310 to 14 minutes
- 13215 to 19 minutes
- 21020 to 24 minutes
- 10525 to 29 minutes
- 11930 to 34 minutes
- 3435 to 39 minutes
- 2840 to 44 minutes
- 14945 to 59 minutes
- 2460 to 89 minutes
- 2290 or more minutes

Means of transportation to work
![Means of transportation to work]()
- 61.4%771Drove a car alone
- 3.9%49Carpooled
- 1.9%24Bus
- 1.7%21Subway or elevated rail
- 6.4%80Long-distance train or commuter rail
- 0.4%5Motorcycle
- 0.4%5Bicycle
- 3.9%49Walked
- 7.4%93Other means
- 33.1%415Worked at home

Time leaving home to go to work
![Time leaving home to go to work]()
- 5212:00 a.m. to 4:59 a.m.
- 95:00 a.m. to 5:29 a.m.
- 325:30 a.m. to 5:59 a.m.
- 166:00 a.m. to 6:29 a.m.
- 196:30 a.m. to 6:59 a.m.
- 387:00 a.m. to 7:29 a.m.
- 797:30 a.m. to 7:59 a.m.
- 1568:00 a.m. to 8:29 a.m.
- 1868:30 a.m. to 8:59 a.m.
- 2459:00 a.m. to 9:59 a.m.
- 5310:00 a.m. to 10:59 a.m.
- 1411:00 a.m. to 11:59 a.m.
- 1112:00 p.m. to 3:59 p.m.
- 284:00 p.m. to 11:59 p.m.

Occupations of males:
- Percentage of males in management occupations (except farmers):
Here: 21.9% city: 13.0%
- Percentage of males in business and financial operations occupations:
Here: 4.3% city: 4.6%
- Percentage of males in computer and mathematical occupations:
Here: 34.1% city: 13.6%
- Percentage of males in architecture and engineering occupations:
Here: 13.8% city: 10.2%
- Percentage of males in life, physical, and social science occupations:
Here: 2.0% city: 1.1%
- Percentage of males in arts, design, entertainment, sports, and media occupations:
Here: 3.7% city: 1.8%
- Percentage of males in sales and office occupations:
Here: 8.4% city: 12.8%
- Percentage of males in production occupations:
Here: 1.2% city: 5.5%
- Percentage of males in transportation occupations:
Here: 1.7% city: 3.6%
Occupations of females:
- Percentage of females in management occupations (except farmers):
Here: 11.9% city: 11.0%
- Percentage of females in business and financial operations occupations:
Here: 16.5% city: 8.6%
- Percentage of females in computer and mathematical occupations:
Here: 19.1% city: 5.4%
- Percentage of females in architecture and engineering occupations:
Here: 3.2% city: 2.8%
- Percentage of females in life, physical, and social science occupations:
Here: 1.6% city: 1.7%
- Percentage of females in community and social services occupations:
Here: 1.7% city: 1.8%
- Percentage of females in education, training, and library occupations:
Here: 13.4% city: 8.1%
- Percentage of females in arts, design, entertainment, sports, and media occupations:
Here: 2.8% city: 2.0%
- Percentage of females in healthcare practitioners and technical occupations:
Here: 12.4% city: 6.8%
- Percentage of females in service occupations:
Here: 2.4% city: 21.7%
- Percentage of females in sales and office occupations:
Here: 14.7% city: 22.0%
Education in this neighborhood (subdivision or community):
- Percentage of people 3 years and older in K-12 schools:
Lynbrook: 18.1% San Jose: 16.1%
- Percentage of people 3 years and older in undergraduate colleges:
Lynbrook: 5.0% San Jose: 6.5%
- Percentage of people 3 years and older in grad. or professional schools:
Lynbrook: 2.5% San Jose: 2.0%
- Percentage of students K-12 enrolled in private schools:
Lynbrook: 23.9% San Jose: 14.9%
Percentage of population below poverty level:
| Lynbrook: | 0.4% |
| San Jose: | 9.0% |
Median year owner moved in (as recorded in 2022):
Median year renter moved in (as recorded in 2022):
| Lynbrook: | 1997 |
| San Jose: | 2008 |
Median year renter moved in (as recorded in 2022):
| Lynbrook: | 2017 |
| San Jose: | 2020 |
Percentage of married-couple families with both working:
| Lynbrook: | 83.7% |
| San Jose: | 72.5% |
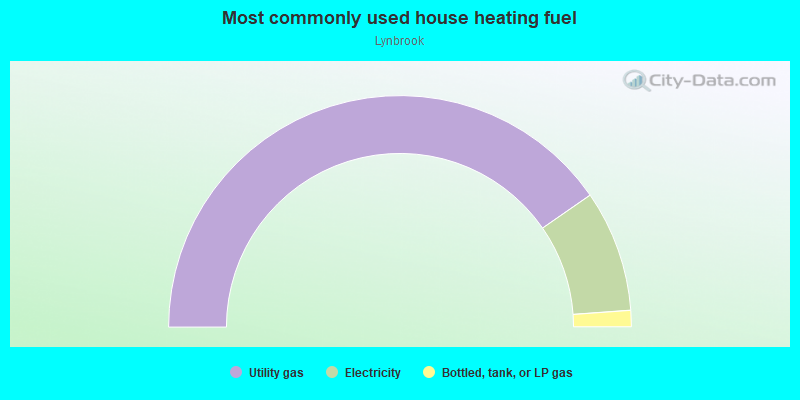
- 80.7%Utility gas
- 17.0%Electricity
- 2.3%Bottled, tank, or LP gas
Limited-access highways (interstate or state) in this neighborhood:
Lawrence Expy
Length: 0.77 miles
Directions: N-S, SW-NE
Directions: N-S, SW-NE
Roads and streets:
Huntingdon Dr
Length: 0.57 miles
Direction: N-S
Address range: 1000 to 1299
Direction: N-S
Address range: 1000 to 1299
Wunderlich Dr
Length: 0.52 miles
Directions: N-S, SW-NE
Address range: 1000 to 1299
Directions: N-S, SW-NE
Address range: 1000 to 1299
Castle Glen Ave
Length: 0.48 miles
Directions: E-W, SE-NW
Address range: 5400 to 5599
Directions: E-W, SE-NW
Address range: 5400 to 5599
Ora St
Length: 0.39 miles
Directions: E-W, SW-NE
Address range: 5400 to 5699
Directions: E-W, SW-NE
Address range: 5400 to 5699
Oak Knoll Dr
Length: 0.38 miles
Directions: E-W, N-S, SW-NE
Address range: 1200 to 1499
Directions: E-W, N-S, SW-NE
Address range: 1200 to 1499
Bentoak Ln
Length: 0.34 miles
Directions: E-W, N-S, SE-NW, SW-NE
Address range: 1000 to 1199
Directions: E-W, N-S, SE-NW, SW-NE
Address range: 1000 to 1199
Oaktree Dr
Length: 0.34 miles
Directions: E-W, N-S, SE-NW
Address range: 1000 to 1099
Directions: E-W, N-S, SE-NW
Address range: 1000 to 1099
Littleoak Cir
Length: 0.33 miles
Directions: E-W, N-S, SE-NW, SW-NE
Address range: 1100 to 1199
Directions: E-W, N-S, SE-NW, SW-NE
Address range: 1100 to 1199
Big Oak Dr
Length: 0.28 miles
Directions: E-W, N-S, SE-NW, SW-NE
Address range: 5500 to 5599
Directions: E-W, N-S, SE-NW, SW-NE
Address range: 5500 to 5599
Lynbrook Way
Length: 0.28 miles
Directions: E-W, N-S, SW-NE
Address range: 1100 to 1299
Directions: E-W, N-S, SW-NE
Address range: 1100 to 1299
Littleoak Dr
Length: 0.27 miles
Directions: N-S, SW-NE
Address range: 1000 to 1199
Directions: N-S, SW-NE
Address range: 1000 to 1199
Glen Haven Dr
Length: 0.26 miles
Directions: N-S, SE-NW, SW-NE
Address range: 1200 to 1399
Directions: N-S, SE-NW, SW-NE
Address range: 1200 to 1399
Regency Dr
Length: 0.24 miles
Directions: N-S, SW-NE
Address range: 1200 to 1399
Directions: N-S, SW-NE
Address range: 1200 to 1399
Bollinger Rd
Length: 0.23 miles
Direction: E-W
Address range: 5400 to 5598
Direction: E-W
Address range: 5400 to 5598
Castle Manor Dr
Length: 0.19 miles
Direction: E-W
Address range: 5400 to 5599
Direction: E-W
Address range: 5400 to 5599
Kaveny Dr
Length: 0.17 miles
Directions: E-W, N-S, SW-NE
Address range: 5400 to 5499
Directions: E-W, N-S, SW-NE
Address range: 5400 to 5499
Green Oak Dr
Length: 0.16 miles
Direction: E-W
Address range: 5500 to 5581
Direction: E-W
Address range: 5500 to 5581
Whiteoak Dr
Length: 0.10 miles
Directions: E-W, N-S
Address range: 1000 to 1099
Directions: E-W, N-S
Address range: 1000 to 1099
Oak Park Dr
Length: 0.10 miles
Directions: E-W, N-S, SE-NW, SW-NE
Address range: 5400 to 5599
Directions: E-W, N-S, SE-NW, SW-NE
Address range: 5400 to 5599
Glen Haven Ct
Length: 0.10 miles
Direction: E-W
Address range: 5600 to 5699
Direction: E-W
Address range: 5600 to 5699
Blackoak Way
Length: 0.08 miles
Direction: E-W
Address range: 5400 to 5499
Direction: E-W
Address range: 5400 to 5499
Glenoak Ct
Length: 0.06 miles
Direction: E-W
Address range: 5500 to 5599
Direction: E-W
Address range: 5500 to 5599
Kimberly St
Length: 0.06 miles
Directions: E-W, SE-NW
Address range: 5500 to 5599
Directions: E-W, SE-NW
Address range: 5500 to 5599
Big Oak Ct
Length: 0.05 miles
Direction: N-S
Address range: 1000 to 1099
Direction: N-S
Address range: 1000 to 1099
Regency Pl
Length: 0.05 miles
Direction: E-W
Address range: 1200 to 1299
Direction: E-W
Address range: 1200 to 1299
Bentoak Ct
Length: 0.05 miles
Direction: E-W
Address range: 1100 to 1199
Direction: E-W
Address range: 1100 to 1199
Oakhurst Ct
Length: 0.04 miles
Directions: E-W, SW-NE
Address range: 5500 to 5599
Directions: E-W, SW-NE
Address range: 5500 to 5599
Glennan Ct
Length: 0.03 miles
Direction: E-W
Address range: 5400 to 5499
Direction: E-W
Address range: 5400 to 5499
Other features:
Saratoga Crk
Length: 0.84 miles
Directions: N-S, SE-NW, SW-NE
Directions: N-S, SE-NW, SW-NE