Homeview neighborhood in Belmont, Aghnajane, California (CA), 94002, 94065 detailed profile
Settings
X


Business Search - 14 Million verified businesses
Area: 0.325 square miles
Population: 916
Population density:
| Homeview: | 2,822 people per square mile |
| Belmont: | 6,147 people per square mile |

- 37331.0%White
- 28723.9%Native Hawaiian and Other
Pacific Islander - 25120.9%Asian
- 20016.6%Hispanic or Latino
- 504.2%Two or more races
- 282.3%Black
- 121.0%Some other race
- 10.08%American Indian

Distribution of median household income
![Distribution of median household income]()
- 19Less than $10,000
- 149$10,000 to $19,999
- 63$20,000 to $29,999
- 24$30,000 to $39,999
- 21$40,000 to $49,999
- 30$50,000 to $59,999
- 13$60,000 to $74,999
- 25$75,000 to $99,999
- 50$100,000 to $124,999
- 25$125,000 to $149,999
- 34$150,000 to $199,999
- 137$200,000 or more

Distribution of owner-occupied house/condo value
![Distribution of owner-occupied house/condo value]()
- 43Less than $50,000
- 22$50,000 to $99,999
- 9$100,000 to $149,999
- 5$150,000 to $199,999
- 4$200,000 to $249,999
- 4$300,000 to $399,999
- 14$400,000 to $499,999
- 11$500,000 to $749,999
- 19$750,000 to $999,999
- 144$1,000,000 or more

Distribution of rent paid by renters
![Distribution of rent paid by renters]()
- 4$100 to $199
- 79$200 to $299
- 300$300 to $399
- 17$400 to $499
- 21$500 to $599
- 12$700 to $799
- 20$800 to $899
- 4$900 to $999
- 36$1,000 to $1,249
- 22$1,250 to $1,499
- 25$1,500 to $1,999
- 174$2,000 or more

Median rent in 2022:
| Homeview: | $2,682 |
| Belmont: | $2,001 |
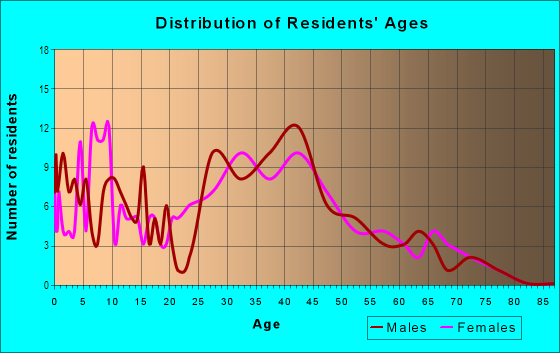
| Males: | 464 |
| Females: | 452 |
Males:
| This neighborhood: | 39.9 years |
| Whole city: | 40.1 years |
| This neighborhood: | 39.9 years |
| Whole city: | 41.5 years |
Average household size:
| Homeview: | 5.0 people |
| Belmont: | 2.5 people |
Percentage of family households:
| Homeview: | 53.5% |
| Belmont: | 53.9% |
| Here: | 47.2% |
| Belmont: | 60.1% |
Percentage of married-couple families with children (among all households):
| Homeview: | 30.6% |
| Belmont: | 34.5% |
Percentage of single-mother households (among all households):
| Homeview: | 4.7% |
| Belmont: | 3.1% |
Percentage of never married males 15 years old and over:
Percentage of never married females 15 years old and over:
| Homeview: | 20.1% |
| Belmont: | 15.9% |
Percentage of never married females 15 years old and over:
| Homeview: | 17.6% |
| city: | 13.0% |
Percentage of people that speak English not well or not at all:
| Homeview: | 3.1% |
| Belmont: | 2.5% |
Percentage of people born in this state:
Percentage of people born in another U.S. state:
Percentage of native residents but born outside the U.S.:
Percentage of foreign born residents:
| Here: | 44.3% |
| Belmont: | 49.1% |
Percentage of people born in another U.S. state:
| Homeview: | 17.3% |
| Belmont: | 19.5% |
Percentage of native residents but born outside the U.S.:
| Here: | 1.7% |
| city: | 1.7% |
Percentage of foreign born residents:
| Here: | 36.8% |
| Belmont: | 29.7% |

Owner-occupied
Renter-occupied


- Rooms in owner-occupied houses and condos in Homeview
- 01 room
- 222 rooms
- 123 rooms
- 594 rooms
- 325 rooms
- 276 rooms
- 257 rooms
- 118 rooms
- 79+ rooms

- Rooms in renter-occupied apartments in Homeview
- 281 room
- 912 rooms
- 333 rooms
- 574 rooms
- 635 rooms
- 176 rooms
- 237 rooms
- 38 rooms
- 589+ rooms
Owner-occupied
Renter-occupied

- Bedrooms in owner-occupied houses and condos in Homeview
- 0no bedroom
- 181 bedroom
- 452 bedrooms
- 853 bedrooms
- 254 bedrooms
- 115+ bedrooms

- Bedrooms in renter-occupied apartments in Homeview
- 28no bedroom
- 411 bedroom
- 762 bedrooms
- 463 bedrooms
- 94 bedrooms
- 585+ bedrooms
Average number of cars or other vehicles available in houses/condos:
Average number of cars or other vehicles available in apartments:
| This neighborhood: | 2.0 |
| Belmont: | 2.2 |
Average number of cars or other vehicles available in apartments:
| Here: | 1.4 |
| city: | 1.4 |
Percentage of units with a mortgage:
| Homeview: | 64.3% |
| Belmont: | 71.5% |
Average estimated value of detached houses in 2022 (52.8% of all units):
| Homeview: | $1,690,028 |
| California: | $988,808 |

- Year house built in Homeview
- 02020 or later
- 202010 to 2019
- 282000 to 2009
- 991990 to 1999
- 181980 to 1989
- 251970 to 1979
- 501960 to 1969
- 711950 to 1959
- 951940 to 1949
- 121939 or earlier

City-data.com crime index for city in 2020 (higher means more crime):
| City: | 138.7 |
| U.S. average: | 219.5 |
Travel time to work (commute)
![Travel time to work (commute)]()
- 6Less than 5 minutes
- 175 to 9 minutes
- 5010 to 14 minutes
- 6015 to 19 minutes
- 3320 to 24 minutes
- 1725 to 29 minutes
- 3730 to 34 minutes
- 2935 to 39 minutes
- 1940 to 44 minutes
- 3145 to 59 minutes
- 2760 to 89 minutes
- 1290 or more minutes

Means of transportation to work
![Means of transportation to work]()
- 55.1%272Drove a car alone
- 5.7%28Carpooled
- 8.3%41Bus
- 3.4%17Subway or elevated rail
- 2.6%13Long-distance train or commuter rail
- 8.3%41Light rail, streetcar or trolley
- 0.2%1Taxi
- 22.5%111Motorcycle
- 5.5%27Bicycle
- 5.5%27Walked
- 1.2%6Other means
- 28.6%141Worked at home

Time leaving home to go to work
![Time leaving home to go to work]()
- 412:00 a.m. to 4:59 a.m.
- 65:00 a.m. to 5:29 a.m.
- 35:30 a.m. to 5:59 a.m.
- 186:00 a.m. to 6:29 a.m.
- 256:30 a.m. to 6:59 a.m.
- 277:00 a.m. to 7:29 a.m.
- 367:30 a.m. to 7:59 a.m.
- 838:00 a.m. to 8:29 a.m.
- 308:30 a.m. to 8:59 a.m.
- 569:00 a.m. to 9:59 a.m.
- 2010:00 a.m. to 10:59 a.m.
- 311:00 a.m. to 11:59 a.m.
- 1812:00 p.m. to 3:59 p.m.
- 94:00 p.m. to 11:59 p.m.

Occupations of males:
- Percentage of males in management occupations (except farmers):
Here: 15.7% city: 22.2%
- Percentage of males in business and financial operations occupations:
Here: 13.7% city: 7.5%
- Percentage of males in computer and mathematical occupations:
Here: 11.5% city: 18.4%
- Percentage of males in architecture and engineering occupations:
Here: 5.1% city: 9.3%
- Percentage of males in legal occupations:
Here: 1.8% city: 2.2%
- Percentage of males in education, training, and library occupations:
Here: 6.0% city: 3.7%
- Percentage of males in arts, design, entertainment, sports, and media occupations:
Here: 10.8% city: 2.3%
- Percentage of males in healthcare practitioners and technical occupations:
Here: 1.1% city: 2.8%
- Percentage of males in service occupations:
Here: 13.3% city: 8.1%
- Percentage of males in sales and office occupations:
Here: 11.8% city: 7.4%
- Percentage of males in farming, fishing, and forestry occupations:
Here: 3.1% city: 0.2%
- Percentage of males in construction, extraction, and maintenance occupations:
Here: 1.5% city: 2.8%
- Percentage of males in transportation occupations:
Here: 1.6% city: 1.5%
Occupations of females:
- Percentage of females in management occupations (except farmers):
Here: 19.6% city: 21.7%
- Percentage of females in business and financial operations occupations:
Here: 3.6% city: 10.5%
- Percentage of females in computer and mathematical occupations:
Here: 6.9% city: 5.8%
- Percentage of females in life, physical, and social science occupations:
Here: 5.2% city: 4.4%
- Percentage of females in community and social services occupations:
Here: 2.6% city: 1.1%
- Percentage of females in legal occupations:
Here: 3.4% city: 1.3%
- Percentage of females in education, training, and library occupations:
Here: 2.6% city: 8.2%
- Percentage of females in arts, design, entertainment, sports, and media occupations:
Here: 4.7% city: 7.9%
- Percentage of females in healthcare practitioners and technical occupations:
Here: 7.9% city: 7.1%
- Percentage of females in service occupations:
Here: 13.9% city: 8.5%
- Percentage of females in sales and office occupations:
Here: 20.5% city: 17.0%
- Percentage of females in material moving occupations:
Here: 3.5% city: 0.2%
Education in this neighborhood (subdivision or community):
- Percentage of people 3 years and older in K-12 schools:
Homeview: 21.6% Belmont: 17.9%
- Percentage of people 3 years and older in undergraduate colleges:
Homeview: 3.6% Belmont: 5.0%
- Percentage of people 3 years and older in grad. or professional schools:
Homeview: 2.7% Belmont: 1.3%
- Percentage of students K-12 enrolled in private schools:
Homeview: 45.0% Belmont: 9.7%
Percentage of population below poverty level:
| Homeview: | 10.2% |
| Belmont: | 6.9% |
Median year owner moved in (as recorded in 2022):
Median year renter moved in (as recorded in 2022):
| Homeview: | 2005 |
| Belmont: | 2005 |
Median year renter moved in (as recorded in 2022):
| Homeview: | 2015 |
| Belmont: | 2017 |
Percentage of married-couple families with both working:
| Homeview: | 77.2% |
| Belmont: | 73.7% |

- 45.4%Electricity
- 44.4%Utility gas
- 3.2%Bottled, tank, or LP gas
- 3.1%No fuel used
- 2.0%Wood
- 1.1%Solar energy
- 0.7%Other fuel
Limited-access highways (interstate or state) in this neighborhood:
Bayshore Fwy (US Hwy 101)
Length: 0.52 miles
Direction: SE-NW
Direction: SE-NW
Roads and streets:
Ralston Ave
Length: 0.79 miles
Directions: E-W, SW-NE
Address range: 300 to 749
Directions: E-W, SW-NE
Address range: 300 to 749
Harbor Blvd
Length: 0.57 miles
Direction: SW-NE
Address range: 100 to 699
Direction: SW-NE
Address range: 100 to 699
US Hwy 101
Length: 0.51 miles
Directions: E-W, SE-NW
Directions: E-W, SE-NW
Oneill Ave
Length: 0.47 miles
Directions: N-S, SW-NE
Address range: 100 to 699
Directions: N-S, SW-NE
Address range: 100 to 699
Old County Rd
Length: 0.47 miles
Direction: SE-NW
Address range: 1000 to 1299
Direction: SE-NW
Address range: 1000 to 1299
Elmer St
Length: 0.36 miles
Direction: SE-NW
Address range: 1000 to 1499
Direction: SE-NW
Address range: 1000 to 1499
Shoreway Rd
Length: 0.28 miles
Directions: N-S, SE-NW, SW-NE
Address range: 1000 to 1299
Directions: N-S, SE-NW, SW-NE
Address range: 1000 to 1299
Hiller St
Length: 0.22 miles
Direction: SE-NW
Address range: 914 to 1299
Direction: SE-NW
Address range: 914 to 1299
Granada St
Length: 0.20 miles
Direction: SE-NW
Address range: 912 to 1299
Direction: SE-NW
Address range: 912 to 1299
Irwin St
Length: 0.19 miles
Direction: SE-NW
Address range: 1000 to 1299
Direction: SE-NW
Address range: 1000 to 1299
Kedith St
Length: 0.19 miles
Direction: SE-NW
Address range: 1000 to 1299
Direction: SE-NW
Address range: 1000 to 1299
Judson St
Length: 0.19 miles
Direction: SE-NW
Address range: 1000 to 1299
Direction: SE-NW
Address range: 1000 to 1299
Furlong St
Length: 0.18 miles
Direction: SE-NW
Address range: 1000 to 1299
Direction: SE-NW
Address range: 1000 to 1299
Karen Rd
Length: 0.15 miles
Direction: SE-NW
Address range: 1 to 99
Direction: SE-NW
Address range: 1 to 99
Sem Ln
Length: 0.14 miles
Direction: SW-NE
Address range: 100 to 199
Direction: SW-NE
Address range: 100 to 199
Dairy Ln
Length: 0.14 miles
Direction: SE-NW
Address range: 1 to 99
Direction: SE-NW
Address range: 1 to 99
Twin Dolphin Dr
Length: 0.12 miles
Directions: E-W, SE-NW
Address range: 100 to 229
Directions: E-W, SE-NW
Address range: 100 to 229
Industrial Way
Length: 0.11 miles
Direction: SE-NW
Address range: 1500 to 1567
Direction: SE-NW
Address range: 1500 to 1567
Waltermire St
Length: 0.09 miles
Direction: SW-NE
Address range: 600 to 699
Direction: SW-NE
Address range: 600 to 699
Karen Way
Length: 0.02 miles
Direction: SE-NW
Direction: SE-NW
Railroad features:
Joint Powers Authority RR (Union Pacific RR)
Length: 0.35 miles
Direction: SE-NW
Direction: SE-NW
Freight
Length: 0.31 miles
Directions: E-W, SE-NW
Directions: E-W, SE-NW
Caltrain
Length: 0.28 miles
Direction: SE-NW
Direction: SE-NW