Glenwood Estates neighborhood in Overland Park, Kansas (KS), 66212 detailed profile
Settings
X

Business Search - 14 Million verified businesses
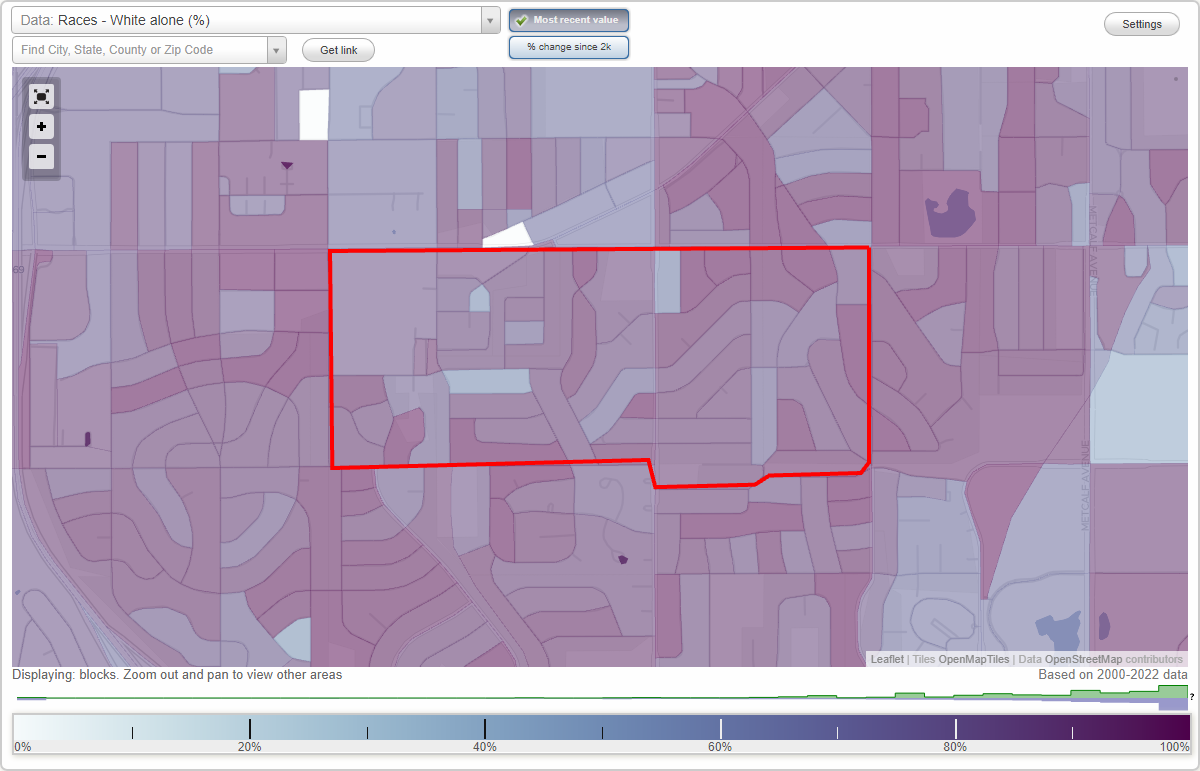
Area: 0.632 square miles
Population: 2,474
Population density:
| Glenwood Estates: | 3,914 people per square mile |
| Overland Park: | 3,485 people per square mile |

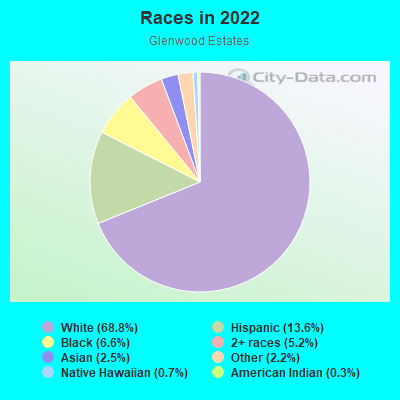
- 1,80368.8%White
- 35713.6%Hispanic or Latino
- 1726.6%Black
- 1365.2%Two or more races
- 662.5%Asian
- 582.2%Some other race
- 180.7%Native Hawaiian and Other
Pacific Islander - 90.3%American Indian
Median household income in 2022:
| Glenwood Estates: | $105,901 |
| Overland Park: | $96,694 |
Distribution of median household income
![Distribution of median household income]()
- 19Less than $10,000
- 110$10,000 to $19,999
- 153$20,000 to $29,999
- 122$30,000 to $39,999
- 82$40,000 to $49,999
- 149$50,000 to $59,999
- 139$60,000 to $74,999
- 159$75,000 to $99,999
- 91$100,000 to $124,999
- 132$125,000 to $149,999
- 152$150,000 to $199,999
- 63$200,000 or more

Distribution of owner-occupied house/condo value
![Distribution of owner-occupied house/condo value]()
- 98Less than $50,000
- 54$50,000 to $99,999
- 30$100,000 to $149,999
- 155$150,000 to $199,999
- 375$200,000 to $249,999
- 274$250,000 to $299,999
- 106$300,000 to $399,999
- 31$400,000 to $499,999
- 13$500,000 to $749,999
- 40$750,000 to $999,999

Distribution of rent paid by renters
![Distribution of rent paid by renters]()
- 43$400 to $499
- 27$500 to $599
- 41$700 to $799
- 32$800 to $899
- 123$900 to $999
- 200$1,000 to $1,249
- 110$1,250 to $1,499
- 44$1,500 to $1,999
- 34$2,000 or more

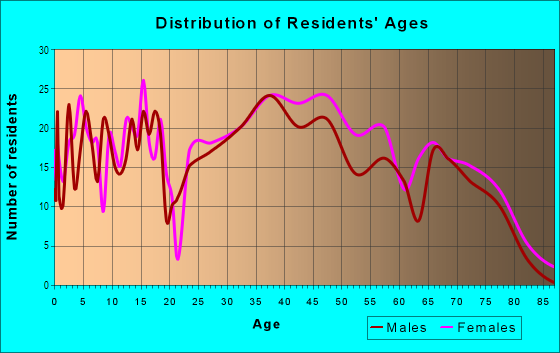
| Males: | 1,235 |
| Females: | 1,238 |
Males:
| This neighborhood: | 38.7 years |
| Whole city: | 37.7 years |
| This neighborhood: | 40.2 years |
| Whole city: | 38.8 years |
Average household size:
| Glenwood Estates: | 2.3 people |
| Overland Park: | 2.3 people |
Percentage of family households:
| Glenwood Estates: | 36.4% |
| Overland Park: | 42.1% |
| Here: | 46.8% |
| Overland Park: | 48.0% |
Percentage of married-couple families with children (among all households):
| Glenwood Estates: | 27.3% |
| Overland Park: | 37.4% |
Percentage of single-mother households (among all households):
| Glenwood Estates: | 7.7% |
| Overland Park: | 4.2% |
Percentage of never married males 15 years old and over:
Percentage of never married females 15 years old and over:
| Glenwood Estates: | 10.7% |
| Overland Park: | 17.2% |
Percentage of never married females 15 years old and over:
| Glenwood Estates: | 12.2% |
| city: | 15.1% |
Percentage of people that speak English not well or not at all:
| Glenwood Estates: | 1.8% |
| Overland Park: | 1.4% |
Percentage of people born in this state:
Percentage of people born in another U.S. state:
Percentage of native residents but born outside the U.S.:
Percentage of foreign born residents:
| Here: | 39.0% |
| Overland Park: | 37.4% |
Percentage of people born in another U.S. state:
| Glenwood Estates: | 50.5% |
| Overland Park: | 50.4% |
Percentage of native residents but born outside the U.S.:
| Here: | 2.5% |
| city: | 0.9% |
Percentage of foreign born residents:
| Here: | 8.1% |
| Overland Park: | 11.3% |
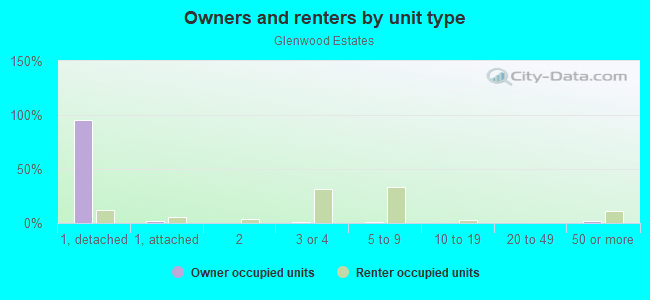
Owner-occupied
Renter-occupied

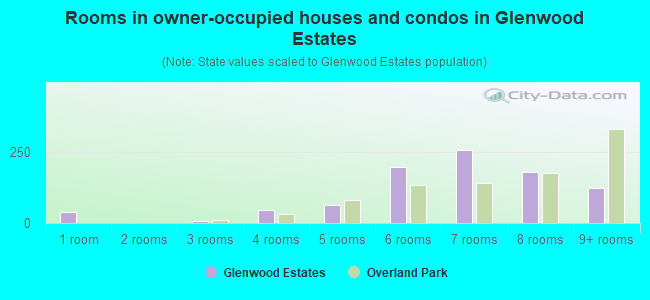
- Rooms in owner-occupied houses and condos in Glenwood Estates
- 391 room
- 02 rooms
- 63 rooms
- 464 rooms
- 625 rooms
- 1976 rooms
- 2567 rooms
- 1778 rooms
- 1219+ rooms
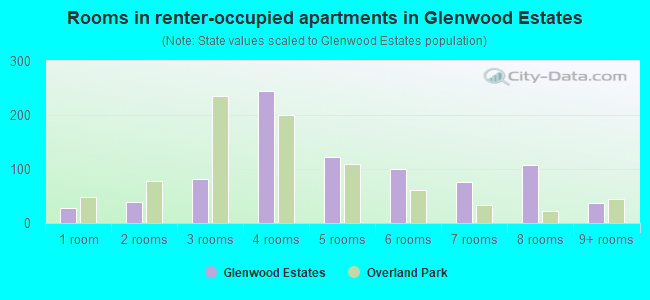
- Rooms in renter-occupied apartments in Glenwood Estates
- 271 room
- 392 rooms
- 823 rooms
- 2444 rooms
- 1235 rooms
- 1006 rooms
- 767 rooms
- 1078 rooms
- 379+ rooms
Owner-occupied
Renter-occupied
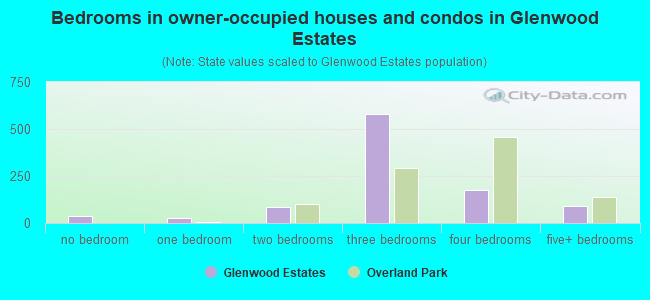
- Bedrooms in owner-occupied houses and condos in Glenwood Estates
- 39no bedroom
- 291 bedroom
- 862 bedrooms
- 5803 bedrooms
- 1744 bedrooms
- 905+ bedrooms
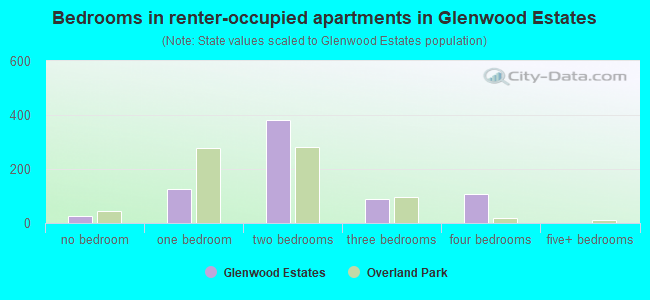
- Bedrooms in renter-occupied apartments in Glenwood Estates
- 27no bedroom
- 1251 bedroom
- 3832 bedrooms
- 883 bedrooms
- 1074 bedrooms
- 05+ bedrooms
Average number of cars or other vehicles available in houses/condos:
Average number of cars or other vehicles available in apartments:
| This neighborhood: | 2.4 |
| Overland Park: | 2.0 |
Average number of cars or other vehicles available in apartments:
| Here: | 2.4 |
| city: | 1.3 |
Percentage of units with a mortgage:
| Glenwood Estates: | 57.6% |
| Overland Park: | 67.7% |
Average estimated value of detached houses in 2022 (81.0% of all units):
| Glenwood Estates: | $240,460 |
| Kansas: | $264,181 |
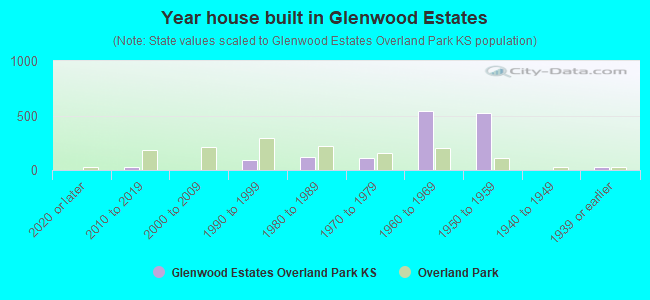
- Year house built in Glenwood Estates
- 02020 or later
- 262010 to 2019
- 42000 to 2009
- 891990 to 1999
- 1231980 to 1989
- 1141970 to 1979
- 5451960 to 1969
- 5221950 to 1959
- 01940 to 1949
- 311939 or earlier
City-data.com crime index for city in 2020 (higher means more crime):
| City: | 154.8 |
| U.S. average: | 219.5 |
Travel time to work (commute)
![Travel time to work (commute)]()
- 26Less than 5 minutes
- 1985 to 9 minutes
- 21110 to 14 minutes
- 25015 to 19 minutes
- 34820 to 24 minutes
- 8525 to 29 minutes
- 11230 to 34 minutes
- 2435 to 39 minutes
- 2540 to 44 minutes
- 6745 to 59 minutes
- 890 or more minutes

Means of transportation to work
![Means of transportation to work]()
- 77.8%1,155Drove a car alone
- 9.6%143Carpooled
- 3.7%55Walked
- 3.9%58Other means
- 15.1%224Worked at home

Time leaving home to go to work
![Time leaving home to go to work]()
- 5112:00 a.m. to 4:59 a.m.
- 135:00 a.m. to 5:29 a.m.
- 755:30 a.m. to 5:59 a.m.
- 1116:00 a.m. to 6:29 a.m.
- 1166:30 a.m. to 6:59 a.m.
- 1297:00 a.m. to 7:29 a.m.
- 2547:30 a.m. to 7:59 a.m.
- 1908:00 a.m. to 8:29 a.m.
- 1248:30 a.m. to 8:59 a.m.
- 969:00 a.m. to 9:59 a.m.
- 610:00 a.m. to 10:59 a.m.
- 2111:00 a.m. to 11:59 a.m.
- 6312:00 p.m. to 3:59 p.m.
- 1074:00 p.m. to 11:59 p.m.

Occupations of males:
- Percentage of males in management occupations (except farmers):
Here: 7.9% city: 17.2%
- Percentage of males in business and financial operations occupations:
Here: 11.6% city: 9.9%
- Percentage of males in computer and mathematical occupations:
Here: 4.6% city: 11.2%
- Percentage of males in architecture and engineering occupations:
Here: 5.8% city: 5.0%
- Percentage of males in community and social services occupations:
Here: 8.4% city: 0.9%
- Percentage of males in education, training, and library occupations:
Here: 1.2% city: 2.4%
- Percentage of males in arts, design, entertainment, sports, and media occupations:
Here: 1.0% city: 2.6%
- Percentage of males in healthcare practitioners and technical occupations:
Here: 4.6% city: 4.1%
- Percentage of males in service occupations:
Here: 9.6% city: 9.7%
- Percentage of males in sales and office occupations:
Here: 17.1% city: 19.9%
- Percentage of males in construction, extraction, and maintenance occupations:
Here: 8.3% city: 2.8%
- Percentage of males in transportation occupations:
Here: 9.4% city: 3.0%
- Percentage of males in material moving occupations:
Here: 6.3% city: 2.7%
Occupations of females:
- Percentage of females in management occupations (except farmers):
Here: 24.3% city: 10.8%
- Percentage of females in business and financial operations occupations:
Here: 2.3% city: 10.2%
- Percentage of females in computer and mathematical occupations:
Here: 4.1% city: 4.6%
- Percentage of females in life, physical, and social science occupations:
Here: 1.0% city: 1.2%
- Percentage of females in community and social services occupations:
Here: 1.9% city: 2.4%
- Percentage of females in education, training, and library occupations:
Here: 3.7% city: 10.8%
- Percentage of females in arts, design, entertainment, sports, and media occupations:
Here: 4.4% city: 2.8%
- Percentage of females in healthcare practitioners and technical occupations:
Here: 5.9% city: 12.1%
- Percentage of females in service occupations:
Here: 23.9% city: 13.8%
- Percentage of females in sales and office occupations:
Here: 28.4% city: 25.2%
Percentage of people 16-64 in Armed Forces:
| Glenwood Estates: | 0.1% |
| Overland Park: | 0.1% |
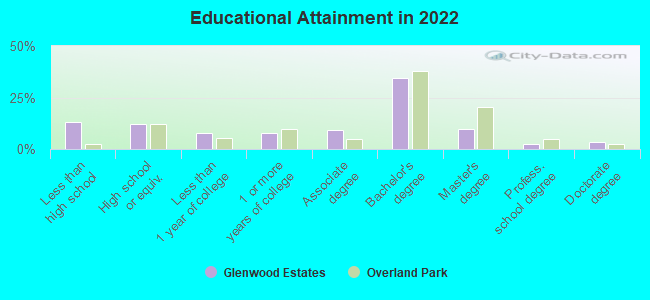
Education in this neighborhood (subdivision or community):
- Percentage of people 3 years and older in K-12 schools:
Glenwood Estates: 31.9% Overland Park: 15.4%
- Percentage of people 3 years and older in undergraduate colleges:
Glenwood Estates: 5.2% Overland Park: 3.4%
- Percentage of people 3 years and older in grad. or professional schools:
Glenwood Estates: 4.8% Overland Park: 2.3%
- Percentage of students K-12 enrolled in private schools:
Glenwood Estates: 13.0% Overland Park: 14.1%
Percentage of population below poverty level:
| Glenwood Estates: | 2.6% |
| Overland Park: | 5.0% |
Median year owner moved in (as recorded in 2022):
| Glenwood Estates: | 2008 |
| Overland Park: | 2013 |
Percentage of married-couple families with both working:
| Glenwood Estates: | 121.9% |
| Overland Park: | 75.4% |
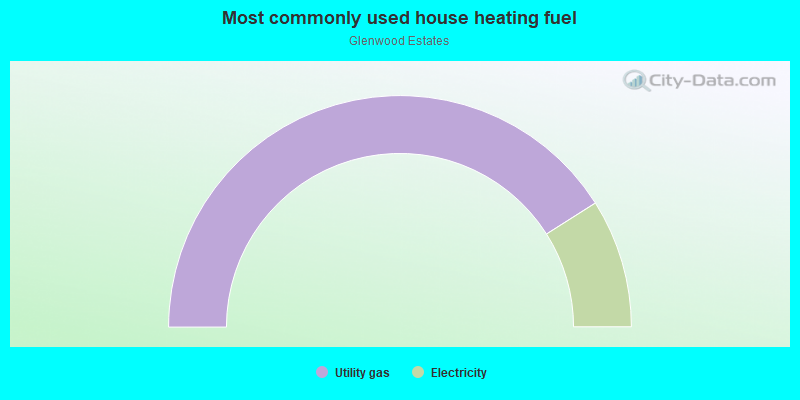
- 82.0%Utility gas
- 18.0%Electricity
Roads and streets:
W 89th St
Length: 1.45 miles
Directions: E-W, N-S, SW-NE
Address range: 8000 to 9699
Directions: E-W, N-S, SW-NE
Address range: 8000 to 9699
W 88th St
Length: 1.04 miles
Directions: E-W, SE-NW, SW-NE
Address range: 8200 to 9899
Directions: E-W, SE-NW, SW-NE
Address range: 8200 to 9899
W 90th Ter
Length: 0.77 miles
Directions: E-W, N-S, SE-NW, SW-NE
Address range: 8400 to 9399
Directions: E-W, N-S, SE-NW, SW-NE
Address range: 8400 to 9399
W 90th St
Length: 0.67 miles
Direction: E-W
Address range: 8400 to 9499
Direction: E-W
Address range: 8400 to 9499
W 88th Ter
Length: 0.64 miles
Directions: E-W, SE-NW, SW-NE
Address range: 8400 to 9499
Directions: E-W, SE-NW, SW-NE
Address range: 8400 to 9499
W 91st St
Length: 0.60 miles
Direction: E-W
Address range: 8000 to 9819
Direction: E-W
Address range: 8000 to 9819
Hemlock St (Hemlock Dr)
Length: 0.56 miles
Directions: E-W, N-S, SW-NE
Address range: 8800 to 9157
Directions: E-W, N-S, SW-NE
Address range: 8800 to 9157
Grant St
Length: 0.44 miles
Directions: N-S, SE-NW
Address range: 8720 to 9099
Directions: N-S, SE-NW
Address range: 8720 to 9099
Hadley St
Length: 0.44 miles
Direction: N-S
Address range: 8801 to 9099
Direction: N-S
Address range: 8801 to 9099
Eby St
Length: 0.40 miles
Directions: N-S, SE-NW, SW-NE
Address range: 8723 to 9019
Directions: N-S, SE-NW, SW-NE
Address range: 8723 to 9019
W 89th Ter
Length: 0.36 miles
Directions: E-W, SW-NE
Address range: 9100 to 9799
Directions: E-W, SW-NE
Address range: 9100 to 9799
Antioch Rd
Length: 0.35 miles
Direction: N-S
Address range: 8800 to 9099
Direction: N-S
Address range: 8800 to 9099
Benson St
Length: 0.31 miles
Directions: E-W, N-S, SE-NW, SW-NE
Address range: 8792 to 8999
Directions: E-W, N-S, SE-NW, SW-NE
Address range: 8792 to 8999
W 87th Ter
Length: 0.25 miles
Directions: E-W, SE-NW, SW-NE
Address range: 9100 to 9499
Directions: E-W, SE-NW, SW-NE
Address range: 9100 to 9499
Slater St
Length: 0.24 miles
Directions: E-W, SW-NE
Address range: 8700 to 9099
Directions: E-W, SW-NE
Address range: 8700 to 9099
Hardy St
Length: 0.24 miles
Direction: SE-NW
Address range: 8900 to 9099
Direction: SE-NW
Address range: 8900 to 9099
Hadley Pl
Length: 0.23 miles
Directions: E-W, N-S, SE-NW, SW-NE
Address range: 8820 to 8999
Directions: E-W, N-S, SE-NW, SW-NE
Address range: 8820 to 8999
Knox Ln
Length: 0.22 miles
Directions: N-S, SE-NW, SW-NE
Address range: 8900 to 9099
Directions: N-S, SE-NW, SW-NE
Address range: 8900 to 9099
Goodman St
Length: 0.21 miles
Directions: E-W, N-S, SE-NW
Address range: 8727 to 9099
Directions: E-W, N-S, SE-NW
Address range: 8727 to 9099
Grandview Dr
Length: 0.19 miles
Directions: N-S, SE-NW
Address range: 8900 to 9019
Directions: N-S, SE-NW
Address range: 8900 to 9019
England St
Length: 0.17 miles
Directions: N-S, SE-NW
Address range: 8700 to 8899
Directions: N-S, SE-NW
Address range: 8700 to 8899
Carter Cir
Length: 0.16 miles
Directions: N-S, SE-NW, SW-NE
Address range: 8900 to 9099
Directions: N-S, SE-NW, SW-NE
Address range: 8900 to 9099
Kessler St
Length: 0.16 miles
Directions: N-S, SW-NE
Address range: 8700 to 8899
Directions: N-S, SW-NE
Address range: 8700 to 8899
Carter St
Length: 0.15 miles
Direction: N-S
Address range: 8700 to 8999
Direction: N-S
Address range: 8700 to 8999
Connell St
Length: 0.14 miles
Directions: E-W, N-S, SE-NW
Address range: 8900 to 9099
Directions: E-W, N-S, SE-NW
Address range: 8900 to 9099
Craig St
Length: 0.14 miles
Direction: N-S
Address range: 8740 to 8899
Direction: N-S
Address range: 8740 to 8899
Santa Fe Ln
Length: 0.12 miles
Directions: N-S, SW-NE
Address range: 8800 to 8899
Directions: N-S, SW-NE
Address range: 8800 to 8899
Grandview St
Length: 0.11 miles
Directions: N-S, SW-NE
Address range: 8768 to 8899
Directions: N-S, SW-NE
Address range: 8768 to 8899
W 88th Pl
Length: 0.06 miles
Direction: E-W
Address range: 9500 to 9599
Direction: E-W
Address range: 9500 to 9599