Fontana Gateway neighborhood in Fontana, California (CA), 92335, 92337 detailed profile
Settings
X


Business Search - 14 Million verified businesses
Area: 1.340 square miles
Population: 1,144
Population density:
| Fontana Gateway: | 854 people per square mile |
| Fontana: | 5,882 people per square mile |

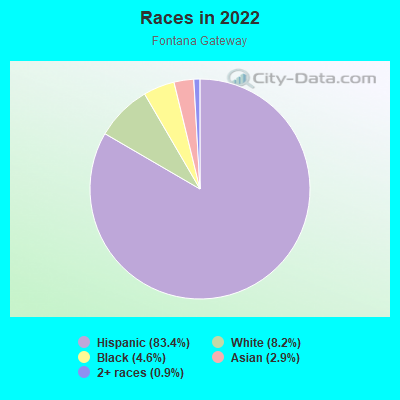
- 95283.4%Hispanic or Latino
- 948.2%White
- 534.6%Black
- 332.9%Asian
- 100.9%Two or more races
Distribution of median household income
![Distribution of median household income]()
- 4Less than $10,000
- 26$10,000 to $19,999
- 13$20,000 to $29,999
- 5$30,000 to $39,999
- 12$40,000 to $49,999
- 13$50,000 to $59,999
- 8$60,000 to $74,999
- 98$75,000 to $99,999
- 46$100,000 to $124,999
- 17$125,000 to $149,999
- 44$150,000 to $199,999
- 13$200,000 or more

Distribution of owner-occupied house/condo value
![Distribution of owner-occupied house/condo value]()
- 4Less than $50,000
- 25$50,000 to $99,999
- 1$100,000 to $149,999
- 11$300,000 to $399,999
- 107$400,000 to $499,999
- 54$500,000 to $749,999
- 9$750,000 to $999,999
- 1$1,000,000 or more

Distribution of rent paid by renters
![Distribution of rent paid by renters]()
- 9$600 to $699
- 1$700 to $799
- 1$800 to $899
- 5$900 to $999
- 6$1,000 to $1,249
- 1$1,250 to $1,499
- 13$1,500 to $1,999
- 44$2,000 or more

Median rent in 2022:
| Fontana Gateway: | $1,073 |
| Fontana: | $1,500 |
| Males: | 478 |
| Females: | 666 |
Males:
| This neighborhood: | 31.4 years |
| Whole city: | 33.0 years |
| This neighborhood: | 24.8 years |
| Whole city: | 34.9 years |
Average household size:
| Fontana Gateway: | 4.2 people |
| Fontana: | 3.7 people |
Percentage of family households:
| Fontana Gateway: | 78.3% |
| Fontana: | 66.1% |
| Here: | 54.5% |
| Fontana: | 61.8% |
Percentage of married-couple families with children (among all households):
| Fontana Gateway: | 10.3% |
| Fontana: | 20.7% |
Percentage of single-mother households (among all households):
| Fontana Gateway: | 7.1% |
| Fontana: | 3.7% |
Percentage of never married males 15 years old and over:
Percentage of never married females 15 years old and over:
| Fontana Gateway: | 18.6% |
| Fontana: | 24.0% |
Percentage of never married females 15 years old and over:
| Fontana Gateway: | 26.7% |
| city: | 17.8% |
Percentage of people that speak English not well or not at all:
| Fontana Gateway: | 15.0% |
| Fontana: | 10.7% |
Percentage of people born in this state:
Percentage of people born in another U.S. state:
Percentage of native residents but born outside the U.S.:
Percentage of foreign born residents:
| Here: | 66.6% |
| Fontana: | 63.9% |
Percentage of people born in another U.S. state:
| Fontana Gateway: | 2.3% |
| Fontana: | 6.1% |
Percentage of native residents but born outside the U.S.:
| Here: | 1.0% |
| city: | 1.0% |
Percentage of foreign born residents:
| Here: | 30.1% |
| Fontana: | 29.1% |
Owner-occupied
Renter-occupied

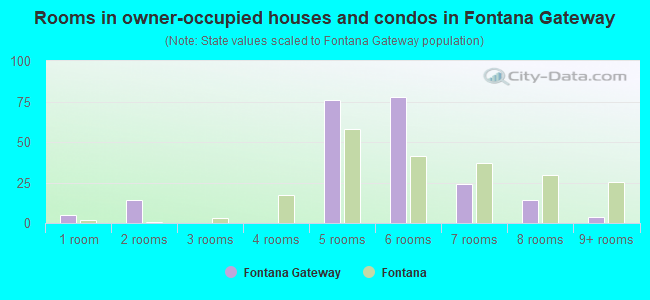
- Rooms in owner-occupied houses and condos in Fontana Gateway
- 51 room
- 142 rooms
- 03 rooms
- 04 rooms
- 765 rooms
- 786 rooms
- 247 rooms
- 148 rooms
- 49+ rooms
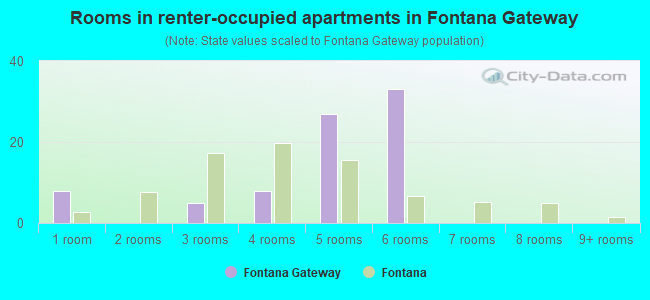
- Rooms in renter-occupied apartments in Fontana Gateway
- 81 room
- 02 rooms
- 53 rooms
- 84 rooms
- 275 rooms
- 336 rooms
- 07 rooms
- 08 rooms
- 09+ rooms
Owner-occupied
Renter-occupied
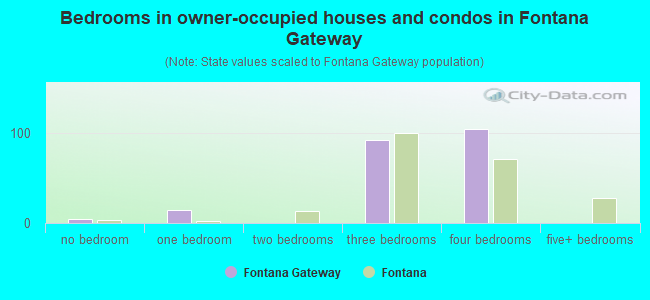
- Bedrooms in owner-occupied houses and condos in Fontana Gateway
- 5no bedroom
- 141 bedroom
- 02 bedrooms
- 933 bedrooms
- 1054 bedrooms
- 05+ bedrooms
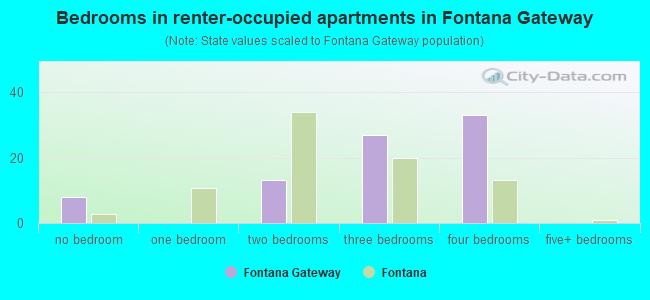
- Bedrooms in renter-occupied apartments in Fontana Gateway
- 8no bedroom
- 01 bedroom
- 132 bedrooms
- 273 bedrooms
- 334 bedrooms
- 05+ bedrooms
Average number of cars or other vehicles available in houses/condos:
Average number of cars or other vehicles available in apartments:
| This neighborhood: | 2.9 |
| Fontana: | 2.7 |
Average number of cars or other vehicles available in apartments:
| Here: | 2.3 |
| city: | 2.1 |
Percentage of units with a mortgage:
| Fontana Gateway: | 68.2% |
| Fontana: | 76.9% |
Housing prices:
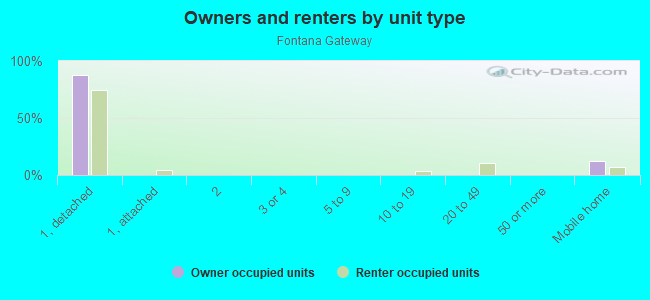
- Average estimated value of detached houses in 2022 (89.3% of all units):
Fontana Gateway: $630 California: $988,808
- Average estimated value of mobile home in 2022 (10.3% of all units):
Fontana Gateway: $293 California: $184,506
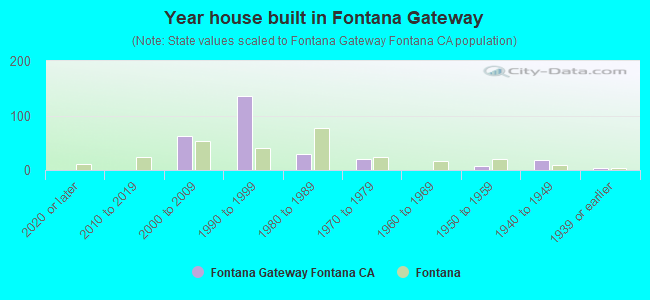
- Year house built in Fontana Gateway
- 02020 or later
- 02010 to 2019
- 632000 to 2009
- 1351990 to 1999
- 291980 to 1989
- 211970 to 1979
- 01960 to 1969
- 81950 to 1959
- 191940 to 1949
- 41939 or earlier
City-data.com crime index for city in 2020 (higher means more crime):
| City: | 162.4 |
| U.S. average: | 219.5 |
Travel time to work (commute)
![Travel time to work (commute)]()
- 345 to 59 minutes

Means of transportation to work
![Means of transportation to work]()
- 68.4%408Drove a car alone
- 15.8%94Carpooled
- 1.0%6Bus
- 0.5%3Bicycle
- 2.5%15Walked
- 1.5%9Other means
- 10.4%62Worked at home

Time leaving home to go to work
![Time leaving home to go to work]()

Occupations of males:
- Percentage of males in management occupations (except farmers):
Here: 5.0% city: 8.4%
- Percentage of males in computer and mathematical occupations:
Here: 5.6% city: 1.8%
- Percentage of males in architecture and engineering occupations:
Here: 1.5% city: 1.8%
- Percentage of males in community and social services occupations:
Here: 5.1% city: 1.0%
- Percentage of males in arts, design, entertainment, sports, and media occupations:
Here: 3.3% city: 1.2%
- Percentage of males in service occupations:
Here: 19.5% city: 12.1%
- Percentage of males in sales and office occupations:
Here: 14.4% city: 14.7%
- Percentage of males in construction, extraction, and maintenance occupations:
Here: 10.1% city: 11.4%
- Percentage of males in production occupations:
Here: 23.8% city: 8.1%
- Percentage of males in transportation occupations:
Here: 1.3% city: 11.3%
- Percentage of males in material moving occupations:
Here: 9.1% city: 14.1%
Occupations of females:
- Percentage of females in management occupations (except farmers):
Here: 5.0% city: 7.4%
- Percentage of females in business and financial operations occupations:
Here: 4.8% city: 5.5%
- Percentage of females in community and social services occupations:
Here: 2.0% city: 3.3%
- Percentage of females in healthcare practitioners and technical occupations:
Here: 7.0% city: 8.8%
- Percentage of females in service occupations:
Here: 34.5% city: 20.7%
- Percentage of females in sales and office occupations:
Here: 16.5% city: 29.9%
- Percentage of females in production occupations:
Here: 7.9% city: 3.4%
- Percentage of females in material moving occupations:
Here: 21.1% city: 9.9%
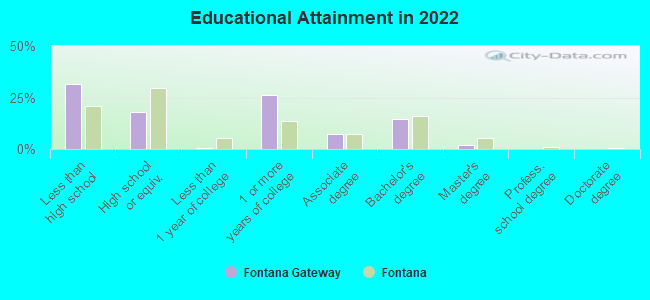
Education in this neighborhood (subdivision or community):
- Percentage of people 3 years and older in K-12 schools:
Fontana Gateway: 13.5% Fontana: 19.9%
- Percentage of people 3 years and older in undergraduate colleges:
Fontana Gateway: 13.5% Fontana: 7.2%
- Percentage of people 3 years and older in grad. or professional schools:
Fontana Gateway: 1.0% Fontana: 1.6%
- Percentage of students K-12 enrolled in private schools:
Fontana Gateway: 2.0% Fontana: 3.5%
Percentage of population below poverty level:
| Fontana Gateway: | 15.1% |
| Fontana: | 8.5% |
Median year owner moved in (as recorded in 2022):
Median year renter moved in (as recorded in 2022):
| Fontana Gateway: | 2008 |
| Fontana: | 2011 |
Median year renter moved in (as recorded in 2022):
| Fontana Gateway: | 2016 |
| Fontana: | 2017 |
Percentage of married-couple families with both working:
| Fontana Gateway: | 49.6% |
| Fontana: | 58.9% |

- 66.7%Utility gas
- 12.3%Electricity
- 12.1%Bottled, tank, or LP gas
- 5.0%No fuel used
- 3.9%Solar energy
Roads and streets:
Mulberry Ave
Length: 1.16 miles
Direction: N-S
Address range: 10350 to 11273
Direction: N-S
Address range: 10350 to 11273
Slover Ave
Length: 1.12 miles
Direction: E-W
Address range: 13000 to 13699
Direction: E-W
Address range: 13000 to 13699
Santa Ana Ave
Length: 0.91 miles
Directions: E-W, SW-NE
Address range: 13054 to 13699
Directions: E-W, SW-NE
Address range: 13054 to 13699
I 10 Fwy E
Length: 0.56 miles
Direction: E-W
Direction: E-W
Business Dr
Length: 0.50 miles
Direction: N-S
Address range: 10500 to 10899
Direction: N-S
Address range: 10500 to 10899
Commerce Way
Length: 0.49 miles
Direction: N-S
Address range: 10500 to 10899
Direction: N-S
Address range: 10500 to 10899
Jasmine St
Length: 0.46 miles
Directions: N-S, SE-NW, SW-NE
Address range: 10600 to 11049
Directions: N-S, SE-NW, SW-NE
Address range: 10600 to 11049
Dahlia St
Length: 0.26 miles
Directions: E-W, SW-NE
Address range: 13050 to 13299
Directions: E-W, SW-NE
Address range: 13050 to 13299
N Etiwanda Ave
Length: 0.20 miles
Direction: N-S
Address range: 10312 to 10456
Direction: N-S
Address range: 10312 to 10456
Jurupa Ave
Length: 0.12 miles
Directions: E-W, SW-NE
Address range: 13108 to 13199
Directions: E-W, SW-NE
Address range: 13108 to 13199
N Loop Dr
Length: 0.11 miles
Directions: E-W, SW-NE
Directions: E-W, SW-NE
I10 Fwy E
Length: 0.07 miles
Direction: E-W
Direction: E-W
Railroad features:
Burlington Northern Santa Fe Rlwy
Length: 1.12 miles
Directions: E-W, N-S, SE-NW, SW-NE
Directions: E-W, N-S, SE-NW, SW-NE
Union Pacific RR (Amtrak RR)
Length: 0.84 miles
Direction: E-W
Direction: E-W
Amtrak RR (Union Pacific RR)
Length: 0.36 miles
Direction: E-W
Direction: E-W
Up RR
Length: 0.22 miles
Directions: E-W, N-S, SE-NW
Directions: E-W, N-S, SE-NW