Convention Center District neighborhood in Austin, Texas (TX), 78701, 78702 detailed profile
Settings
X


Business Search - 14 Million verified businesses
Area: 0.117 square miles
Population: 638
Population density:
| Convention Center District: | 5,469 people per square mile |
| Austin: | 3,878 people per square mile |

- 46572.9%White
- 6810.7%Asian
- 568.8%Black
- 426.6%Hispanic or Latino
- 71.1%Two or more races

Distribution of median household income
![Distribution of median household income]()
- 36Less than $10,000
- 76$10,000 to $19,999
- 25$20,000 to $29,999
- 65$30,000 to $39,999
- 65$40,000 to $49,999
- 28$50,000 to $59,999
- 55$60,000 to $74,999
- 64$75,000 to $99,999
- 33$100,000 to $124,999
- 59$125,000 to $149,999
- 36$150,000 to $199,999
- 93$200,000 or more

Distribution of owner-occupied house/condo value
![Distribution of owner-occupied house/condo value]()
- 16Less than $50,000
- 17$50,000 to $99,999
- 13$150,000 to $199,999
- 2$200,000 to $249,999
- 4$250,000 to $299,999
- 18$300,000 to $399,999
- 24$400,000 to $499,999
- 10$500,000 to $749,999
- 6$750,000 to $999,999
- 49$1,000,000 or more

Distribution of rent paid by renters
![Distribution of rent paid by renters]()
- 4$100 to $199
- 27$200 to $299
- 34$300 to $399
- 11$400 to $499
- 35$600 to $699
- 11$700 to $799
- 15$800 to $899
- 18$900 to $999
- 40$1,000 to $1,249
- 6$1,250 to $1,499
- 144$1,500 to $1,999
- 228$2,000 or more

Median rent in 2022:
| Convention Center District: | $1,916 |
| Austin: | $1,437 |
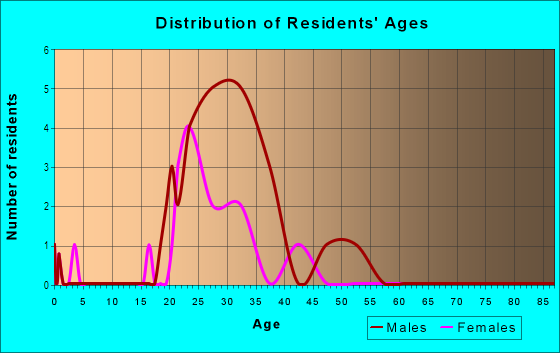
| Males: | 376 |
| Females: | 261 |
Males:
| This neighborhood: | 33.9 years |
| Whole city: | 34.5 years |
| This neighborhood: | 35.6 years |
| Whole city: | 34.4 years |
Average household size:
| Convention Center District: | 1.8 people |
| Austin: | 28.0 people |
Percentage of family households:
| Convention Center District: | 9.4% |
| Austin: | 36.6% |
| Here: | 10.0% |
| Austin: | 35.3% |
Percentage of married-couple families with children (among all households):
| Convention Center District: | 77.6% |
| Austin: | 36.3% |
Percentage of single-mother households (among all households):
| Convention Center District: | 71.2% |
| Austin: | 7.9% |
Percentage of never married males 15 years old and over:
Percentage of never married females 15 years old and over:
| Convention Center District: | 46.2% |
| Austin: | 25.0% |
Percentage of never married females 15 years old and over:
| Convention Center District: | 23.9% |
| city: | 19.9% |
Percentage of people that speak English not well or not at all:
| Convention Center District: | 0.0% |
| Austin: | 5.2% |
Percentage of people born in this state:
Percentage of people born in another U.S. state:
Percentage of native residents but born outside the U.S.:
Percentage of foreign born residents:
| Here: | 55.1% |
| Austin: | 48.2% |
Percentage of people born in another U.S. state:
| Convention Center District: | 33.2% |
| Austin: | 31.8% |
Percentage of native residents but born outside the U.S.:
| Here: | 0.5% |
| city: | 2.3% |
Percentage of foreign born residents:
| Here: | 11.1% |
| Austin: | 17.8% |

Owner-occupied
Renter-occupied


- Rooms in owner-occupied houses and condos in Convention Center District
- 71 room
- 242 rooms
- 153 rooms
- 294 rooms
- 925 rooms
- 596 rooms
- 247 rooms
- 48 rooms
- 639+ rooms

- Rooms in renter-occupied apartments in Convention Center District
- 311 room
- 2202 rooms
- 1313 rooms
- 364 rooms
- 245 rooms
- 136 rooms
- 77 rooms
- 228 rooms
- 39+ rooms
Owner-occupied
Renter-occupied

- Bedrooms in owner-occupied houses and condos in Convention Center District
- 7no bedroom
- 151 bedroom
- 62 bedrooms
- 213 bedrooms
- 64 bedrooms
- 115+ bedrooms

- Bedrooms in renter-occupied apartments in Convention Center District
- 31no bedroom
- 3461 bedroom
- 662 bedrooms
- 73 bedrooms
- 44 bedrooms
- 05+ bedrooms
Average number of cars or other vehicles available in houses/condos:
Average number of cars or other vehicles available in apartments:
| This neighborhood: | 1.8 |
| Austin: | 1.9 |
Average number of cars or other vehicles available in apartments:
| Here: | 0.7 |
| city: | 1.3 |
Percentage of units with a mortgage:
| Convention Center District: | 48.2% |
| Austin: | 68.5% |

- Year house built in Convention Center District
- 132020 or later
- 4482010 to 2019
- 812000 to 2009
- 301990 to 1999
- 221980 to 1989
- 81970 to 1979
- 101960 to 1969
- 241950 to 1959
- 81940 to 1949
- 421939 or earlier

City-data.com crime index for city in 2020 (higher means more crime):
| City: | 316.8 |
| U.S. average: | 219.5 |
Travel time to work (commute)
![Travel time to work (commute)]()
- 24Less than 5 minutes
- 865 to 9 minutes
- 10710 to 14 minutes
- 12415 to 19 minutes
- 7020 to 24 minutes
- 3225 to 29 minutes
- 5430 to 34 minutes
- 1035 to 39 minutes
- 3140 to 44 minutes
- 1845 to 59 minutes
- 260 to 89 minutes

Means of transportation to work
![Means of transportation to work]()
- 45.5%231Drove a car alone
- 2.8%14Carpooled
- 7.1%36Bus
- 3.2%16Taxi
- 3.5%18Motorcycle
- 6.9%35Bicycle
- 8.3%42Walked
- 7.1%36Other means
- 25.2%128Worked at home

Time leaving home to go to work
![Time leaving home to go to work]()
- 35:00 a.m. to 5:29 a.m.
- 25:30 a.m. to 5:59 a.m.
- 56:00 a.m. to 6:29 a.m.
- 56:30 a.m. to 6:59 a.m.
- 727:00 a.m. to 7:29 a.m.
- 877:30 a.m. to 7:59 a.m.
- 1108:00 a.m. to 8:29 a.m.
- 768:30 a.m. to 8:59 a.m.
- 879:00 a.m. to 9:59 a.m.
- 1410:00 a.m. to 10:59 a.m.
- 2311:00 a.m. to 11:59 a.m.
- 5112:00 p.m. to 3:59 p.m.
- 274:00 p.m. to 11:59 p.m.

Occupations of males:
- Percentage of males in management occupations (except farmers):
Here: 14.5% city: 15.3%
- Percentage of males in business and financial operations occupations:
Here: 11.8% city: 7.0%
- Percentage of males in computer and mathematical occupations:
Here: 29.6% city: 12.0%
- Percentage of males in community and social services occupations:
Here: 4.1% city: 1.0%
- Percentage of males in education, training, and library occupations:
Here: 9.0% city: 4.1%
- Percentage of males in arts, design, entertainment, sports, and media occupations:
Here: 10.4% city: 4.1%
- Percentage of males in healthcare practitioners and technical occupations:
Here: 11.2% city: 2.3%
- Percentage of males in service occupations:
Here: 12.7% city: 11.2%
- Percentage of males in sales and office occupations:
Here: 2.5% city: 14.9%
- Percentage of males in production occupations:
Here: 2.8% city: 3.4%
- Percentage of males in transportation occupations:
Here: 7.5% city: 3.7%
- Percentage of males in material moving occupations:
Here: 1.7% city: 2.8%
Occupations of females:
- Percentage of females in management occupations (except farmers):
Here: 14.3% city: 13.5%
- Percentage of females in business and financial operations occupations:
Here: 19.2% city: 11.0%
- Percentage of females in computer and mathematical occupations:
Here: 4.5% city: 4.0%
- Percentage of females in architecture and engineering occupations:
Here: 1.1% city: 1.6%
- Percentage of females in community and social services occupations:
Here: 3.1% city: 2.2%
- Percentage of females in legal occupations:
Here: 16.3% city: 2.4%
- Percentage of females in education, training, and library occupations:
Here: 4.1% city: 9.0%
- Percentage of females in arts, design, entertainment, sports, and media occupations:
Here: 20.0% city: 4.5%
- Percentage of females in service occupations:
Here: 3.0% city: 15.8%
- Percentage of females in sales and office occupations:
Here: 17.4% city: 22.9%
Education in this neighborhood (subdivision or community):
- Percentage of people 3 years and older in K-12 schools:
Convention Center District: 14.3% Austin: 12.4%
- Percentage of people 3 years and older in undergraduate colleges:
Convention Center District: 2.7% Austin: 6.1%
- Percentage of people 3 years and older in grad. or professional schools:
Convention Center District: 3.1% Austin: 2.5%
- Percentage of students K-12 enrolled in private schools:
Convention Center District: 35.2% Austin: 11.8%
Percentage of population below poverty level:
| Convention Center District: | 17.7% |
| Austin: | 11.1% |
Median year owner moved in (as recorded in 2022):
Median year renter moved in (as recorded in 2022):
| Convention Center District: | 2009 |
| Austin: | 2013 |
Median year renter moved in (as recorded in 2022):
| Convention Center District: | 2016 |
| Austin: | 2021 |
Percentage of married-couple families with both working:
| Convention Center District: | 426.1% |
| Austin: | 68.5% |

- 60.3%Electricity
- 30.8%Utility gas
- 4.2%Fuel oil, kerosene, etc.
- 1.3%Solar energy
- 1.3%Other fuel
- 1.0%Bottled, tank, or LP gas
- 1.0%No fuel used
Limited-access highways (interstate or state) in this neighborhood:
US Hwy 290 (I- 35)
Length: 0.44 miles
Directions: N-S, SW-NE
Directions: N-S, SW-NE
Highways in this neighborhood:
State Spur 343 (E Cesar Chavez St, E 1st St)
Length: 0.20 miles
Direction: E-W
Address range: 510 to 799
Direction: E-W
Address range: 510 to 799
Roads and streets:
E 4th St
Length: 0.38 miles
Direction: E-W
Address range: 300 to 799
Direction: E-W
Address range: 300 to 799
I- 35 Svc Rd N (N I- 35 Svc Rd)
Length: 0.24 miles
Direction: N-S
Address range: 100 to 436
Direction: N-S
Address range: 100 to 436
E 3rd St
Length: 0.23 miles
Direction: E-W
Address range: 300 to 799
Direction: E-W
Address range: 300 to 799
Red River St
Length: 0.21 miles
Direction: N-S
Address range: 100 to 399
Direction: N-S
Address range: 100 to 399
Trinity St
Length: 0.14 miles
Direction: N-S
Address range: 200 to 399
Direction: N-S
Address range: 200 to 399
San Jacinto Blvd
Length: 0.14 miles
Direction: N-S
Address range: 200 to 399
Direction: N-S
Address range: 200 to 399
E 2nd St
Length: 0.08 miles
Direction: E-W
Address range: 300 to 399
Direction: E-W
Address range: 300 to 399
E Cesar Chavez St
Length: 0.02 miles
Direction: E-W
Direction: E-W
Railroad features:
Missouri Pacific RR
Length: 0.27 miles
Direction: E-W
Direction: E-W
Other features:
Waller Crk
Length: 0.27 miles
Directions: E-W, N-S, SW-NE
Directions: E-W, N-S, SW-NE