Burnt Mills Manor neighborhood in Silver Spring, Maryland (MD), 20901 detailed profile
Settings
X


Business Search - 14 Million verified businesses
Area: 0.190 square miles
Population: 1,515
Population density:
| Burnt Mills Manor: | 7,977 people per square mile |
| Silver Spring: | 7,993 people per square mile |

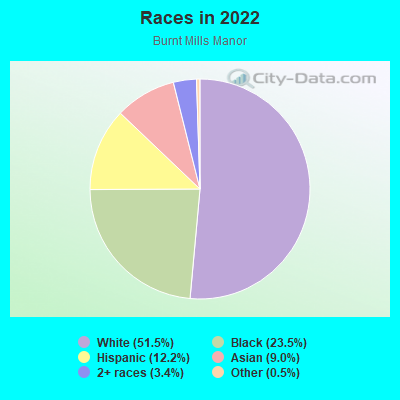
- 79151.5%White
- 36123.5%Black
- 18712.2%Hispanic or Latino
- 1389.0%Asian
- 523.4%Two or more races
- 80.5%Some other race
Median household income in 2022:
| Burnt Mills Manor: | $169,046 |
| Silver Spring: | $81,557 |
Distribution of median household income
![Distribution of median household income]()
- 8Less than $10,000
- 52$10,000 to $19,999
- 25$20,000 to $29,999
- 169$30,000 to $39,999
- 22$40,000 to $49,999
- 42$50,000 to $59,999
- 12$60,000 to $74,999
- 25$75,000 to $99,999
- 79$100,000 to $124,999
- 21$125,000 to $149,999
- 78$150,000 to $199,999
- 206$200,000 or more

Distribution of owner-occupied house/condo value
![Distribution of owner-occupied house/condo value]()
- 29Less than $50,000
- 6$50,000 to $99,999
- 28$100,000 to $149,999
- 14$150,000 to $199,999
- 3$250,000 to $299,999
- 52$300,000 to $399,999
- 132$400,000 to $499,999
- 260$500,000 to $749,999
- 20$750,000 to $999,999
- 20$1,000,000 or more

Distribution of rent paid by renters
![Distribution of rent paid by renters]()
- 1$200 to $299
- 95$700 to $799
- 15$1,000 to $1,249
- 357$1,250 to $1,499
- 12$1,500 to $1,999
- 40$2,000 or more

Median rent in 2022:
| Burnt Mills Manor: | $2,379 |
| Silver Spring: | $1,620 |
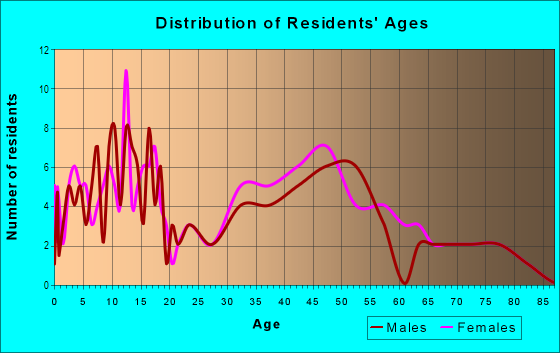
| Males: | 784 |
| Females: | 730 |
Males:
| This neighborhood: | 36.2 years |
| Whole city: | 36.7 years |
| This neighborhood: | 39.0 years |
| Whole city: | 36.5 years |
Average household size:
| Burnt Mills Manor: | 7.6 people |
| Silver Spring: | 2.2 people |
Percentage of family households:
| Burnt Mills Manor: | 48.3% |
| Silver Spring: | 38.8% |
| Here: | 60.5% |
| Silver Spring: | 32.5% |
Percentage of married-couple families with children (among all households):
| Burnt Mills Manor: | 29.1% |
| Silver Spring: | 34.5% |
Percentage of single-mother households (among all households):
| Burnt Mills Manor: | 4.3% |
| Silver Spring: | 6.6% |
Percentage of never married males 15 years old and over:
Percentage of never married females 15 years old and over:
| Burnt Mills Manor: | 18.0% |
| Silver Spring: | 22.2% |
Percentage of never married females 15 years old and over:
| Burnt Mills Manor: | 14.0% |
| place: | 24.3% |
Percentage of people that speak English not well or not at all:
| Burnt Mills Manor: | 5.8% |
| Silver Spring: | 9.9% |
Percentage of people born in this state:
Percentage of people born in another U.S. state:
Percentage of native residents but born outside the U.S.:
Percentage of foreign born residents:
| Here: | 22.2% |
| Silver Spring: | 19.7% |
Percentage of people born in another U.S. state:
| Burnt Mills Manor: | 43.4% |
| Silver Spring: | 45.9% |
Percentage of native residents but born outside the U.S.:
| Here: | 3.2% |
| place: | 2.4% |
Percentage of foreign born residents:
| Here: | 31.2% |
| Silver Spring: | 32.0% |
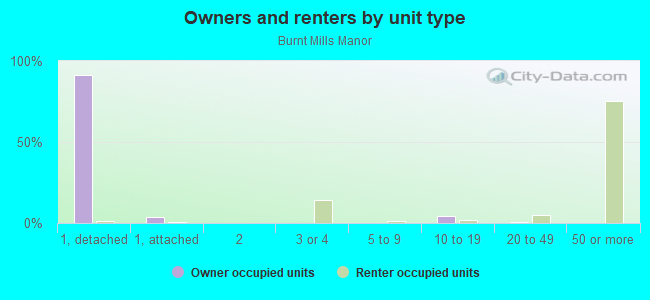
Owner-occupied
Renter-occupied

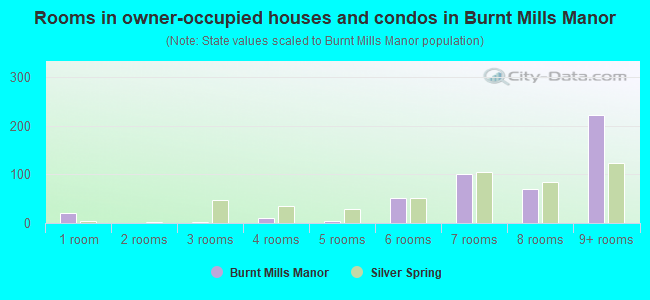
- Rooms in owner-occupied houses and condos in Burnt Mills Manor
- 211 room
- 02 rooms
- 33 rooms
- 114 rooms
- 55 rooms
- 516 rooms
- 1007 rooms
- 708 rooms
- 2229+ rooms
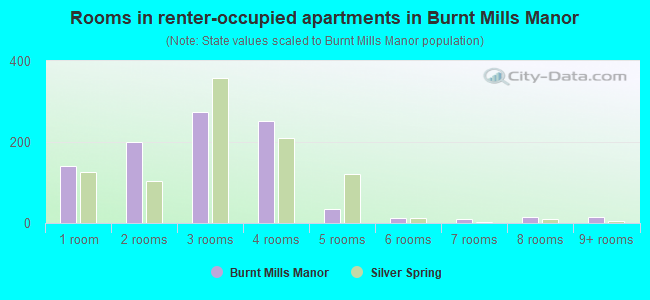
- Rooms in renter-occupied apartments in Burnt Mills Manor
- 1401 room
- 1992 rooms
- 2743 rooms
- 2524 rooms
- 345 rooms
- 126 rooms
- 117 rooms
- 148 rooms
- 159+ rooms
Owner-occupied
Renter-occupied
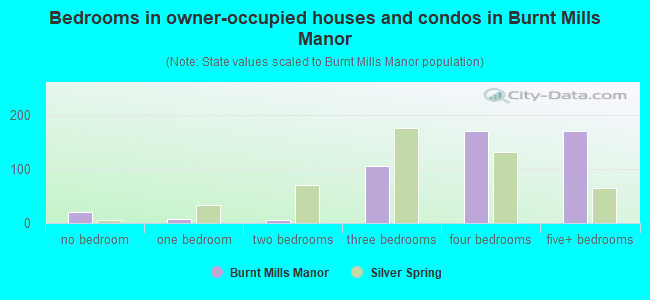
- Bedrooms in owner-occupied houses and condos in Burnt Mills Manor
- 21no bedroom
- 81 bedroom
- 52 bedrooms
- 1053 bedrooms
- 1704 bedrooms
- 1715+ bedrooms
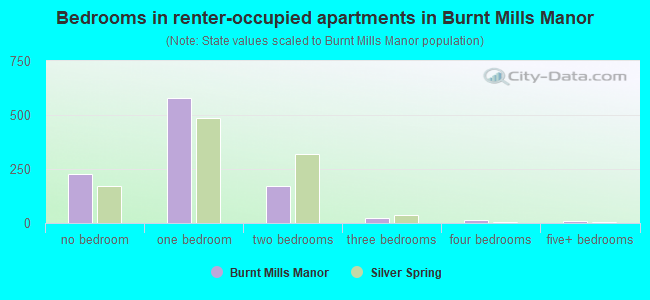
- Bedrooms in renter-occupied apartments in Burnt Mills Manor
- 226no bedroom
- 5791 bedroom
- 1692 bedrooms
- 243 bedrooms
- 144 bedrooms
- 95+ bedrooms
Average number of cars or other vehicles available in houses/condos:
Average number of cars or other vehicles available in apartments:
| This neighborhood: | |
| Silver Spring: |
Average number of cars or other vehicles available in apartments:
| Here: | 1.7 |
| place: | 0.9 |
Percentage of units with a mortgage:
| Burnt Mills Manor: | 73.1% |
| Silver Spring: | 76.3% |
Average estimated value of detached houses in 2022 (92.5% of all units):
| Burnt Mills Manor: | $619,353 |
| Maryland: | $526,819 |
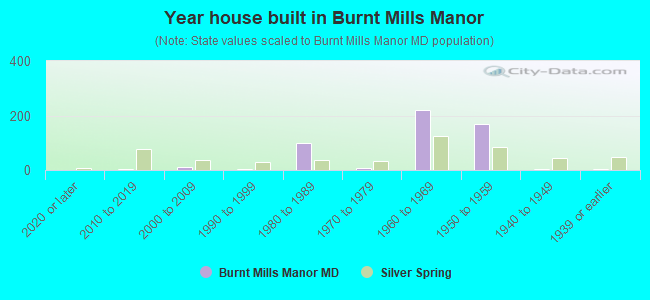
- Year house built in Burnt Mills Manor
- 12020 or later
- 52010 to 2019
- 102000 to 2009
- 21990 to 1999
- 991980 to 1989
- 91970 to 1979
- 2191960 to 1969
- 1681950 to 1959
- 51940 to 1949
- 51939 or earlier
Travel time to work (commute)
![Travel time to work (commute)]()
- 2Less than 5 minutes
- 115 to 9 minutes
- 1810 to 14 minutes
- 2315 to 19 minutes
- 2520 to 24 minutes
- 2325 to 29 minutes
- 6130 to 34 minutes
- 1235 to 39 minutes
- 2540 to 44 minutes
- 10345 to 59 minutes
- 5060 to 89 minutes
- 990 or more minutes

Means of transportation to work
![Means of transportation to work]()
- 57.2%481Drove a car alone
- 8.6%72Carpooled
- 2.7%23Bus
- 5.1%43Subway or elevated rail
- 0.1%1Long-distance train or commuter rail
- 0.6%5Bicycle
- 0.1%1Walked
- 1.5%13Other means
- 25.5%214Worked at home

Time leaving home to go to work
![Time leaving home to go to work]()
- 312:00 a.m. to 4:59 a.m.
- 195:00 a.m. to 5:29 a.m.
- 385:30 a.m. to 5:59 a.m.
- 356:00 a.m. to 6:29 a.m.
- 146:30 a.m. to 6:59 a.m.
- 627:00 a.m. to 7:29 a.m.
- 267:30 a.m. to 7:59 a.m.
- 538:00 a.m. to 8:29 a.m.
- 388:30 a.m. to 8:59 a.m.
- 259:00 a.m. to 9:59 a.m.
- 1210:00 a.m. to 10:59 a.m.
- 611:00 a.m. to 11:59 a.m.
- 1312:00 p.m. to 3:59 p.m.
- 144:00 p.m. to 11:59 p.m.

Occupations of males:
- Percentage of males in management occupations (except farmers):
Here: 19.4% place: 11.4%
- Percentage of males in business and financial operations occupations:
Here: 3.4% place: 6.8%
- Percentage of males in computer and mathematical occupations:
Here: 9.8% place: 9.4%
- Percentage of males in architecture and engineering occupations:
Here: 5.1% place: 4.5%
- Percentage of males in life, physical, and social science occupations:
Here: 4.6% place: 5.3%
- Percentage of males in legal occupations:
Here: 1.6% place: 3.6%
- Percentage of males in arts, design, entertainment, sports, and media occupations:
Here: 2.4% place: 3.9%
- Percentage of males in service occupations:
Here: 4.5% place: 10.9%
- Percentage of males in sales and office occupations:
Here: 32.6% place: 9.6%
- Percentage of males in construction, extraction, and maintenance occupations:
Here: 5.7% place: 11.6%
- Percentage of males in transportation occupations:
Here: 2.7% place: 6.4%
- Percentage of males in material moving occupations:
Here: 4.9% place: 2.2%
Occupations of females:
- Percentage of females in management occupations (except farmers):
Here: 18.2% place: 13.0%
- Percentage of females in business and financial operations occupations:
Here: 11.5% place: 8.9%
- Percentage of females in computer and mathematical occupations:
Here: 1.7% place: 5.0%
- Percentage of females in architecture and engineering occupations:
Here: 1.1% place: 1.3%
- Percentage of females in community and social services occupations:
Here: 2.6% place: 2.9%
- Percentage of females in legal occupations:
Here: 1.7% place: 4.2%
- Percentage of females in education, training, and library occupations:
Here: 15.2% place: 11.2%
- Percentage of females in arts, design, entertainment, sports, and media occupations:
Here: 2.2% place: 4.5%
- Percentage of females in healthcare practitioners and technical occupations:
Here: 5.1% place: 5.3%
- Percentage of females in service occupations:
Here: 24.1% place: 20.4%
- Percentage of females in sales and office occupations:
Here: 16.7% place: 16.7%
- Percentage of females in production occupations:
Here: 1.0% place: 0.9%
- Percentage of females in transportation occupations:
Here: 2.5% place: 0.6%
- Percentage of females in material moving occupations:
Here: 7.6% place: 1.3%
Percentage of people 16-64 in Armed Forces:
| Burnt Mills Manor: | 0.0% |
| Silver Spring: | 0.4% |
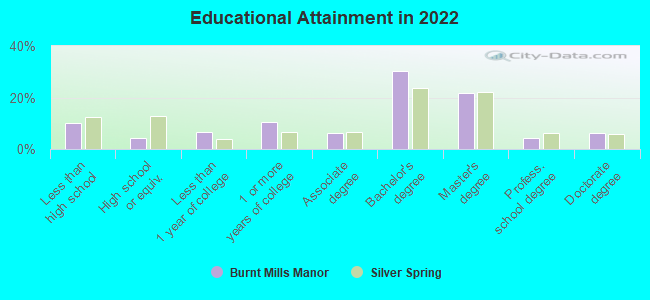
Education in this neighborhood (subdivision or community):
- Percentage of people 3 years and older in K-12 schools:
Burnt Mills Manor: 9.0% Silver Spring: 14.1%
- Percentage of people 3 years and older in undergraduate colleges:
Burnt Mills Manor: 8.4% Silver Spring: 3.4%
- Percentage of people 3 years and older in grad. or professional schools:
Burnt Mills Manor: 5.3% Silver Spring: 2.0%
- Percentage of students K-12 enrolled in private schools:
Burnt Mills Manor: 70.1% Silver Spring: 12.6%
Percentage of population below poverty level:
| Burnt Mills Manor: | 3.7% |
| Silver Spring: | 11.0% |
Median year renter moved in (as recorded in 2022):
| Burnt Mills Manor: | 2017 |
| Silver Spring: | 2020 |
Percentage of married-couple families with both working:
| Burnt Mills Manor: | 81.1% |
| Silver Spring: | 80.2% |
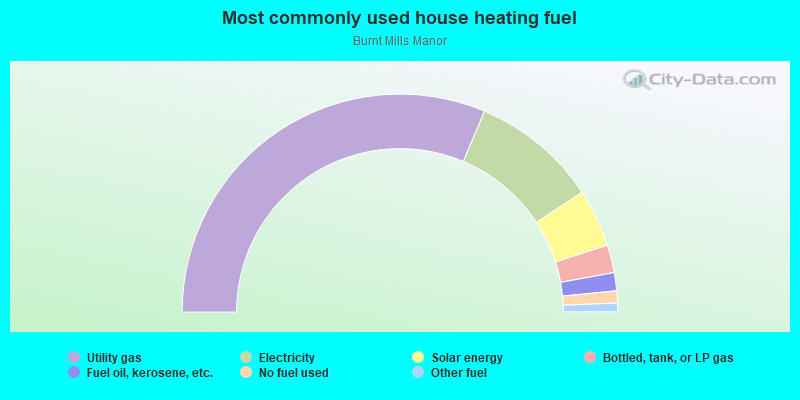
- 62.7%Utility gas
- 18.8%Electricity
- 8.6%Solar energy
- 4.1%Bottled, tank, or LP gas
- 2.7%Fuel oil, kerosene, etc.
- 1.8%No fuel used
- 1.3%Other fuel
Highways in this neighborhood:
US Hwy 29 (Columbia Pike)
Length: 0.59 miles
Direction: SW-NE
Address range: 10700 to 10999
Direction: SW-NE
Address range: 10700 to 10999
Roads and streets:
Childs St
Length: 0.55 miles
Directions: E-W, N-S, SE-NW, SW-NE
Address range: 10800 to 11099
Directions: E-W, N-S, SE-NW, SW-NE
Address range: 10800 to 11099
Burnt Mills Ave
Length: 0.45 miles
Directions: E-W, SW-NE
Address range: 200 to 499
Directions: E-W, SW-NE
Address range: 200 to 499
Wheeler Dr
Length: 0.40 miles
Directions: E-W, SE-NW, SW-NE
Address range: 10800 to 11099
Directions: E-W, SE-NW, SW-NE
Address range: 10800 to 11099
Oakwood St
Length: 0.24 miles
Direction: SE-NW
Address range: 10900 to 11008
Direction: SE-NW
Address range: 10900 to 11008
Neale Ave
Length: 0.15 miles
Direction: SE-NW
Address range: 400 to 499
Direction: SE-NW
Address range: 400 to 499
Neale Ct
Length: 0.06 miles
Directions: E-W, SW-NE
Address range: 400 to 499
Directions: E-W, SW-NE
Address range: 400 to 499
Childs Ct
Length: 0.04 miles
Direction: N-S
Address range: 200 to 10826
Direction: N-S
Address range: 200 to 10826
Other features:
Northwest Br
Length: 0.25 miles
Directions: N-S, SE-NW, SW-NE
Directions: N-S, SE-NW, SW-NE