Bonnett neighborhood in Campbell, California (CA), 95008, 95124 detailed profile
Settings
X


Business Search - 14 Million verified businesses
Area: 0.075 square miles
Population: 482
Population density:
| Bonnett: | 6,427 people per square mile |
| Campbell: | 7,753 people per square mile |

- 26353.2%White
- 8216.6%Asian
- 7715.6%Hispanic or Latino
- 357.1%Black
- 234.7%Two or more races
- 91.8%American Indian
- 30.6%Native Hawaiian and Other
Pacific Islander - 20.4%Some other race

Median household income in 2022:
| Bonnett: | $102,003 |
| Campbell: | $141,794 |
Distribution of median household income
![Distribution of median household income]()
- 4Less than $10,000
- 39$10,000 to $19,999
- 17$20,000 to $29,999
- 11$30,000 to $39,999
- 12$40,000 to $49,999
- 4$50,000 to $59,999
- 7$60,000 to $74,999
- 12$75,000 to $99,999
- 13$100,000 to $124,999
- 11$125,000 to $149,999
- 25$150,000 to $199,999
- 62$200,000 or more

Distribution of owner-occupied house/condo value
![Distribution of owner-occupied house/condo value]()
- 3$50,000 to $99,999
- 3$300,000 to $399,999
- 2$500,000 to $749,999
- 5$750,000 to $999,999
- 115$1,000,000 or more

Distribution of rent paid by renters
![Distribution of rent paid by renters]()
- 12$300 to $399
- 4$700 to $799
- 2$900 to $999
- 20$1,000 to $1,249
- 25$1,250 to $1,499
- 31$1,500 to $1,999
- 189$2,000 or more

Median rent in 2022:
| Bonnett: | $1,356 |
| Campbell: | $2,001 |
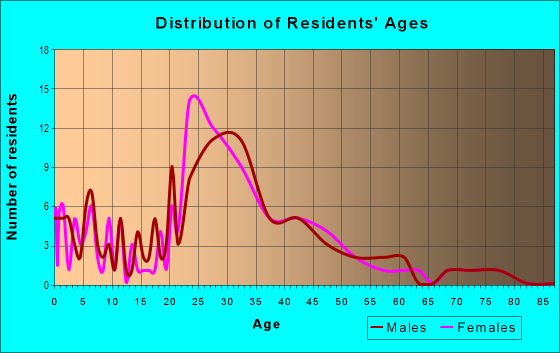
| Males: | 227 |
| Females: | 254 |
Males:
| This neighborhood: | 44.0 years |
| Whole city: | 38.6 years |
| This neighborhood: | 44.3 years |
| Whole city: | 40.0 years |
Average household size:
| Bonnett: | 2.4 people |
| Campbell: | 2.5 people |
Percentage of family households:
| Bonnett: | 53.2% |
| Campbell: | 50.9% |
| Here: | 50.9% |
| Campbell: | 50.4% |
Percentage of married-couple families with children (among all households):
| Bonnett: | 33.5% |
| Campbell: | 31.4% |
Percentage of single-mother households (among all households):
| Bonnett: | 6.0% |
| Campbell: | 5.4% |
Percentage of never married males 15 years old and over:
Percentage of never married females 15 years old and over:
| Bonnett: | 12.5% |
| Campbell: | 16.6% |
Percentage of never married females 15 years old and over:
| Bonnett: | 10.2% |
| city: | 15.8% |
Percentage of people that speak English not well or not at all:
| Bonnett: | 5.2% |
| Campbell: | 5.3% |
Percentage of people born in this state:
Percentage of people born in another U.S. state:
Percentage of native residents but born outside the U.S.:
Percentage of foreign born residents:
| Here: | 57.3% |
| Campbell: | 51.3% |
Percentage of people born in another U.S. state:
| Bonnett: | 18.9% |
| Campbell: | 16.6% |
Percentage of native residents but born outside the U.S.:
| Here: | 0.8% |
| city: | 1.1% |
Percentage of foreign born residents:
| Here: | 23.0% |
| Campbell: | 31.1% |

Owner-occupied
Renter-occupied


- Rooms in owner-occupied houses and condos in Bonnett
- 11 room
- 02 rooms
- 93 rooms
- 44 rooms
- 215 rooms
- 126 rooms
- 287 rooms
- 338 rooms
- 259+ rooms

- Rooms in renter-occupied apartments in Bonnett
- 91 room
- 122 rooms
- 243 rooms
- 124 rooms
- 175 rooms
- 26 rooms
- 27 rooms
- 08 rooms
- 49+ rooms
Owner-occupied
Renter-occupied

- Bedrooms in owner-occupied houses and condos in Bonnett
- 1no bedroom
- 01 bedroom
- 62 bedrooms
- 603 bedrooms
- 524 bedrooms
- 55+ bedrooms

- Bedrooms in renter-occupied apartments in Bonnett
- 9no bedroom
- 351 bedroom
- 162 bedrooms
- 173 bedrooms
- 34 bedrooms
- 45+ bedrooms
Average number of cars or other vehicles available in houses/condos:
Average number of cars or other vehicles available in apartments:
| This neighborhood: | 2.3 |
| Campbell: | 2.2 |
Average number of cars or other vehicles available in apartments:
| Here: | 1.2 |
| city: | 1.6 |
Percentage of units with a mortgage:
| Bonnett: | 67.6% |
| Campbell: | 68.8% |
Housing prices:
- Average estimated value of detached houses in 2022 (53.0% of all units):
Bonnett: $1,728,810 Campbell: $1,768,898
- Average estimated value of townhouses or other attached units in 2022 (11.1% of all units):
This neighborhood: $837,228 city: $1,144,684

- Year house built in Bonnett
- 02020 or later
- 32010 to 2019
- 342000 to 2009
- 441990 to 1999
- 191980 to 1989
- 101970 to 1979
- 491960 to 1969
- 501950 to 1959
- 91940 to 1949
- 11939 or earlier

City-data.com crime index for city in 2020 (higher means more crime):
| City: | 246.0 |
| U.S. average: | 219.5 |
Travel time to work (commute)
![Travel time to work (commute)]()
- 5Less than 5 minutes
- 325 to 9 minutes
- 4910 to 14 minutes
- 9015 to 19 minutes
- 5520 to 24 minutes
- 2125 to 29 minutes
- 7230 to 34 minutes
- 1035 to 39 minutes
- 1240 to 44 minutes
- 1845 to 59 minutes
- 2260 to 89 minutes
- 990 or more minutes

Means of transportation to work
![Means of transportation to work]()
- 66.3%163Drove a car alone
- 6.9%17Carpooled
- 2.4%6Bus
- 1.2%3Long-distance train or commuter rail
- 1.6%4Motorcycle
- 1.6%4Bicycle
- 3.3%8Walked
- 2.8%7Other means
- 17.1%42Worked at home

Time leaving home to go to work
![Time leaving home to go to work]()
- 1612:00 a.m. to 4:59 a.m.
- 75:00 a.m. to 5:29 a.m.
- 95:30 a.m. to 5:59 a.m.
- 76:00 a.m. to 6:29 a.m.
- 176:30 a.m. to 6:59 a.m.
- 417:00 a.m. to 7:29 a.m.
- 447:30 a.m. to 7:59 a.m.
- 828:00 a.m. to 8:29 a.m.
- 448:30 a.m. to 8:59 a.m.
- 569:00 a.m. to 9:59 a.m.
- 2810:00 a.m. to 10:59 a.m.
- 611:00 a.m. to 11:59 a.m.
- 3512:00 p.m. to 3:59 p.m.
- 264:00 p.m. to 11:59 p.m.

Occupations of males:
- Percentage of males in management occupations (except farmers):
Here: 15.0% city: 17.3%
- Percentage of males in business and financial operations occupations:
Here: 7.9% city: 6.0%
- Percentage of males in computer and mathematical occupations:
Here: 18.7% city: 13.7%
- Percentage of males in architecture and engineering occupations:
Here: 8.4% city: 10.9%
- Percentage of males in life, physical, and social science occupations:
Here: 7.2% city: 1.5%
- Percentage of males in community and social services occupations:
Here: 1.4% city: 0.7%
- Percentage of males in legal occupations:
Here: 3.9% city: 0.6%
- Percentage of males in education, training, and library occupations:
Here: 5.1% city: 2.6%
- Percentage of males in arts, design, entertainment, sports, and media occupations:
Here: 2.7% city: 3.7%
- Percentage of males in service occupations:
Here: 8.9% city: 9.6%
- Percentage of males in sales and office occupations:
Here: 14.6% city: 13.2%
- Percentage of males in construction, extraction, and maintenance occupations:
Here: 12.2% city: 7.7%
- Percentage of males in production occupations:
Here: 5.1% city: 3.0%
- Percentage of males in material moving occupations:
Here: 3.9% city: 3.4%
Occupations of females:
- Percentage of females in management occupations (except farmers):
Here: 2.0% city: 15.9%
- Percentage of females in business and financial operations occupations:
Here: 14.0% city: 9.1%
- Percentage of females in computer and mathematical occupations:
Here: 2.0% city: 5.9%
- Percentage of females in architecture and engineering occupations:
Here: 1.5% city: 3.7%
- Percentage of females in life, physical, and social science occupations:
Here: 1.5% city: 1.8%
- Percentage of females in community and social services occupations:
Here: 2.4% city: 4.1%
- Percentage of females in legal occupations:
Here: 1.3% city: 2.1%
- Percentage of females in education, training, and library occupations:
Here: 12.2% city: 9.6%
- Percentage of females in arts, design, entertainment, sports, and media occupations:
Here: 6.6% city: 2.6%
- Percentage of females in healthcare practitioners and technical occupations:
Here: 12.7% city: 5.7%
- Percentage of females in service occupations:
Here: 2.8% city: 13.1%
- Percentage of females in sales and office occupations:
Here: 40.0% city: 24.6%
- Percentage of females in production occupations:
Here: 1.5% city: 0.6%
- Percentage of females in transportation occupations:
Here: 3.3% city: 0.8%
Education in this neighborhood (subdivision or community):
- Percentage of people 3 years and older in K-12 schools:
Bonnett: 22.9% Campbell: 16.1%
- Percentage of people 3 years and older in undergraduate colleges:
Bonnett: 8.7% Campbell: 4.5%
- Percentage of people 3 years and older in grad. or professional schools:
Bonnett: 0.8% Campbell: 0.9%
- Percentage of students K-12 enrolled in private schools:
Bonnett: 26.9% Campbell: 17.5%
Percentage of population below poverty level:
| Bonnett: | 6.3% |
| Campbell: | 5.6% |
Median year owner moved in (as recorded in 2022):
Median year renter moved in (as recorded in 2022):
| Bonnett: | 2006 |
| Campbell: | 2007 |
Median year renter moved in (as recorded in 2022):
| Bonnett: | 2016 |
| Campbell: | 2016 |
Percentage of married-couple families with both working:
| Bonnett: | 82.0% |
| Campbell: | 72.5% |

- 54.4%Utility gas
- 39.5%Electricity
- 4.5%Bottled, tank, or LP gas
- 1.6%Solar energy
Roads and streets:
S Bascom Ave
Length: 0.54 miles
Directions: N-S, SW-NE
Address range: 2260 to 2568
Directions: N-S, SW-NE
Address range: 2260 to 2568
Surrey Pl
Length: 0.12 miles
Directions: E-W, SE-NW
Address range: 2000 to 2199
Directions: E-W, SE-NW
Address range: 2000 to 2199
la Con Ct
Length: 0.06 miles
Directions: N-S, SW-NE
Address range: 2000 to 2099
Directions: N-S, SW-NE
Address range: 2000 to 2099