Sterling, New York (NY) income map, earnings map, and wages data
The median household income in Sterling, NY in 2022 was $59,887, which was 32.8% less than the median annual income of $79,557 across the entire state of New York. Compared to the median income of $35,061 in 2000 this represents an increase of 41.5%. The per capita income in 2022 was $31,275, which means an increase of 49.1% compared to 2000 when it was $15,912.
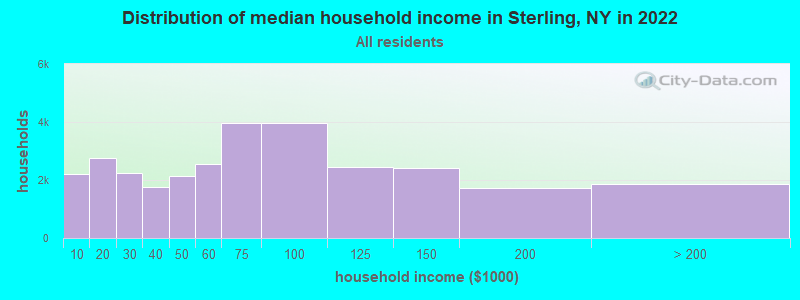
Income statistics for all residents
Median household income in Sterling, NY in 2022:| Sterling: | $59,887 |
| New York: | $79,557 |
Change in median household income between 2000 and 2022:| Sterling, New York: | +70.8% |
| New York: | +83.3% |
Number of households with income < $10k:| Sterling: | 7.4% (2,222) |
| New York: | 6.8% (527,598) |
Number of households with income $10k - 20k:| Sterling: | 9.2% (2,765) |
| State: | 7.4% (574,940) |
Number of households with income $20k - 30k:| Sterling: | 7.4% (2,228) |
| State: | 6.7% (517,718) |
Number of households with income $30k - 40k:| Sterling: | 5.9% (1,761) |
| State: | 6.5% (506,674) |
Number of households with income $40k - 50k:| Sterling: | 7.1% (2,125) |
| State: | 6.1% (470,439) |
Number of households with income $50k - 60k:| Sterling: | 8.5% (2,541) |
| New York: | 5.8% (454,042) |
Number of households with income $60k - 75k:| Sterling: | 13.2% (3,967) |
| State: | 8.5% (657,508) |
Number of households with income $75k - 100k:| Sterling: | 13.3% (3,980) |
| State: | 11.6% (899,824) |
Number of households with income $100k - 125k:| Sterling: | 8.1% (2,442) |
| State: | 9.3% (723,825) |
Number of households with income $125k - 150k:| Sterling: | 8.0% (2,400) |
| State: | 7.1% (552,420) |
Number of households with income $150k - 200k:| Sterling: | 5.7% (1,720) |
| New York: | 9.4% (727,051) |
Number of households with income > $200k:| Sterling: | 6.3% (1,878) |
| State: | 15.0% (1,162,269) |
Aggregate household income in Sterling in 2022: $100,537,246
Median family income in Sterling in 2022:| Sterling: | $71,374 |
| State: | $99,066 |
Median non-family income in Sterling in 2022:| Sterling: | $44,023 |
| State: | $50,181 |
Change in median non-family income between 2000 and 2022:| Sterling, New York: | +107.5% |
| State: | +85.4% |
Median per capita income in Sterling in 2022:| Sterling: | $31,275 |
| New York: | $47,421 |
Change in median per capita income between 2000 and 2022:| Sterling, New York: | +96.6% |
| State: | +102.7% |
Income statistics for White residents
Median household income in Sterling, NY in 2022:| Sterling: | $60,533 |
| New York: | $89,408 |
Change in median household income between 2000 and 2022:| Sterling, New York: | +70.9% |
| New York: | +85.5% |
Number of households with income < $10k:| Sterling: | 4.9% (1,376) |
| State: | 4.8% (225,550) |
Number of households with income $10k - 20k:| Sterling: | 9.1% (2,542) |
| State: | 6.1% (289,425) |
Number of households with income $20k - 30k:| Sterling: | 7.7% (2,149) |
| State: | 5.9% (280,254) |
Number of households with income $30k - 40k:| Sterling: | 6.2% (1,732) |
| New York: | 6.1% (288,263) |
Number of households with income $40k - 50k:| Sterling: | 7.2% (2,013) |
| State: | 5.9% (278,079) |
Number of households with income $50k - 60k:| Sterling: | 8.8% (2,455) |
| State: | 5.7% (267,554) |
Number of households with income $60k - 75k:| Sterling: | 13.9% (3,881) |
| New York: | 8.4% (398,344) |
Number of households with income $75k - 100k:| Sterling: | 13.8% (3,856) |
| State: | 11.8% (554,841) |
Number of households with income $100k - 125k:| Sterling: | 8.2% (2,285) |
| New York: | 10.0% (469,794) |
Number of households with income $125k - 150k:| Sterling: | 8.6% (2,389) |
| New York: | 7.6% (360,467) |
Number of households with income $150k - 200k:| Sterling: | 5.7% (1,601) |
| State: | 10.1% (477,078) |
Number of households with income > $200k:| Sterling: | 5.7% (1,591) |
| State: | 17.6% (829,233) |
Aggregate household income in Sterling in 2022: $95,452,433
Median family income in Sterling in 2022:| Sterling: | $73,831 |
| State: | $115,170 |
Number of families with income < $10k:| Sterling: | 1.4% (8) |
| State: | 2.5% (68,851) |
Number of families with income $10k - 20k:| Sterling: | 7.9% (44) |
| New York: | 3.0% (83,127) |
Number of families with income $20k - 30k:| Sterling: | 13.8% (77) |
| State: | 3.5% (97,578) |
Number of families with income $30k - 40k:| Sterling: | 8.3% (46) |
| State: | 4.1% (114,108) |
Number of families with income $40k - 50k:| Sterling: | 10.3% (57) |
| State: | 4.7% (130,902) |
Number of families with income $50k - 60k:| Sterling: | 10.7% (59) |
| New York: | 4.9% (135,118) |
Number of families with income $60k - 75k:| Sterling: | 11.9% (66) |
| New York: | 7.8% (216,254) |
Number of families with income $75k - 100k:| Sterling: | 22.0% (122) |
| State: | 12.4% (342,382) |
Number of families with income $100k - 125k:| Sterling: | 11.6% (65) |
| New York: | 11.4% (314,917) |
Number of families with income $150k - 200k:| Sterling: | 2.0% (11) |
| State: | 13.2% (365,586) |
Median non-family income in Sterling in 2022:| Sterling: | $46,183 |
| State: | $54,783 |
Change in median non-family income between 2000 and 2022:| Sterling, New York: | +116.2% |
| New York: | +87.9% |
Median per capita income in Sterling in 2022:| Sterling: | $32,419 |
| New York: | $57,640 |
Change in median per capita income between 2000 and 2022:| Sterling, New York: | +102.7% |
| State: | +111.6% |
Income statistics for Hispanic or Latino residents
Median household income in Sterling, NY in 2022:| Sterling: | $55,146 |
| New York: | $60,468 |
Change in median household income between 2000 and 2022:| Sterling, New York: | +96.6% |
| State: | +98.3% |
Number of households with income < $10k:| Sterling: | 10.0% (58,461) |
| State: | 9.9% (127,185) |
Number of households with income $10k - 20k:| Sterling: | 10.7% (62,931) |
| New York: | 10.7% (136,699) |
Number of households with income $20k - 30k:| Sterling: | 8.1% (47,387) |
| State: | 8.1% (102,991) |
Number of households with income $30k - 40k:| Sterling: | 7.8% (45,899) |
| New York: | 7.8% (100,149) |
Number of households with income $40k - 50k:| Sterling: | 6.8% (40,159) |
| State: | 6.9% (87,760) |
Number of households with income $50k - 60k:| Sterling: | 6.3% (37,187) |
| New York: | 6.3% (80,968) |
Number of households with income $60k - 75k:| Sterling: | 8.6% (50,687) |
| State: | 8.7% (110,631) |
Number of households with income $75k - 100k:| Sterling: | 11.2% (65,426) |
| State: | 11.2% (142,787) |
Number of households with income $100k - 125k:| Sterling: | 8.2% (47,943) |
| State: | 8.2% (104,850) |
Number of households with income $125k - 150k:| Sterling: | 6.3% (36,785) |
| New York: | 6.3% (80,274) |
Number of households with income $150k - 200k:| Sterling: | 7.4% (43,486) |
| New York: | 7.4% (95,117) |
Number of households with income > $200k:| Sterling: | 8.6% (50,151) |
| State: | 8.6% (109,514) |
Aggregate household income in Sterling in 2022: $924,748
Median family income in Sterling in 2022:| Sterling: | $61,262 |
| New York: | $68,770 |
Number of families with income < $10k:| Sterling: | 7.5% (12) |
| State: | 6.9% (58,565) |
Number of families with income $10k - 20k:| Sterling: | 13.5% (22) |
| State: | 7.0% (59,058) |
Number of families with income $20k - 30k:| Sterling: | 17.2% (27) |
| State: | 8.0% (68,048) |
Number of families with income $30k - 40k:| Sterling: | 17.7% (28) |
| State: | 8.4% (70,668) |
Number of families with income $40k - 50k:| Sterling: | 14.1% (23) |
| State: | 7.4% (62,941) |
Number of families with income $50k - 60k:| Sterling: | 6.6% (10) |
| State: | 6.6% (55,592) |
Number of families with income $60k - 75k:| Sterling: | 8.4% (13) |
| State: | 9.3% (78,564) |
Number of families with income $75k - 100k:| Sterling: | 11.5% (18) |
| New York: | 12.6% (106,685) |
Number of families with income $100k - 125k:| Sterling: | 3.1% (5) |
| State: | 9.4% (79,139) |
Number of families with income $150k - 200k:| Sterling: | 0.5% (1) |
| State: | 8.3% (69,877) |
Median non-family income in Sterling in 2022:| Sterling: | $327 |
| State: | $34,000 |
Median per capita income in Sterling in 2022:| Sterling: | $8,416 |
| New York: | $29,761 |
Change in median per capita income between 2000 and 2022:| Sterling, New York: | +5.3% |
| State: | +132.7% |
Income statistics for Multirace residents
Median household income in Sterling, NY in 2022:| Sterling: | $53,686 |
| State: | $73,557 |
Change in median household income between 2000 and 2022:| Sterling, New York: | +116.5% |
| State: | +123.9% |
Number of households with income < $10k:| Sterling: | 8.9% (21,884) |
| New York: | 8.9% (57,924) |
Number of households with income $10k - 20k:| Sterling: | 8.7% (21,342) |
| State: | 8.7% (56,590) |
Number of households with income $20k - 30k:| Sterling: | 7.1% (17,445) |
| New York: | 7.1% (46,287) |
Number of households with income $30k - 40k:| Sterling: | 6.9% (16,993) |
| State: | 6.9% (45,132) |
Number of households with income $40k - 50k:| Sterling: | 5.8% (14,260) |
| State: | 5.8% (37,946) |
Number of households with income $50k - 60k:| Sterling: | 5.6% (13,700) |
| State: | 5.6% (36,410) |
Number of households with income $60k - 75k:| Sterling: | 7.8% (19,110) |
| State: | 7.8% (50,819) |
Number of households with income $75k - 100k:| Sterling: | 11.7% (28,637) |
| State: | 11.7% (76,024) |
Number of households with income $100k - 125k:| Sterling: | 9.3% (22,788) |
| State: | 9.3% (60,635) |
Number of households with income $125k - 150k:| Sterling: | 6.2% (15,269) |
| New York: | 6.2% (40,533) |
Number of households with income $150k - 200k:| Sterling: | 8.6% (21,240) |
| State: | 8.6% (56,409) |
Number of households with income > $200k:| Sterling: | 13.4% (32,975) |
| New York: | 13.4% (87,442) |
Aggregate household income in Sterling in 2022: $6,335,335
Median family income in Sterling in 2022:| Sterling: | $65,208 |
| State: | $85,788 |
Number of families with income $20k - 30k:| Sterling: | 100.0% (33) |
| State: | 6.6% (26,534) |
Median non-family income in Sterling in 2022:| Sterling: | $40,228 |
| New York: | $46,403 |
Change in median non-family income between 2000 and 2022:| Sterling, New York: | +114.5% |
| New York: | +113.6% |
Median per capita income in Sterling in 2022:| Sterling: | $39,251 |
| New York: | $36,931 |
Income statistics for other residents
Number of households with income < $10k:| Sterling: | 6.7% (1) |
| State: | 10.3% (69,252) |
Number of households with income $10k - 20k:| Sterling: | 13.3% (2) |
| State: | 11.0% (73,890) |
Number of households with income $20k - 30k:| Sterling: | 13.3% (2) |
| State: | 8.8% (59,096) |
Number of households with income $30k - 40k:| Sterling: | 6.7% (1) |
| State: | 8.1% (54,418) |
Number of households with income $40k - 50k:| Sterling: | 6.7% (1) |
| State: | 7.3% (49,042) |
Number of households with income $50k - 60k:| Sterling: | 6.7% (1) |
| State: | 6.5% (43,945) |
Number of households with income $60k - 75k:| Sterling: | 6.7% (1) |
| New York: | 9.5% (64,087) |
Number of households with income $75k - 100k:| Sterling: | 13.3% (2) |
| New York: | 10.9% (73,094) |
Number of households with income $100k - 125k:| Sterling: | 6.7% (1) |
| State: | 7.9% (53,055) |
Number of households with income $125k - 150k:| Sterling: | 6.7% (1) |
| New York: | 5.9% (39,446) |
Number of households with income $150k - 200k:| Sterling: | 6.7% (1) |
| State: | 7.2% (48,653) |
Number of households with income > $200k:| Sterling: | 6.7% (1) |
| State: | 6.6% (44,703) |
Aggregate household income in Sterling in 2022: $1,155,881
Median per capita income in Sterling in 2022:| Sterling: | $9,885 |
| State: | $26,975 |