The median household income in Salisbury Mills, NY in 2022 was $134,766, which was 41.0% greater than the median annual income of $79,557 across the entire state of New York. Compared to the median income of $52,058 in 2000 this represents an increase of 61.4%. The per capita income in 2022 was $41,563, which means an increase of 48.0% compared to 2000 when it was $21,597.
Whole page based on the data from 2000 / 2022 when the population of Salisbury Mills, New York was 536 / 291
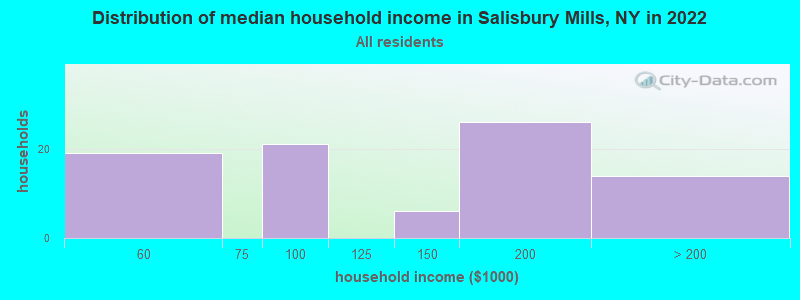
Income statistics for all residents
Median household income in Salisbury Mills, NY in 2022:
Salisbury Mills:
$134,767
State:
$79,557
Number of households with income < $10k:
Salisbury Mills:
0.0% (0)
State:
6.8% (527,598)
Number of households with income $10k - 20k:
Salisbury Mills:
0.0% (0)
State:
7.4% (574,940)
Number of households with income $20k - 30k:
Salisbury Mills:
0.0% (0)
State:
6.7% (517,718)
Number of households with income $30k - 40k:
Salisbury Mills:
0.0% (0)
State:
6.5% (506,674)
Number of households with income $40k - 50k:
Salisbury Mills:
0.0% (0)
New York:
6.1% (470,439)
Number of households with income $50k - 60k:
Salisbury Mills:
22.1% (19)
State:
5.8% (454,042)
Number of households with income $60k - 75k:
Salisbury Mills:
0.0% (0)
New York:
8.5% (657,508)
Number of households with income $75k - 100k:
Salisbury Mills:
24.4% (21)
State:
11.6% (899,824)
Number of households with income $100k - 125k:
Salisbury Mills:
0.0% (0)
State:
9.3% (723,825)
Number of households with income $125k - 150k:
Salisbury Mills:
7.0% (6)
New York:
7.1% (552,420)
Number of households with income $150k - 200k:
Salisbury Mills:
30.2% (26)
State:
9.4% (727,051)
Number of households with income > $200k:
Salisbury Mills:
16.3% (14)
State:
15.0% (1,162,269)
Aggregate household income in Salisbury Mills in 2022: $12,011,572
Median family income in Salisbury Mills in 2022:
Salisbury Mills:
$148,163
New York:
$99,066
Number of families with income $75k - 100k:
Salisbury Mills:
32.2% (21)
State:
12.3% (583,110)
Number of families with income $125k - 150k:
Salisbury Mills:
17.4% (12)
New York:
8.5% (400,594)
Number of families with income $150k - 200k:
Salisbury Mills:
29.2% (19)
State:
11.6% (551,650)
Number of families with income > $200k:
Salisbury Mills:
21.2% (14)
State:
18.9% (895,998)
Median income for 3 person families:
Salisbury Mills:
$144,132
State:
$101,266
Median income for families with 0 earners:
Salisbury Mills:
$0
State:
$44,019
Median income for families with 1 earner:
Salisbury Mills:
$0
State:
$66,402
Median income for families with 2 earners:
Salisbury Mills:
$152,876
State:
$128,561
Median income for families with 3+ earners:
Salisbury Mills:
$0
State:
$161,553
Median per capita income in Salisbury Mills in 2022:
Salisbury Mills:
$41,563
State:
$47,421
Change in median per capita income between 2000 and 2022:
Salisbury Mills, New York:
+92.4%
State:
+102.7%
Income statistics for White residents
Median household income in Salisbury Mills, NY in 2022:
Salisbury Mills:
$90,615
New York:
$89,408
Change in median household income between 2000 and 2022:
Salisbury Mills, New York:
+67.3%
State:
+85.5%
Number of households with income < $10k:
Salisbury Mills:
0.0% (0)
State:
4.8% (225,550)
Number of households with income $10k - 20k:
Salisbury Mills:
0.0% (0)
State:
6.1% (289,425)
Number of households with income $20k - 30k:
Salisbury Mills:
0.0% (0)
State:
5.9% (280,254)
Number of households with income $30k - 40k:
Salisbury Mills:
0.0% (0)
State:
6.1% (288,263)
Number of households with income $40k - 50k:
Salisbury Mills:
0.0% (0)
State:
5.9% (278,079)
Number of households with income $50k - 60k:
Salisbury Mills:
25.0% (16)
New York:
5.7% (267,554)
Number of households with income $60k - 75k:
Salisbury Mills:
0.0% (0)
State:
8.4% (398,344)
Number of households with income $75k - 100k:
Salisbury Mills:
32.8% (21)
State:
11.8% (554,841)
Number of households with income $100k - 125k:
Salisbury Mills:
0.0% (0)
State:
10.0% (469,794)
Number of households with income $125k - 150k:
Salisbury Mills:
7.8% (5)
State:
7.6% (360,467)
Number of households with income $150k - 200k:
Salisbury Mills:
14.1% (9)
New York:
10.1% (477,078)
Number of households with income > $200k:
Salisbury Mills:
20.3% (13)
State:
17.6% (829,233)
Aggregate household income in Salisbury Mills in 2022: $8,600,909
Median family income in Salisbury Mills in 2022:
Salisbury Mills:
$132,620
State:
$115,170
Number of families with income $75k - 100k:
Salisbury Mills:
43.2% (21)
State:
12.4% (342,382)
Number of families with income $125k - 150k:
Salisbury Mills:
20.9% (10)
State:
9.4% (260,489)
Number of families with income $150k - 200k:
Salisbury Mills:
8.6% (4)
State:
13.2% (365,586)
Number of families with income > $200k:
Salisbury Mills:
27.2% (13)
State:
23.2% (642,319)
Median per capita income in Salisbury Mills in 2022:
Salisbury Mills:
$41,146
State:
$57,640
Change in median per capita income between 2000 and 2022:
Salisbury Mills, New York:
+81.0%
New York:
+111.6%
Income statistics for Black or African American residents
Aggregate household income in Salisbury Mills in 2022: $1,589,641,300
Median per capita income in Salisbury Mills in 2022:
Salisbury Mills:
$31,392
State:
$31,947
Change in median per capita income between 2000 and 2022:
Salisbury Mills, New York:
+98.6%
New York:
+106.1%
Income statistics for Hispanic or Latino residents
Median per capita income in Salisbury Mills in 2022:
Salisbury Mills:
$29,520
State:
$29,761
Change in median per capita income between 2000 and 2022:
Salisbury Mills, New York:
+109.4%
State:
+132.7%
Income statistics for other residents
Median per capita income in Salisbury Mills in 2022:
Salisbury Mills:
$31,375
State:
$26,975
Change in median per capita income between 2000 and 2022:
Salisbury Mills, New York:
+121.5%
State:
+144.6%
Discuss Salisbury Mills, New York (NY) on our hugely popular New York forum.