Redwood-Potter, California (CA) income map, earnings map, and wages data
The median household income in Redwood-Potter, CA in 2022 was $71,890, which was 27.3% less than the median annual income of $91,551 across the entire state of California. Compared to the median income of $39,496 in 2000 this represents an increase of 45.1%. The per capita income in 2022 was $40,743, which means an increase of 50.6% compared to 2000 when it was $20,142.
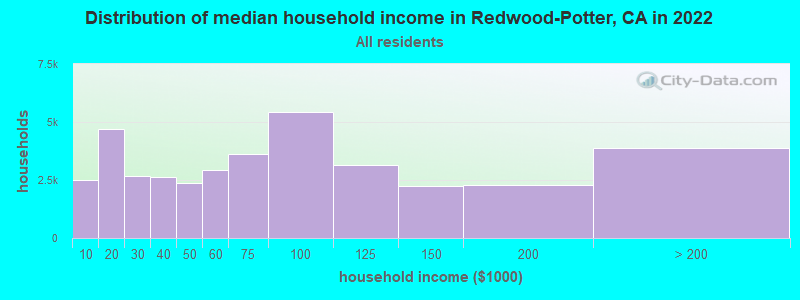
Income statistics for all residents
Median household income in Redwood-Potter, CA in 2022:| Redwood-Potter: | $71,891 |
| State: | $91,551 |
Change in median household income between 2000 and 2022:| Redwood-Potter, California: | +82.0% |
| State: | +92.8% |
Number of households with income < $10k:| Redwood-Potter: | 6.5% (2,499) |
| State: | 4.8% (654,370) |
Number of households with income $10k - 20k:| Redwood-Potter: | 12.2% (4,699) |
| State: | 5.8% (789,493) |
Number of households with income $20k - 30k:| Redwood-Potter: | 6.9% (2,654) |
| California: | 5.7% (778,318) |
Number of households with income $30k - 40k:| Redwood-Potter: | 6.9% (2,650) |
| State: | 5.8% (783,170) |
Number of households with income $40k - 50k:| Redwood-Potter: | 6.2% (2,389) |
| State: | 5.8% (781,352) |
Number of households with income $50k - 60k:| Redwood-Potter: | 7.6% (2,914) |
| State: | 5.6% (760,175) |
Number of households with income $60k - 75k:| Redwood-Potter: | 9.4% (3,626) |
| State: | 8.2% (1,104,699) |
Number of households with income $75k - 100k:| Redwood-Potter: | 14.2% (5,436) |
| California: | 12.0% (1,627,633) |
Number of households with income $100k - 125k:| Redwood-Potter: | 8.2% (3,132) |
| California: | 10.0% (1,358,619) |
Number of households with income $125k - 150k:| Redwood-Potter: | 5.8% (2,236) |
| California: | 7.6% (1,027,455) |
Number of households with income $150k - 200k:| Redwood-Potter: | 5.9% (2,278) |
| State: | 10.6% (1,439,811) |
Number of households with income > $200k:| Redwood-Potter: | 10.1% (3,887) |
| State: | 18.0% (2,445,491) |
Aggregate household income in Redwood-Potter in 2022: $475,042,903
Median family income in Redwood-Potter in 2022:| Redwood-Potter: | $91,832 |
| State: | $104,823 |
Median non-family income in Redwood-Potter in 2022:| Redwood-Potter: | $36,600 |
| State: | $59,348 |
Change in median non-family income between 2000 and 2022:| Redwood-Potter, California: | +50.5% |
| State: | +85.3% |
Median per capita income in Redwood-Potter in 2022:| Redwood-Potter: | $40,744 |
| State: | $46,661 |
Change in median per capita income between 2000 and 2022:| Redwood-Potter, California: | +102.3% |
| State: | +105.5% |
Income statistics for White residents
Median household income in Redwood-Potter, CA in 2022:| Redwood-Potter: | $75,522 |
| California: | $100,917 |
Change in median household income between 2000 and 2022:| Redwood-Potter, California: | +87.5% |
| California: | +96.8% |
Number of households with income < $10k:| Redwood-Potter: | 5.3% (1,485) |
| California: | 4.4% (284,109) |
Number of households with income $10k - 20k:| Redwood-Potter: | 12.4% (3,458) |
| State: | 5.3% (340,330) |
Number of households with income $20k - 30k:| Redwood-Potter: | 6.6% (1,835) |
| California: | 5.3% (343,145) |
Number of households with income $30k - 40k:| Redwood-Potter: | 6.5% (1,827) |
| State: | 5.1% (330,146) |
Number of households with income $40k - 50k:| Redwood-Potter: | 5.5% (1,543) |
| California: | 5.2% (335,310) |
Number of households with income $50k - 60k:| Redwood-Potter: | 6.6% (1,856) |
| California: | 5.1% (326,299) |
Number of households with income $60k - 75k:| Redwood-Potter: | 10.4% (2,914) |
| State: | 7.6% (487,640) |
Number of households with income $75k - 100k:| Redwood-Potter: | 14.5% (4,049) |
| State: | 11.5% (736,578) |
Number of households with income $100k - 125k:| Redwood-Potter: | 8.0% (2,234) |
| State: | 10.1% (648,782) |
Number of households with income $125k - 150k:| Redwood-Potter: | 7.0% (1,960) |
| State: | 7.8% (499,671) |
Number of households with income $150k - 200k:| Redwood-Potter: | 5.6% (1,572) |
| State: | 11.4% (729,603) |
Number of households with income > $200k:| Redwood-Potter: | 11.6% (3,242) |
| State: | 21.2% (1,364,246) |
Aggregate household income in Redwood-Potter in 2022: $372,239,205
Median family income in Redwood-Potter in 2022:| Redwood-Potter: | $97,142 |
| California: | $125,379 |
Number of families with income < $10k:| Redwood-Potter: | 4.2% (91) |
| State: | 2.2% (87,079) |
Number of families with income $10k - 20k:| Redwood-Potter: | 2.9% (63) |
| State: | 2.5% (97,716) |
Number of families with income $20k - 30k:| Redwood-Potter: | 5.2% (112) |
| State: | 3.5% (137,295) |
Number of families with income $30k - 40k:| Redwood-Potter: | 3.1% (67) |
| State: | 3.9% (152,947) |
Number of families with income $40k - 50k:| Redwood-Potter: | 4.2% (91) |
| State: | 4.3% (169,197) |
Number of families with income $50k - 60k:| Redwood-Potter: | 5.1% (112) |
| State: | 4.5% (176,192) |
Number of families with income $60k - 75k:| Redwood-Potter: | 13.3% (289) |
| State: | 7.0% (274,752) |
Number of families with income $75k - 100k:| Redwood-Potter: | 22.8% (495) |
| State: | 11.3% (445,632) |
Number of families with income $100k - 125k:| Redwood-Potter: | 11.5% (251) |
| California: | 10.7% (423,630) |
Number of families with income $125k - 150k:| Redwood-Potter: | 3.1% (68) |
| California: | 9.1% (357,408) |
Number of families with income $150k - 200k:| Redwood-Potter: | 8.6% (188) |
| California: | 13.5% (532,693) |
Number of families with income > $200k:| Redwood-Potter: | 16.0% (347) |
| State: | 27.6% (1,086,948) |
Median non-family income in Redwood-Potter in 2022:| Redwood-Potter: | $36,936 |
| State: | $62,819 |
Change in median non-family income between 2000 and 2022:| Redwood-Potter, California: | +56.8% |
| State: | +84.4% |
Median per capita income in Redwood-Potter in 2022:| Redwood-Potter: | $47,377 |
| State: | $61,706 |
Change in median per capita income between 2000 and 2022:| Redwood-Potter, California: | +123.1% |
| State: | +122.7% |
Income statistics for Black or African American residents
Number of households with income < $10k:| Redwood-Potter: | 8.8% (12) |
| State: | 9.0% (73,219) |
Number of households with income $10k - 20k:| Redwood-Potter: | 10.3% (14) |
| State: | 10.6% (86,666) |
Number of households with income $20k - 30k:| Redwood-Potter: | 7.4% (10) |
| State: | 7.1% (57,719) |
Number of households with income $30k - 40k:| Redwood-Potter: | 7.4% (10) |
| State: | 7.2% (58,714) |
Number of households with income $40k - 50k:| Redwood-Potter: | 7.4% (10) |
| State: | 7.1% (58,075) |
Number of households with income $50k - 60k:| Redwood-Potter: | 6.6% (9) |
| State: | 6.8% (55,229) |
Number of households with income $60k - 75k:| Redwood-Potter: | 8.8% (12) |
| State: | 8.8% (71,895) |
Number of households with income $75k - 100k:| Redwood-Potter: | 11.8% (16) |
| State: | 11.9% (96,893) |
Number of households with income $100k - 125k:| Redwood-Potter: | 8.8% (12) |
| State: | 8.7% (70,729) |
Number of households with income $125k - 150k:| Redwood-Potter: | 5.9% (8) |
| State: | 6.3% (51,211) |
Number of households with income $150k - 200k:| Redwood-Potter: | 7.4% (10) |
| State: | 7.2% (58,687) |
Number of households with income > $200k:| Redwood-Potter: | 9.6% (13) |
| State: | 9.3% (75,487) |
Aggregate household income in Redwood-Potter in 2022: $12,014,320
Median per capita income in Redwood-Potter in 2022:| Redwood-Potter: | $22,437 |
| California: | $36,708 |
Change in median per capita income between 2000 and 2022:| Redwood-Potter, California: | +75.5% |
| State: | +110.4% |
Income statistics for Asian residents
Median household income in Redwood-Potter, CA in 2022:| Redwood-Potter: | $76,740 |
| State: | $119,861 |
Change in median household income between 2000 and 2022:| Redwood-Potter, California: | +7.7% |
| State: | +116.5% |
Number of households with income < $10k:| Redwood-Potter: | 5.1% (68,362) |
| California: | 5.1% (106,273) |
Number of households with income $10k - 20k:| Redwood-Potter: | 4.9% (65,526) |
| California: | 4.9% (101,815) |
Number of households with income $20k - 30k:| Redwood-Potter: | 4.6% (60,735) |
| State: | 4.6% (94,414) |
Number of households with income $30k - 40k:| Redwood-Potter: | 4.1% (54,366) |
| State: | 4.1% (84,491) |
Number of households with income $40k - 50k:| Redwood-Potter: | 4.0% (52,597) |
| California: | 4.0% (81,758) |
Number of households with income $50k - 60k:| Redwood-Potter: | 3.9% (52,068) |
| State: | 3.9% (80,971) |
Number of households with income $60k - 75k:| Redwood-Potter: | 6.0% (79,886) |
| State: | 6.0% (124,194) |
Number of households with income $75k - 100k:| Redwood-Potter: | 9.7% (128,929) |
| State: | 9.7% (200,337) |
Number of households with income $100k - 125k:| Redwood-Potter: | 9.4% (124,467) |
| California: | 9.4% (193,488) |
Number of households with income $125k - 150k:| Redwood-Potter: | 7.7% (101,826) |
| State: | 7.7% (158,253) |
Number of households with income $150k - 200k:| Redwood-Potter: | 12.2% (162,187) |
| State: | 12.2% (252,139) |
Number of households with income > $200k:| Redwood-Potter: | 28.4% (377,328) |
| California: | 28.4% (586,641) |
Aggregate household income in Redwood-Potter in 2022: $5,234,278
Median family income in Redwood-Potter in 2022:| Redwood-Potter: | $49,455 |
| State: | $136,040 |
Number of families with income $40k - 50k:| Redwood-Potter: | 41.4% (6) |
| California: | 3.9% (58,471) |
Number of families with income $60k - 75k:| Redwood-Potter: | 58.6% (8) |
| State: | 5.9% (88,675) |
Median per capita income in Redwood-Potter in 2022:| Redwood-Potter: | $25,037 |
| California: | $58,824 |
Change in median per capita income between 2000 and 2022:| Redwood-Potter, California: | +20.0% |
| California: | +166.8% |
Income statistics for Hispanic or Latino residents
Median household income in Redwood-Potter, CA in 2022:| Redwood-Potter: | $63,483 |
| State: | $75,698 |
Change in median household income between 2000 and 2022:| Redwood-Potter, California: | +73.0% |
| California: | +107.2% |
Number of households with income < $10k:| Redwood-Potter: | 8.2% (660) |
| State: | 4.3% (183,294) |
Number of households with income $10k - 20k:| Redwood-Potter: | 10.4% (836) |
| State: | 6.0% (253,903) |
Number of households with income $20k - 30k:| Redwood-Potter: | 10.2% (819) |
| State: | 6.8% (286,386) |
Number of households with income $30k - 40k:| Redwood-Potter: | 9.6% (773) |
| State: | 7.4% (313,728) |
Number of households with income $40k - 50k:| Redwood-Potter: | 8.6% (695) |
| State: | 7.4% (313,199) |
Number of households with income $50k - 60k:| Redwood-Potter: | 11.5% (924) |
| California: | 7.2% (305,366) |
Number of households with income $60k - 75k:| Redwood-Potter: | 8.4% (677) |
| California: | 10.3% (434,937) |
Number of households with income $75k - 100k:| Redwood-Potter: | 10.0% (803) |
| State: | 14.4% (607,302) |
Number of households with income $100k - 125k:| Redwood-Potter: | 10.7% (861) |
| State: | 10.6% (447,424) |
Number of households with income $125k - 150k:| Redwood-Potter: | 4.1% (331) |
| California: | 7.5% (316,022) |
Number of households with income $150k - 200k:| Redwood-Potter: | 7.2% (578) |
| State: | 9.2% (386,269) |
Number of households with income > $200k:| Redwood-Potter: | 1.2% (97) |
| California: | 8.8% (372,651) |
Aggregate household income in Redwood-Potter in 2022: $85,490,022
Median family income in Redwood-Potter in 2022:| Redwood-Potter: | $67,226 |
| California: | $77,589 |
Number of families with income < $10k:| Redwood-Potter: | 6.8% (92) |
| California: | 3.9% (129,468) |
Number of families with income $10k - 20k:| Redwood-Potter: | 7.2% (98) |
| California: | 4.6% (151,997) |
Number of families with income $20k - 30k:| Redwood-Potter: | 9.4% (128) |
| State: | 6.6% (216,764) |
Number of families with income $30k - 40k:| Redwood-Potter: | 13.1% (179) |
| State: | 7.6% (249,849) |
Number of families with income $40k - 50k:| Redwood-Potter: | 11.4% (155) |
| State: | 7.7% (254,822) |
Number of families with income $50k - 60k:| Redwood-Potter: | 11.0% (151) |
| State: | 7.4% (244,815) |
Number of families with income $60k - 75k:| Redwood-Potter: | 11.2% (153) |
| State: | 10.5% (345,838) |
Number of families with income $75k - 100k:| Redwood-Potter: | 12.9% (176) |
| California: | 14.9% (491,589) |
Number of families with income $100k - 125k:| Redwood-Potter: | 7.3% (99) |
| State: | 10.7% (355,400) |
Number of families with income $125k - 150k:| Redwood-Potter: | 1.2% (17) |
| California: | 7.8% (259,317) |
Number of families with income $150k - 200k:| Redwood-Potter: | 4.8% (66) |
| State: | 9.3% (306,566) |
Number of families with income > $200k:| Redwood-Potter: | 3.8% (51) |
| State: | 9.1% (299,984) |
Median non-family income in Redwood-Potter in 2022:| Redwood-Potter: | $61,331 |
| State: | $49,746 |
Median per capita income in Redwood-Potter in 2022:| Redwood-Potter: | $28,409 |
| California: | $27,240 |
Change in median per capita income between 2000 and 2022:| Redwood-Potter, California: | +98.3% |
| California: | +133.3% |
Income statistics for American Indian and Alaska Native residents
Median household income in Redwood-Potter, CA in 2022:| Redwood-Potter: | $52,291 |
| California: | $76,752 |
Change in median household income between 2000 and 2022:| Redwood-Potter, California: | +113.8% |
| State: | +110.0% |
Number of households with income < $10k:| Redwood-Potter: | 5.4% (2,822) |
| California: | 5.4% (8,471) |
Number of households with income $10k - 20k:| Redwood-Potter: | 6.0% (3,114) |
| State: | 6.0% (9,381) |
Number of households with income $20k - 30k:| Redwood-Potter: | 5.6% (2,925) |
| State: | 5.5% (8,668) |
Number of households with income $30k - 40k:| Redwood-Potter: | 8.2% (4,291) |
| State: | 8.3% (13,030) |
Number of households with income $40k - 50k:| Redwood-Potter: | 7.0% (3,631) |
| California: | 6.9% (10,908) |
Number of households with income $50k - 60k:| Redwood-Potter: | 7.1% (3,711) |
| State: | 7.1% (11,198) |
Number of households with income $60k - 75k:| Redwood-Potter: | 9.6% (5,012) |
| State: | 9.6% (15,190) |
Number of households with income $75k - 100k:| Redwood-Potter: | 14.0% (7,322) |
| State: | 14.1% (22,274) |
Number of households with income $100k - 125k:| Redwood-Potter: | 11.3% (5,882) |
| State: | 11.2% (17,643) |
Number of households with income $125k - 150k:| Redwood-Potter: | 8.3% (4,310) |
| State: | 8.3% (13,117) |
Number of households with income $150k - 200k:| Redwood-Potter: | 8.8% (4,580) |
| State: | 8.8% (13,853) |
Number of households with income > $200k:| Redwood-Potter: | 8.8% (4,599) |
| State: | 8.8% (13,925) |
Aggregate household income in Redwood-Potter in 2022: $8,448,705
Median family income in Redwood-Potter in 2022:| Redwood-Potter: | $52,479 |
| California: | $81,108 |
Number of families with income < $10k:| Redwood-Potter: | 9.8% (8) |
| State: | 5.0% (5,711) |
Number of families with income $10k - 20k:| Redwood-Potter: | 10.5% (9) |
| State: | 3.7% (4,148) |
Number of families with income $20k - 30k:| Redwood-Potter: | 14.8% (13) |
| California: | 4.3% (4,876) |
Number of families with income $30k - 40k:| Redwood-Potter: | 9.1% (8) |
| State: | 8.8% (9,994) |
Number of families with income $40k - 50k:| Redwood-Potter: | 5.9% (5) |
| California: | 7.8% (8,776) |
Number of families with income $60k - 75k:| Redwood-Potter: | 24.4% (21) |
| California: | 9.1% (10,247) |
Number of families with income $75k - 100k:| Redwood-Potter: | 4.6% (4) |
| State: | 14.8% (16,731) |
Number of families with income $100k - 125k:| Redwood-Potter: | 20.9% (18) |
| State: | 12.0% (13,609) |
Median non-family income in Redwood-Potter in 2022:| Redwood-Potter: | $49,885 |
| California: | $51,296 |
Change in median non-family income between 2000 and 2022:| Redwood-Potter, California: | +80.0% |
| State: | +114.0% |
Median per capita income in Redwood-Potter in 2022:| Redwood-Potter: | $21,964 |
| California: | $30,289 |
Income statistics for Multirace residents
Median household income in Redwood-Potter, CA in 2022:| Redwood-Potter: | $71,652 |
| California: | $83,153 |
Change in median household income between 2000 and 2022:| Redwood-Potter, California: | +95.4% |
| California: | +106.0% |
Number of households with income < $10k:| Redwood-Potter: | 4.2% (38,824) |
| California: | 4.2% (85,299) |
Number of households with income $10k - 20k:| Redwood-Potter: | 6.1% (55,933) |
| California: | 6.1% (122,966) |
Number of households with income $20k - 30k:| Redwood-Potter: | 6.4% (58,897) |
| California: | 6.4% (129,328) |
Number of households with income $30k - 40k:| Redwood-Potter: | 6.4% (59,210) |
| California: | 6.4% (130,070) |
Number of households with income $40k - 50k:| Redwood-Potter: | 6.5% (59,722) |
| California: | 6.5% (131,254) |
Number of households with income $50k - 60k:| Redwood-Potter: | 6.5% (60,236) |
| California: | 6.5% (132,382) |
Number of households with income $60k - 75k:| Redwood-Potter: | 9.4% (87,065) |
| State: | 9.4% (191,472) |
Number of households with income $75k - 100k:| Redwood-Potter: | 13.3% (122,532) |
| State: | 13.3% (269,691) |
Number of households with income $100k - 125k:| Redwood-Potter: | 10.2% (94,269) |
| State: | 10.2% (207,286) |
Number of households with income $125k - 150k:| Redwood-Potter: | 7.8% (71,879) |
| State: | 7.8% (158,259) |
Number of households with income $150k - 200k:| Redwood-Potter: | 10.3% (95,117) |
| State: | 10.3% (209,227) |
Number of households with income > $200k:| Redwood-Potter: | 13.0% (119,694) |
| California: | 13.0% (263,210) |
Aggregate household income in Redwood-Potter in 2022: $67,917,447
Median family income in Redwood-Potter in 2022:| Redwood-Potter: | $76,771 |
| State: | $87,642 |
Number of families with income < $10k:| Redwood-Potter: | 2.0% (9) |
| California: | 3.2% (48,017) |
Number of families with income $10k - 20k:| Redwood-Potter: | 10.2% (44) |
| State: | 4.1% (60,419) |
Number of families with income $20k - 30k:| Redwood-Potter: | 6.5% (28) |
| State: | 6.1% (89,742) |
Number of families with income $30k - 40k:| Redwood-Potter: | 6.0% (26) |
| State: | 6.2% (91,415) |
Number of families with income $40k - 50k:| Redwood-Potter: | 7.4% (32) |
| State: | 6.8% (100,085) |
Number of families with income $50k - 60k:| Redwood-Potter: | 10.5% (45) |
| State: | 6.7% (98,298) |
Number of families with income $75k - 100k:| Redwood-Potter: | 22.0% (95) |
| State: | 13.8% (203,439) |
Number of families with income $100k - 125k:| Redwood-Potter: | 6.9% (30) |
| State: | 10.4% (153,515) |
Number of families with income $125k - 150k:| Redwood-Potter: | 28.4% (122) |
| California: | 8.4% (124,115) |
Median non-family income in Redwood-Potter in 2022:| Redwood-Potter: | $66,924 |
| State: | $56,558 |
Change in median non-family income between 2000 and 2022:| Redwood-Potter, California: | +149.8% |
| State: | +100.2% |
Median per capita income in Redwood-Potter in 2022:| Redwood-Potter: | $30,236 |
| State: | $32,124 |
Change in median per capita income between 2000 and 2022:| Redwood-Potter, California: | +93.2% |
| State: | +120.4% |
Income statistics for other residents
Number of households with income < $10k:| Redwood-Potter: | 4.6% (357) |
| State: | 4.6% (93,035) |
Number of households with income $10k - 20k:| Redwood-Potter: | 6.3% (484) |
| State: | 6.3% (126,222) |
Number of households with income $20k - 30k:| Redwood-Potter: | 7.1% (547) |
| State: | 7.1% (142,656) |
Number of households with income $30k - 40k:| Redwood-Potter: | 8.2% (633) |
| State: | 8.2% (165,018) |
Number of households with income $40k - 50k:| Redwood-Potter: | 8.1% (621) |
| California: | 8.0% (161,732) |
Number of households with income $50k - 60k:| Redwood-Potter: | 7.6% (584) |
| State: | 7.6% (152,152) |
Number of households with income $60k - 75k:| Redwood-Potter: | 10.4% (804) |
| California: | 10.4% (209,951) |
Number of households with income $75k - 100k:| Redwood-Potter: | 14.7% (1,133) |
| State: | 14.7% (296,102) |
Number of households with income $100k - 125k:| Redwood-Potter: | 10.7% (821) |
| State: | 10.7% (214,281) |
Number of households with income $125k - 150k:| Redwood-Potter: | 7.1% (548) |
| California: | 7.1% (143,092) |
Number of households with income $150k - 200k:| Redwood-Potter: | 8.6% (660) |
| State: | 8.6% (172,215) |
Number of households with income > $200k:| Redwood-Potter: | 6.7% (514) |
| State: | 6.7% (134,102) |
Aggregate household income in Redwood-Potter in 2022: $23,582,566
Median family income in Redwood-Potter in 2022:| Redwood-Potter: | $76,981 |
| California: | $72,756 |
Number of families with income $10k - 20k:| Redwood-Potter: | 2.2% (13) |
| State: | 5.1% (82,116) |
Number of families with income $20k - 30k:| Redwood-Potter: | 4.0% (25) |
| California: | 7.0% (112,854) |
Number of families with income $30k - 40k:| Redwood-Potter: | 7.0% (43) |
| State: | 8.4% (135,938) |
Number of families with income $40k - 50k:| Redwood-Potter: | 3.0% (18) |
| State: | 8.4% (135,353) |
Number of families with income $50k - 60k:| Redwood-Potter: | 1.2% (7) |
| State: | 7.7% (124,826) |
Number of families with income $75k - 100k:| Redwood-Potter: | 14.3% (88) |
| State: | 15.2% (245,724) |
Number of families with income $100k - 125k:| Redwood-Potter: | 12.3% (76) |
| State: | 10.9% (176,716) |
Number of families with income $125k - 150k:| Redwood-Potter: | 9.6% (59) |
| State: | 7.4% (119,985) |
Number of families with income $150k - 200k:| Redwood-Potter: | 25.7% (158) |
| State: | 8.5% (137,332) |
Number of families with income > $200k:| Redwood-Potter: | 20.7% (127) |
| State: | 6.6% (106,346) |
Median non-family income in Redwood-Potter in 2022:| Redwood-Potter: | $51,001 |
| State: | $43,881 |
Change in median non-family income between 2000 and 2022:| Redwood-Potter, California: | +107.8% |
| California: | +84.6% |
Median per capita income in Redwood-Potter in 2022:| Redwood-Potter: | $36,272 |
| State: | $25,164 |
Change in median per capita income between 2000 and 2022:| Redwood-Potter, California: | +105.4% |
| State: | +137.9% |