Orangeville, New York (NY) income map, earnings map, and wages data
The median household income in Orangeville, NY in 2022 was $82,299, which was 3.3% greater than the median annual income of $79,557 across the entire state of New York. Compared to the median income of $45,208 in 2000 this represents an increase of 45.1%. The per capita income in 2022 was $37,794, which means an increase of 50.9% compared to 2000 when it was $18,547.
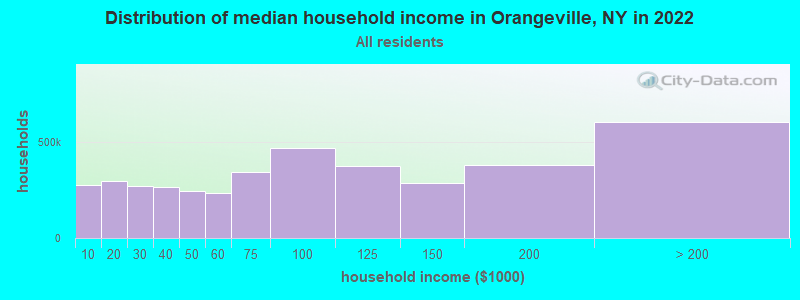
Income statistics for all residents
Median household income in Orangeville, NY in 2022:| Orangeville: | $82,300 |
| State: | $79,557 |
Change in median household income between 2000 and 2022:| Orangeville, New York: | +82.0% |
| New York: | +83.3% |
Number of households with income < $10k:| Orangeville: | 6.8% (274,972) |
| New York: | 6.8% (527,598) |
Number of households with income $10k - 20k:| Orangeville: | 7.4% (299,593) |
| New York: | 7.4% (574,940) |
Number of households with income $20k - 30k:| Orangeville: | 6.7% (269,754) |
| State: | 6.7% (517,718) |
Number of households with income $30k - 40k:| Orangeville: | 6.5% (263,979) |
| New York: | 6.5% (506,674) |
Number of households with income $40k - 50k:| Orangeville: | 6.1% (245,084) |
| State: | 6.1% (470,439) |
Number of households with income $50k - 60k:| Orangeville: | 5.8% (236,538) |
| New York: | 5.8% (454,042) |
Number of households with income $60k - 75k:| Orangeville: | 8.5% (342,530) |
| New York: | 8.5% (657,508) |
Number of households with income $75k - 100k:| Orangeville: | 11.6% (468,761) |
| New York: | 11.6% (899,824) |
Number of households with income $100k - 125k:| Orangeville: | 9.3% (377,082) |
| State: | 9.3% (723,825) |
Number of households with income $125k - 150k:| Orangeville: | 7.1% (287,801) |
| New York: | 7.1% (552,420) |
Number of households with income $150k - 200k:| Orangeville: | 9.4% (378,824) |
| State: | 9.4% (727,051) |
Number of households with income > $200k:| Orangeville: | 15.0% (605,713) |
| New York: | 15.0% (1,162,269) |
Aggregate household income in Orangeville in 2022: $5,220,167,464
Median family income in Orangeville in 2022:| Orangeville: | $94,769 |
| State: | $99,066 |
Median non-family income in Orangeville in 2022:| Orangeville: | $53,713 |
| New York: | $50,181 |
Change in median non-family income between 2000 and 2022:| Orangeville, New York: | +81.3% |
| State: | +85.4% |
Median per capita income in Orangeville in 2022:| Orangeville: | $37,794 |
| New York: | $47,421 |
Change in median per capita income between 2000 and 2022:| Orangeville, New York: | +103.8% |
| State: | +102.7% |
Income statistics for White residents
Median household income in Orangeville, NY in 2022:| Orangeville: | $82,623 |
| State: | $89,408 |
Change in median household income between 2000 and 2022:| Orangeville, New York: | +83.3% |
| New York: | +85.5% |
Number of households with income < $10k:| Orangeville: | 4.8% (104,993) |
| New York: | 4.8% (225,550) |
Number of households with income $10k - 20k:| Orangeville: | 6.1% (135,277) |
| New York: | 6.1% (289,425) |
Number of households with income $20k - 30k:| Orangeville: | 6.0% (131,214) |
| State: | 5.9% (280,254) |
Number of households with income $30k - 40k:| Orangeville: | 6.1% (135,114) |
| State: | 6.1% (288,263) |
Number of households with income $40k - 50k:| Orangeville: | 5.9% (130,473) |
| New York: | 5.9% (278,079) |
Number of households with income $50k - 60k:| Orangeville: | 5.7% (125,607) |
| State: | 5.7% (267,554) |
Number of households with income $60k - 75k:| Orangeville: | 8.5% (187,053) |
| State: | 8.4% (398,344) |
Number of households with income $75k - 100k:| Orangeville: | 11.8% (260,488) |
| State: | 11.8% (554,841) |
Number of households with income $100k - 125k:| Orangeville: | 10.0% (219,933) |
| State: | 10.0% (469,794) |
Number of households with income $125k - 150k:| Orangeville: | 7.7% (168,663) |
| State: | 7.6% (360,467) |
Number of households with income $150k - 200k:| Orangeville: | 10.1% (222,169) |
| New York: | 10.1% (477,078) |
Number of households with income > $200k:| Orangeville: | 17.4% (383,227) |
| State: | 17.6% (829,233) |
Aggregate household income in Orangeville in 2022: $3,509,953,611
Median family income in Orangeville in 2022:| Orangeville: | $96,502 |
| State: | $115,170 |
Number of families with income < $10k:| Orangeville: | 3.6% (8) |
| State: | 2.5% (68,851) |
Number of families with income $10k - 20k:| Orangeville: | 6.0% (13) |
| State: | 3.0% (83,127) |
Number of families with income $20k - 30k:| Orangeville: | 6.4% (14) |
| State: | 3.5% (97,578) |
Number of families with income $30k - 40k:| Orangeville: | 7.3% (16) |
| State: | 4.1% (114,108) |
Number of families with income $40k - 50k:| Orangeville: | 9.5% (20) |
| State: | 4.7% (130,902) |
Number of families with income $50k - 60k:| Orangeville: | 12.2% (26) |
| State: | 4.9% (135,118) |
Number of families with income $60k - 75k:| Orangeville: | 18.7% (40) |
| State: | 7.8% (216,254) |
Number of families with income $75k - 100k:| Orangeville: | 17.2% (37) |
| State: | 12.4% (342,382) |
Number of families with income $100k - 125k:| Orangeville: | 5.2% (11) |
| State: | 11.4% (314,917) |
Number of families with income $125k - 150k:| Orangeville: | 10.3% (22) |
| New York: | 9.4% (260,489) |
Number of families with income $150k - 200k:| Orangeville: | 3.6% (8) |
| State: | 13.2% (365,586) |
Median non-family income in Orangeville in 2022:| Orangeville: | $54,484 |
| New York: | $54,783 |
Change in median non-family income between 2000 and 2022:| Orangeville, New York: | +83.9% |
| State: | +87.9% |
Median per capita income in Orangeville in 2022:| Orangeville: | $39,261 |
| State: | $57,640 |
Change in median per capita income between 2000 and 2022:| Orangeville, New York: | +111.0% |
| State: | +111.6% |
Income statistics for Asian residents
Median household income in Orangeville, NY in 2022:| Orangeville: | $133,825 |
| State: | $89,947 |
Change in median household income between 2000 and 2022:| Orangeville, New York: | +77.3% |
| State: | +98.1% |
Number of households with income < $10k:| Orangeville: | 6.9% (35,357) |
| State: | 6.9% (42,537) |
Number of households with income $10k - 20k:| Orangeville: | 7.3% (37,202) |
| State: | 7.3% (44,745) |
Number of households with income $20k - 30k:| Orangeville: | 6.2% (31,855) |
| State: | 6.2% (38,249) |
Number of households with income $30k - 40k:| Orangeville: | 5.5% (28,258) |
| State: | 5.5% (33,993) |
Number of households with income $40k - 50k:| Orangeville: | 4.9% (24,803) |
| State: | 4.8% (29,795) |
Number of households with income $50k - 60k:| Orangeville: | 5.2% (26,528) |
| State: | 5.2% (32,100) |
Number of households with income $60k - 75k:| Orangeville: | 7.3% (37,066) |
| State: | 7.3% (44,615) |
Number of households with income $75k - 100k:| Orangeville: | 10.9% (55,423) |
| State: | 10.8% (66,687) |
Number of households with income $100k - 125k:| Orangeville: | 8.2% (41,641) |
| New York: | 8.2% (50,233) |
Number of households with income $125k - 150k:| Orangeville: | 7.2% (36,794) |
| State: | 7.2% (44,299) |
Number of households with income $150k - 200k:| Orangeville: | 10.4% (52,937) |
| New York: | 10.4% (63,837) |
Number of households with income > $200k:| Orangeville: | 20.1% (102,732) |
| State: | 20.1% (123,891) |
Aggregate household income in Orangeville in 2022: $3,393,528
Median family income in Orangeville in 2022:| Orangeville: | $137,467 |
| State: | $98,136 |
Median per capita income in Orangeville in 2022:| Orangeville: | $44,458 |
| New York: | $46,726 |
Change in median per capita income between 2000 and 2022:| Orangeville, New York: | +126.5% |
| State: | +126.6% |
Income statistics for Hispanic or Latino residents
Number of households with income < $10k:| Orangeville: | 10.0% (106,728) |
| State: | 9.9% (127,185) |
Number of households with income $10k - 20k:| Orangeville: | 10.7% (114,791) |
| State: | 10.7% (136,699) |
Number of households with income $20k - 30k:| Orangeville: | 8.1% (86,464) |
| State: | 8.1% (102,991) |
Number of households with income $30k - 40k:| Orangeville: | 7.8% (83,931) |
| State: | 7.8% (100,149) |
Number of households with income $40k - 50k:| Orangeville: | 6.9% (73,496) |
| New York: | 6.9% (87,760) |
Number of households with income $50k - 60k:| Orangeville: | 6.3% (67,920) |
| New York: | 6.3% (80,968) |
Number of households with income $60k - 75k:| Orangeville: | 8.6% (92,701) |
| State: | 8.7% (110,631) |
Number of households with income $75k - 100k:| Orangeville: | 11.2% (119,651) |
| New York: | 11.2% (142,787) |
Number of households with income $100k - 125k:| Orangeville: | 8.2% (87,779) |
| New York: | 8.2% (104,850) |
Number of households with income $125k - 150k:| Orangeville: | 6.3% (67,270) |
| State: | 6.3% (80,274) |
Number of households with income $150k - 200k:| Orangeville: | 7.4% (79,625) |
| State: | 7.4% (95,117) |
Number of households with income > $200k:| Orangeville: | 8.6% (91,746) |
| New York: | 8.6% (109,514) |
Median per capita income in Orangeville in 2022:| Orangeville: | $48,775 |
| State: | $29,761 |
Change in median per capita income between 2000 and 2022:| Orangeville, New York: | +127.3% |
| State: | +132.7% |