The median household income in Oneida Castle, NY in 2022 was $68,810, which was 15.6% less than the median annual income of $79,557 across the entire state of New York. Compared to the median income of $40,789 in 2000 this represents an increase of 40.7%. The per capita income in 2022 was $36,647, which means an increase of 45.3% compared to 2000 when it was $20,056.
Whole page based on the data from 2000 / 2022 when the population of Oneida Castle, New York was 627 / 692
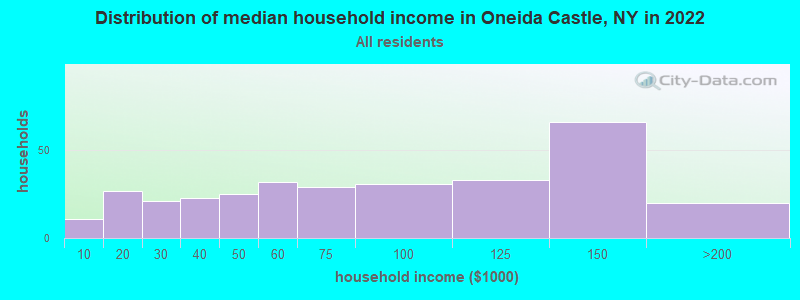
Income statistics for all residents
Median household income in Oneida Castle, NY in 2022:
Oneida Castle:
$68,810
New York:
$79,557
Change in median household income between 2000 and 2022:
Oneida Castle, New York:
+68.7%
State:
+83.3%
Number of households with income < $10k:
Oneida Castle:
3.5% (11)
State:
6.8% (527,598)
Number of households with income $10k - 20k:
Oneida Castle:
8.5% (27)
State:
7.4% (574,940)
Number of households with income $20k - 30k:
Oneida Castle:
6.6% (21)
State:
6.7% (517,718)
Number of households with income $30k - 40k:
Oneida Castle:
7.2% (23)
State:
6.5% (506,674)
Number of households with income $40k - 50k:
Oneida Castle:
7.9% (25)
New York:
6.1% (470,439)
Number of households with income $50k - 60k:
Oneida Castle:
10.1% (32)
State:
5.8% (454,042)
Number of households with income $60k - 75k:
Oneida Castle:
9.1% (29)
State:
8.5% (657,508)
Number of households with income $75k - 100k:
Oneida Castle:
9.7% (31)
State:
11.6% (899,824)
Number of households with income $100k - 125k:
Oneida Castle:
10.4% (33)
State:
9.3% (723,825)
Number of households with income $125k - 150k:
Oneida Castle:
20.8% (66)
State:
7.1% (552,420)
Number of households with income $150k - 200k:
Oneida Castle:
6.3% (20)
State:
9.4% (727,051)
Number of households with income > $200k:
Oneida Castle:
0.0% (0)
State:
15.0% (1,162,269)
Aggregate household income in Oneida Castle in 2022: $25,343,683
Median family income in Oneida Castle in 2022:
Oneida Castle:
$72,975
New York:
$99,066
Number of families with income < $10k:
Oneida Castle:
5.8% (10)
New York:
4.2% (197,409)
Number of families with income $10k - 20k:
Oneida Castle:
9.0% (15)
New York:
4.3% (205,373)
Number of families with income $20k - 30k:
Oneida Castle:
1.8% (3)
State:
5.1% (241,229)
Number of families with income $30k - 40k:
Oneida Castle:
4.5% (8)
New York:
5.5% (259,233)
Number of families with income $40k - 50k:
Oneida Castle:
13.0% (22)
State:
5.5% (259,113)
Number of families with income $50k - 60k:
Oneida Castle:
14.1% (24)
State:
5.4% (255,320)
Number of families with income $60k - 75k:
Oneida Castle:
5.0% (9)
New York:
8.2% (388,624)
Number of families with income $75k - 100k:
Oneida Castle:
13.4% (23)
State:
12.3% (583,110)
Number of families with income $100k - 125k:
Oneida Castle:
13.8% (23)
State:
10.6% (500,579)
Number of families with income $125k - 150k:
Oneida Castle:
11.6% (20)
New York:
8.5% (400,594)
Number of families with income $150k - 200k:
Oneida Castle:
7.9% (13)
State:
11.6% (551,650)
Median non-family income in Oneida Castle in 2022:
Oneida Castle:
$63,989
State:
$50,181
Change in median non-family income between 2000 and 2022:
Oneida Castle, New York:
+143.8%
State:
+85.4%
Median per capita income in Oneida Castle in 2022:
Oneida Castle:
$36,647
State:
$47,421
Change in median per capita income between 2000 and 2022:
Oneida Castle, New York:
+82.7%
State:
+102.7%
Income statistics for White residents
Median household income in Oneida Castle, NY in 2022:
Oneida Castle:
$68,648
New York:
$89,408
Change in median household income between 2000 and 2022:
Oneida Castle, New York:
+68.8%
State:
+85.5%
Number of households with income < $10k:
Oneida Castle:
3.3% (10)
New York:
4.8% (225,550)
Number of households with income $10k - 20k:
Oneida Castle:
7.0% (21)
State:
6.1% (289,425)
Number of households with income $20k - 30k:
Oneida Castle:
7.0% (21)
State:
5.9% (280,254)
Number of households with income $30k - 40k:
Oneida Castle:
7.7% (23)
New York:
6.1% (288,263)
Number of households with income $40k - 50k:
Oneida Castle:
8.7% (26)
State:
5.9% (278,079)
Number of households with income $50k - 60k:
Oneida Castle:
10.4% (31)
New York:
5.7% (267,554)
Number of households with income $60k - 75k:
Oneida Castle:
8.7% (26)
State:
8.4% (398,344)
Number of households with income $75k - 100k:
Oneida Castle:
10.4% (31)
State:
11.8% (554,841)
Number of households with income $100k - 125k:
Oneida Castle:
11.0% (33)
State:
10.0% (469,794)
Number of households with income $125k - 150k:
Oneida Castle:
19.7% (59)
State:
7.6% (360,467)
Number of households with income $150k - 200k:
Oneida Castle:
6.0% (18)
New York:
10.1% (477,078)
Number of households with income > $200k:
Oneida Castle:
0.0% (0)
State:
17.6% (829,233)
Aggregate household income in Oneida Castle in 2022: $24,018,827
Median family income in Oneida Castle in 2022:
Oneida Castle:
$71,644
State:
$115,170
Number of families with income < $10k:
Oneida Castle:
6.0% (9)
State:
2.5% (68,851)
Number of families with income $10k - 20k:
Oneida Castle:
12.3% (20)
State:
3.0% (83,127)
Number of families with income $20k - 30k:
Oneida Castle:
1.9% (3)
State:
3.5% (97,578)
Number of families with income $30k - 40k:
Oneida Castle:
3.7% (6)
State:
4.1% (114,108)
Number of families with income $40k - 50k:
Oneida Castle:
15.0% (24)
New York:
4.7% (130,902)
Number of families with income $50k - 60k:
Oneida Castle:
12.8% (20)
State:
4.9% (135,118)
Number of families with income $60k - 75k:
Oneida Castle:
4.7% (7)
New York:
7.8% (216,254)
Number of families with income $75k - 100k:
Oneida Castle:
14.0% (22)
State:
12.4% (342,382)
Number of families with income $100k - 125k:
Oneida Castle:
14.2% (23)
New York:
11.4% (314,917)
Number of families with income $125k - 150k:
Oneida Castle:
7.6% (12)
State:
9.4% (260,489)
Number of families with income $150k - 200k:
Oneida Castle:
7.8% (12)
New York:
13.2% (365,586)
Median non-family income in Oneida Castle in 2022:
Oneida Castle:
$66,214
New York:
$54,783
Median per capita income in Oneida Castle in 2022:
Oneida Castle:
$37,960
State:
$57,640
Change in median per capita income between 2000 and 2022:
Oneida Castle, New York:
+88.7%
New York:
+111.6%
Income statistics for Black or African American residents
Median per capita income in Oneida Castle in 2022:
Oneida Castle:
$10,899
New York:
$31,947
Change in median per capita income between 2000 and 2022:
Oneida Castle, New York:
+32.9%
New York:
+106.1%
Income statistics for Hispanic or Latino residents
Number of households with income < $10k:
Oneida Castle:
0.0% (0)
State:
9.9% (127,185)
Number of households with income $10k - 20k:
Oneida Castle:
42.9% (6)
State:
10.7% (136,699)
Number of households with income $20k - 30k:
Oneida Castle:
0.0% (0)
State:
8.1% (102,991)
Number of households with income $30k - 40k:
Oneida Castle:
0.0% (0)
New York:
7.8% (100,149)
Number of households with income $40k - 50k:
Oneida Castle:
0.0% (0)
State:
6.9% (87,760)
Number of households with income $50k - 60k:
Oneida Castle:
0.0% (0)
New York:
6.3% (80,968)
Number of households with income $60k - 75k:
Oneida Castle:
0.0% (0)
New York:
8.7% (110,631)
Number of households with income $75k - 100k:
Oneida Castle:
0.0% (0)
New York:
11.2% (142,787)
Number of households with income $100k - 125k:
Oneida Castle:
0.0% (0)
New York:
8.2% (104,850)
Number of households with income $125k - 150k:
Oneida Castle:
57.1% (8)
State:
6.3% (80,274)
Number of households with income $150k - 200k:
Oneida Castle:
0.0% (0)
State:
7.4% (95,117)
Number of households with income > $200k:
Oneida Castle:
0.0% (0)
State:
8.6% (109,514)
Median per capita income in Oneida Castle in 2022:
Oneida Castle:
$11,448
State:
$29,761
Income statistics for American Indian and Alaska Native residents
Median per capita income in Oneida Castle in 2022:
Oneida Castle:
$14,806
State:
$25,837
Change in median per capita income between 2000 and 2022:: -52.7%
Oneida Castle, New York:
-52.7%
New York:
+99.6%
Income statistics for Multirace residents
Median per capita income in Oneida Castle in 2022:
Oneida Castle:
$14,993
State:
$36,931
Discuss Oneida Castle, New York (NY) on our hugely popular New York forum.